
Source: https://www.dreamstime.com/stock-vector-illustrations-clipart
The most recently available annual breakdown of sources of electricity generation is for 2022-23. Full details are provided in Table 13 in the Australian Energy Update 2024 produced by the Australian Government (https://www.energy.gov.au/sites/default/files/2024-08/australian_energy_update_2024.pdf).
In 2022-23 two-thirds (66%) of electricity came from fossil fuels (black coal, brown coal and gas). Fossils fuels are still by far the dominant source of electricity on an annualised basis. However, the huge increase over the past few years in solar PV has meant that there has been a fundamental change in the primary sources of electricity between the day and the night. This difference between the day and the night has critical implications for ongoing management of the electricity supply grid and will be the focus of much of this instalment.
Most of the information provided and discussed here has been obtained from the RenewEconomy NEM-WATCH (all power generation – https://reneweconomy.com.au/nem-watch/ ) and Aneroid Energy (wind power – https://anero.id/energy/wind-energy) websites.
The Nem-Watch site reports the distribution of electricity sources for Australia’s Southern and Eastern Power Grid (Qld, NSW, Vic, Sa, Tas) and for WA. These data are updated every 5-30 mins over a 24h period.
Middle of the Day
A “typical” current (October 2024) around mid-day distribution of electricity supply is shown below in graphical and tabular format (source: NEM-Watch).
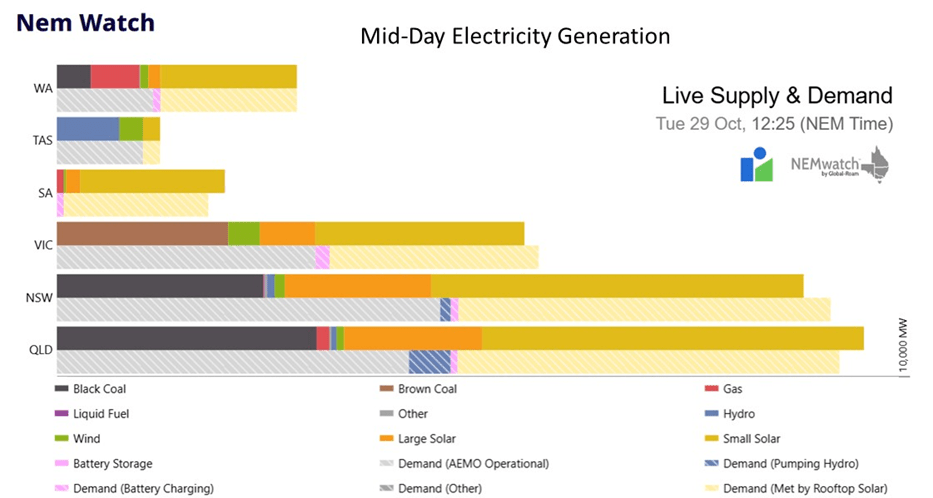
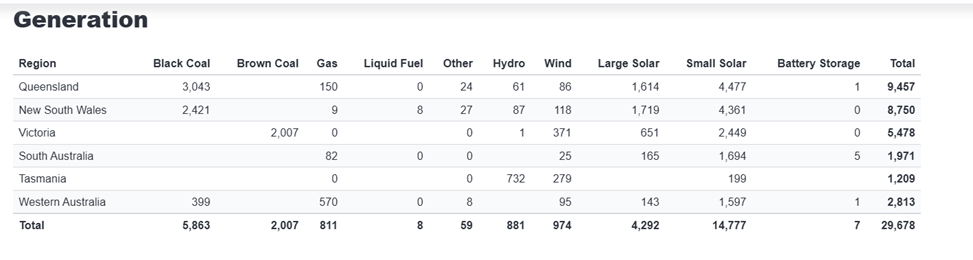
What is immediately apparent is the very large contribution from rooftop (small solar) and large scale solar (the large orange bars on right of the plots above for each state) to the totals in all states apart from Tasmania. This mid-day (ie solar maximum) contribution is very consistent from day-to-day in the absence of cloud cover. Moreover, at this specific time the input from rooftop solar was much greater than for large solar, perhaps indicating that large solar was being curtailed.
Wind Power
In contrast to the regularity of solar, the contribution from wind tends to be highly variable from day-to-day (see below October 2024 output plot for wind: source – https://anero.id/energy/wind-energy) noting that there is currently about 11000 MW of nameplate wind capacity feeding into the southern and eastern power grid. A good performing wind farm in Australia is regarded as one that has a capacity factor of 37%. That is, on average the dispatchable electricity is a bit more than 1/3 of the nameplate.

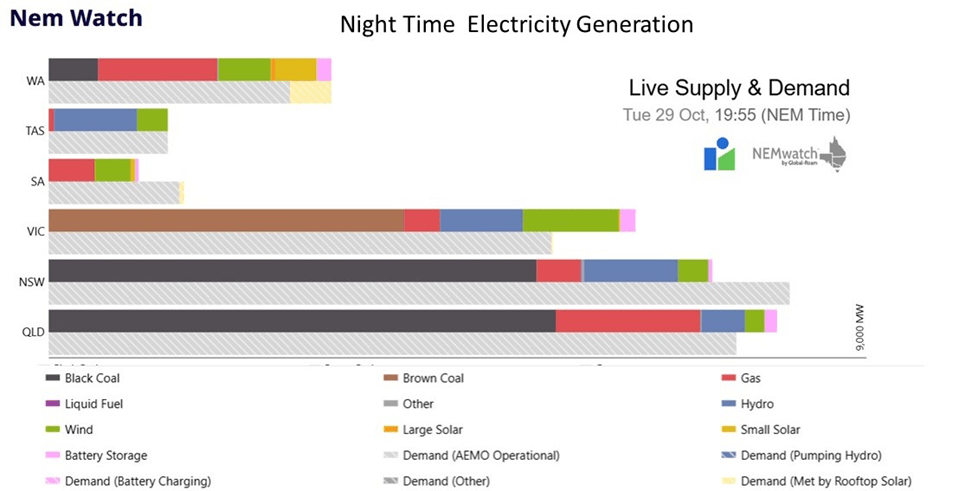
Night Time
By the time that night has fallen (figure below) there is a complete reversal of the major sources of electricity with coal and gas becoming major sources in all states apart from Tas, and by far the dominant sources in Qld, NSW, Vic and WA. The coal is shown by the black and brown bars and gas by the red bars.

What About South Australia?
South Australia is often regarded as being the “poster child” for the uptake of renewable energy by a mainland state. Yes, it is true that for limited periods the state has been running on 100% renewables. However, the reality is that without the backup provided by gas generators and by inputs of top-up power via the grid connections with other states, SA would be without sufficient electricity for extended periods of time.
Summary
The specific examples I have given above have been selected to illustrate the extremes that do occur between day and night. There are periods when both wind and hydroelectricity make larger contributions in the evening and night, reducing the demand on coal and gas. Hydro is a particularly consistent performer in Qld, NSW and Vic. In contrast WA has no hydro, and generation in Tasmania is dominated by hydro essentially all the time.
So, in summary during the peak sunlight hours rooftop solar currently makes the major contribution to total generation, ranging from 57% in NSW to 94% in SA. Indeed, there is now so much rooftop solar that it is starting to threaten grid stability. Hence, the recently announced move by AEMO (the Australian Electricity Market Operator) to start to limit the export of rooftop solar into the grid.
When the sun goes down coal and gas dominate the grid, ranging from 51% in SA to over 80 % in Qld and NSW. For this dependence (for 16h of the day!) on fossils fuels to be reduced, not only will there need to be much more renewable capacity installed but there will have to be in tandem a massive increase in the amount of storage (batteries and pumped hydro) from its current low levels.
In my next instalment I will be discussing capacity factors and what these mean for the amount of electricity that can be provided by renewables.
Discover more from My Blog has become My Nuclear Journey
Subscribe to get the latest posts sent to your email.
