What Does It Take to Close a Coal Mine and a Coal-fired Power Station?

Burning coal to produce electricity is a terrible waste when coal has so many other important uses. At this time, the energy from it is still essential for the manufacture of wind turbines, transmission lines and solar panels.

It is not always realised that coal is needed:

as a source of essential ingredients for the manufacture of many dyes, pharmaceuticals, explosives, perfumes, plastics, paints and photographic materials; and

to produce the very high temperatures needed to manufacture steel, cement, aluminium, bricks, glass and some metals and chemicals.

Latrobe Valley, Victoria, Australia

A few weeks ago, David and I attended a conference in the Latrobe Valley held by CRC TiME called “Bridging Diverse Interests”.  https://crctime.com.au/ When a coal mine or any mine is closed down, a complex rehabilitation process follows. Delegates at the conference had the opportunity to visit both Hazelwood and Yallourn brown coal mine  and power station sites.

The Latrobe Valley mines are large, close together, close to local communities and infrastructure. The power stations have a small footprint on each mine site. Mine Land Rehabilitation Authority

Hazelwood Power Station and its associated coal mine stopped operating in 2017. The owner, French company Engie plans to spend a billion dollars rehabilitating the mine site by filling the giant mining pit with water. The volume needed will be greater than that of Sydney Harbour. The plan is still under discussion by many stakeholders. We heard from some of the community groups about their hopes for the site. The closure has already had a big impact on local townships and the staff who lost their jobs. Three years after the closure, a survey found these highly skilled workers were still only earning an average of 50 % of the income received prior to the closure. Questions remain about the feasibility of the rehabilitation plan. Enough water may not be available and contaminant levels in the ash have been highlighted by a green group as a possible long-term issue.
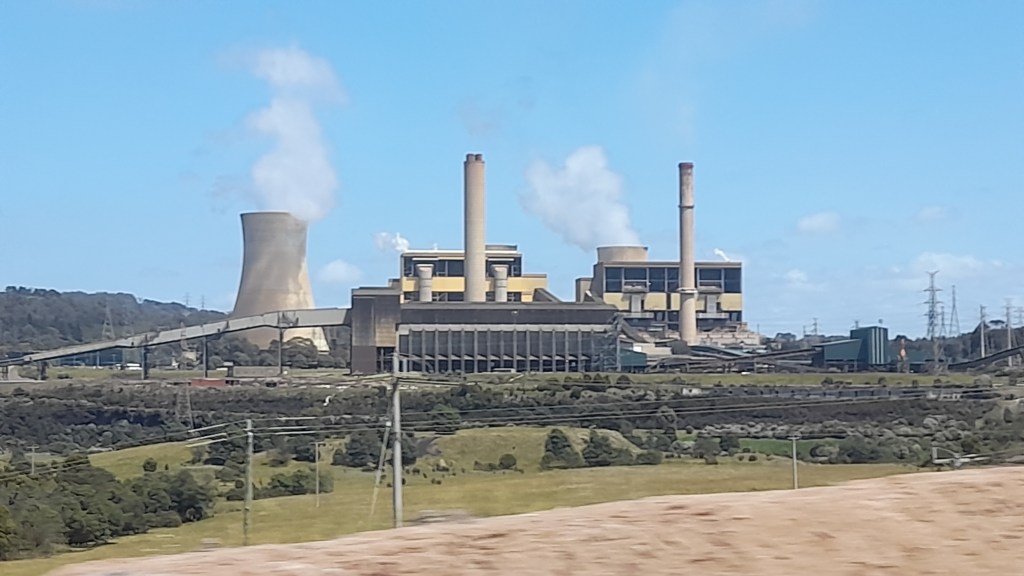
Yallourn Power Station – photo by David Jones

Yallourn is scheduled to close in 2028. River water, currently used by the power station for cooling, will be used to fill the pit.  It will take decades.  The ground is soft, like the brown coal itself, and collapse of the sides of the pit must be carefully avoided. The ash is low in contaminants and should not pose a problem with water quality. Often there is disparity between the requirements of the regulators, the local community, the First Nations People and the technical and economic considerations of the miners. Just because the community desires a certain outcome, it may not be technically possible and safe.

Yallourn Coal Mine: the coal seam is 80 metres thick and can be seen in the background. Lines of trees have been planted in the bottom of the pit. Photo by David Jones

The third power station, Loy Yang, and its associated mine is also scheduled for closure in 2035 bu.

What is the future of the Latrobe Valley? Will it be left with lots of orphaned transmission lines and closed businesses, medical facilities and schools? This will happen unless viable solutions developed in consultation with regional communities are identified and implemented. It has been suggested in other forums that coal-fired power stations could be replaced by nuclear power stations thus making use of these industrial sites and transmission infrastructure, while providing similar jobs for the already skilled workforce. Participants I spoke to from other places in Australia were pro-nuclear but locals were wary. The social licence was not there because of a historical distrust of Government processes. Technically the sites would need to be evaluated for ground stability.

A central theme of the conference was that First Nations People should be properly and fully involved early in the process of planning mine closure.

Mining Rehabilitation

The NT Government is working in partnership with the Australian Government and Traditional Owners to rehabilitate the former Rum Jungle Uranium Mine Site. Early rehabilitation work was undertaken in the 80s and the traditional owner groups were not involved in the process. The site does not meet today’s standards. The current project will remove a major impediment to the site’s return in good order to the Kungarakan and Warai people.

The inspirational project leader, Jackie Hartnett of NT Government, gave an insightful presentation on the project. She has worked hard to find solutions acceptable to all the traditional owners with the tremendous assistance of Gowan Bush, the community manager. Jackie is undertaking the rehabilitation work by training and employing the local people. As a mother myself, I noted that a female birthing site will be restored by sending a stream back to its original path. Nobody knows whether this will be fully successful but the women are delighted.

My husband Dr. David Jones gave a technical presentation on the Rum Jungle Rehabilitation Project on behalf of NT Government as an Industry Fellow of UQ Sustainable Minerals Institute. https://smi.uq.edu.au/ It is noteworthy that the main source of environmental problems on the site is acid mine drainage with copper levels causing the issues rather than uranium or radioactivity.

The presentations were praised by the head of INAP as a new paradigm for mine rehabilitation. INAP stands for International Network for Acid Prevention and is an organisation set up by the mining industry itself to find, promulgate, and use the best methods of preventing and coping with acid and metalliferous drainage (AMD). AMD can occur with any type of mine depending on the geology of the area.

AMD is one of the most serious and potentially enduring environmental problems for the mining industry. Left unchecked, it can result in such long-term water quality impacts that could well be this industry’s most harmful legacy.”  https://www.inap.com.au/

How do we use coal apart from making electricity?

China uses the most coal in the world with the U.S and India in  a distant second place. The U.S. has 2/3 of the world’s known supply. Australia only mines 4% of the world’s coal but we export 80% of it, making Australia the second largest coal exporter in the world. We export low sulfur bituminous coal for energy production used to manufacture “renewable energy infrastructure” and the highly valued and rarer metallurgical coal, also known as coking coal, to produce steel and cement and critical metals and other ingredients.

There are 4 main types of coal and the world still has 400 years’ supply at our current rate of use.

Peat is the youngest form of coal. It is low quality and is burnt for fuel and heating on a small scale or even used as a soil conditioner by gardeners.

Lignite or Brown Coal is about 150 million years old. It has about 50% carbon and low sulfur content. It is used to produce electricity but is relatively inefficient because it has a high water content and must be dried first. This results in the highest amount of carbon dioxide per unit of electricity produced. The Latrobe Valley Coal mines produce brown coal.

Bituminous Coal has a high carbon content ( 50-80%) but often has a high sulfur content. It is the most plentiful type of coal in the U.S. and is about 300 million years old. Sub-bituminous coal has a lower sulfur content and carbon content and is a little younger.  Sub-bituminous coal is the preferred form for power plants.

Anthracite, often known as Metallurgical Coal. is the highest quality of coal with a high carbon  (95%) but low sulfur content and is about 500 million years old. Australia has large supplies of this form of coal which is valued for all its uses apart from electricity production. There is limited supply worldwide and it almost a sin to burn it up to produce electricity. It is the hardest and cleanest burning coal.

Anthracite is valuable

·        as a source of essential ingredients for the manufacture of many dyes, pharmaceuticals, explosives, perfumes, plastics, paints and photographic materials; and

·        to produce the very high temperatures needed to produce steel, cement, aluminium, bricks, glass and some metals and chemicals. The carbon in anthracite forms part of the matrix of steel.

·        It is used in smelting operations to release metals such as lithium from their ores – a very energy intensive process.

Coal pyrolysis, or destructive distillation, is an old technology that started on a commercial scale during the industrial revolution. When coal is burnt without the presence of oxygen, three main products result: coal gas; coal tar; and coke.

Coal tar is the actual source of the essential ingredients to make many products such as some dyes, pharmaceuticals, explosives, perfumes, plastics, paints and photographic materials.

Various forms of gas can substitute for some of coal’s uses. It can act to stabilise the electricity grid much more efficiently and produces far less carbon dioxide per unit of electricity produced.

Hydrogen and some types of nuclear power may be able replace the high temperatures produced by coal and gas as the technologies mature. The production and use of hydrogen is a very energy inefficient.  

What about Oil? Why Can’t We Stop It’s Use Tomorrow?

Nearly half of a barrel of oil is separated as gasoline/petrol. Slightly more than half is used as feedstock in the manufacture of more than 6000 products.  I found a list of 144 of them.  Just taking one item, combs. Can you imagine making combs the old way from turtle shell or bone? The world’s population has grown so much it is hard to imagine doing without many of the items listed below.  And what do we plan to do with all the waste stream of petrol in the future?

Can we face a world without antibiotics and anaesthetics or hospitals? Imagine there are no building materials except wood or mud or straw, no fertilizers or pillows or candles or ink and no forests or wildlife. We still need coal and oil to produce electric cars.

We have a lot of thinking and planning to do. Imagine a world without any:

SolventsDiesel fuelMotor OilBearing Grease
InkFloor WaxBallpoint PensFootball Cleats
UpholsterySweatersBoatsInsecticides
Bicycle TiresSports Car BodiesNail PolishFishing lures
DressesTyresGolf BagsPerfumes
CassettesDishwasher partsTool BoxesShoe Polish
Motorcycle HelmetCaulkingPetroleum JellyTransparent Tape
CD PlayerFaucet WashersAntisepticsClothesline
CurtainsFood PreservativesBasketballsSoap
Vitamin CapsulesAntihistaminesPursesShoes
DashboardsCortisoneDeodorantShoelace Aglets
PuttyDyesPanty HoseRefrigerant
PercolatorsLife JacketsRubbing AlcoholLinings
SkisTV CabinetsShag RugsElectrician’s Tape
Tool RacksCar Battery CasesEpoxyPaint
MopsSlacksInsect RepellentOil Filters
UmbrellasYarnFertilizersHair Colouring
RoofingToilet SeatsFishing RodsLipstick
Denture AdhesiveLinoleumIce Cube TraysSynthetic Rubber
SpeakersPlastic WoodElectric BlanketsGlycerine
Tennis RacketsRubber CementFishing BootsDice
Nylon RopeCandlesTrash BagsHouse Paint
Water PipesHand LotionRoller SkatesSurf Boards
ShampooWheelsPaint RollersShower Curtains
Guitar StringsLuggageAspirinSafety Glasses
AntifreezeFootball HelmetsAwningsEyeglasses
ClothesToothbrushesIce ChestsFootballs
CombsCD’s & DVD’sPaint BrushesDetergents
VaporizersBalloonsSun GlassesTents
Heart ValvesCrayonsParachutesTelephones
EnamelPillowsDishesCameras
AnaestheticsArtificial TurfArtificial limbsBandages
DenturesModel CarsFolding DoorsHair Curlers
Cold creamMovie filmContact lensesDrinking Cups
Fan BeltsCar EnamelShaving CreamAmmonia
RefrigeratorsGolf BallsToothpasteGasoline
https://www.ranken-energy.com/index.php/products-made-from-petroleum/

Australia is Almost Carbon Neutral but Could Go Backwards Very Fast

This is a particularly important blog for Australians. It is time we learnt about our land and just what happens in Australia.

Earth Systems and Climate Change Hub provided a big red flag and some fascinating insights into Australia’s total carbon budget from 2010 to 2019. The ESCC Hub is funded by the Australian Government’s National Environmental Science Program and feeds data into the international entity the Global Carbon Project. Carbon budgets provide information and data to inform and raise awareness about how the world is tracking against the global climate change mitigation challenge. https://nespclimate.com.au/wp-content/uploads/2021/06/ESCC_Global-and-regional-carbon-budgets_Brochure.pdf 

Good News: Australia was almost carbon neutral for the ten years from 2010 to 2019.

We only emitted 0.1% of the carbon dioxide added to the atmosphere worldwide over that 10-year period. It is our wonderful natural land that acted as a giant carbon sink squirrelling away almost all the carbon dioxide we produced. The situation varies from year to year depending on weather conditions and our actions.

Yes, we can save our biodiversity and do our bit to fight climate change at the same time. Indeed, we must do so.

Bad News: bushfires produced half the carbon dioxide.

In many parts of Australia, when bushfires start, we simply let them burn. Most firefighting is done by an ageing voluntary fire service with little equipment and even this equipment is old and often no longer safe.

Work undertaken, particularly in the Northern Territory, shows that traditional fire management practices work well to reduce emissions. Indeed, our First Nations People earn carbon credits using their traditional cultural practices. Using properly timed cool burning techniques, the carbon dioxide produced by fire is greatly diminished. If these practices were used more widely, great savings could be made in the loss of human life, property, and biodiversity. Indeed, scientific studies have shown that biodiversity can even be improved.

As the climate gets hotter, the potential damage done by bushfire in Australia will increase dramatically unless we do all we can to protect our land from fire and fight fires quickly and effectively when they do start. It has already been shown that access to water bombing helicopters can result in fire being stopped very quickly. Timing is critical – the sooner a fire is reached, and action taken, the less the damage. Satellites can now provide the necessary information in real time.

A First Nations man told me recently that Australia spends less than 5% on fire management and 95% paying for the damage afterwards. He wanted to know why we had it so backwards.

We are spending billions of dollars to reduce the emission of carbon dioxide when we produce electricity. Yet, fire releases far more carbon dioxide and has the potential to become much worse. If we stay on our current pathway, we will destroy the ability of our land to be a carbon sink.

Worldwide, natural systems on both land and sea still sequester over half the world’s production of carbon dioxide each year. But there are signs of this slowing. So far, as we have produced more carbon dioxide each year, the natural systems have kept up. We need to be helping natural systems as much as we can, and this is particularly important in Australia. Worldwide, the oceans do half of the work and land systems the other half. But in Australia, our natural land-based systems can sequester all of our carbon dioxide.

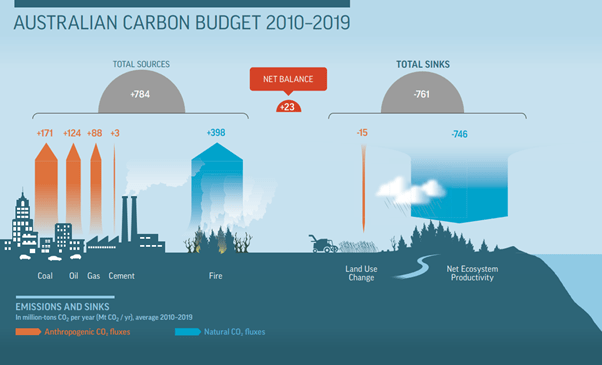
Figure: The Australian carbon budget, including natural and human-caused CO2 sources and sinks (and their net effect in the atmosphere). Annual fluxes are the average for the 2010-2019 decade. Units are in million tons of CO2.

What should we do with the resources we have?

  1. Upgrade our fire fighting ability with quicker, scientifically backed fire fighting techniques.  A stitch in time saves nine and saves lots of human lives and property, carbon emissions PLUS our precious BIODIVERSITY.
  2. Use the best sources of energy. Ask: Which power systems impact the least land area, are low carbon, use the least materials in their manufacture,  and can be used to make steel and bricks and cement?
  3. Australia is dotted with pit lakes from mining activities.  Many of these pit lakes may be suitable as a source of water for water bombing in regional areas.

Australia’s Carbon Dioxide Budget

In the process of researching information for this blog, I have learnt a lot that surprised me.  My final conclusions are that we need to be concentrating on 2 things in Australia:

  • Helping nature to do its work in every way we can.
  • Using nuclear power for energy production.  

Know the Enemy

It always helps to know the enemy as best we can when planning the strategy for any fight. It increases our chances of success and reduces costs to ourselves or things we value. When we plan strategies for dealing with “Climate Change”, we really need to understand the big picture or we risk wasting all our resources fiddling around the edges.  Many countries around the world are spending or planning to spend trillions of dollars and so far there has been no global reduction of carbon dioxide emissions to our atmosphere. Meanwhile Nature is being trashed with the survival of more and more species being threatened every year that passes. The threat of food and water shortages is leading to a very unstable world politically as climate refugees try to survive.

Our ability to measure carbon budgets has improved with time.  The recent uses of satellite data and AI systems are impressive.

This blog begins by presenting text and diagrams from the Earth Systems and Climate Change Hub  https://nespclimate.com.au/wp-content/uploads/2021/06/ESCC_Global-and-regional-carbon-budgets_Brochure.pdf  The ESCC Hub is funded by the Australian Government’s National Environmental Science Program. To learn a lot more about their activities, visit https://nespclimate.com.au/  The ESCC Hub feeds data into the international entity the Global Carbon Project. Their diagrams are simpler than those I gave in my last blog but the data is very similar even though the units used are different. I suggest that readers take the time to look closely at the diagrams in this blog.

Tracking emissions of carbon dioxide over time through carbon budgets allows us to quantify and explain how human activities and natural processes add to and subtract emissions from the atmosphere. This can help to identify where the biggest opportunities for mitigation exist, and how carbon-climate feedbacks might help or hinder efforts to achieve global targets for reducing greenhouse gas emissions.

Carbon budgets track sources and sinks of carbon dioxide and their transfer between the atmosphere, ocean and land.

The Global Carbon Dioxide Budget

I start with the Global budget so it can be compared with the unique features of Australia’s carbon budget.

Source: Global Carbon Project – the numbers are in billions of tons of carbon dioxide per year averaged between 2010 and 2019.

The arrows show the major fluxes. So, fossil fuels and industry produce 34.4 billion tons per year (Pg CO2/yr) while land use change emits 5.7 for a total carbon dioxide source of 40.1 billion tons CO2/yr.

The land sink is 12.5 billion tons of CO2 per year and the ocean absorbs 9.2 making a total sink of 21.7 billion tons of carbon dioxide per year. Again, the data shows that natural systems were removing more than half of anthropogenic (man-made) carbon dioxide between 2010 and 2019 averaged over this period.

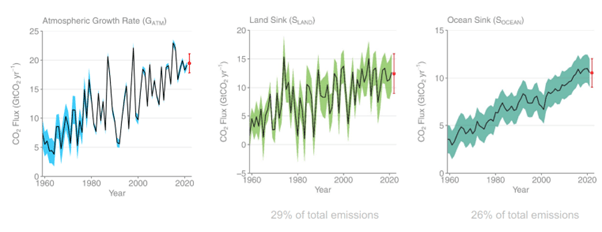
The land and ocean draw down atmospheric CO2 and act as sinks to slow the accumulation of human caused CO2 emissions, thereby slowing the progression of climate change. Combined, land and ocean sinks removed an annual average of 54 per cent of all CO2 from human activities – with land sinks removing about 31 per cent of all annual emissions and ocean sinks about 23 per cent. These natural sinks therefore play an important service in mitigating climate change.

Although CO2 has continued to accumulate in the atmosphere, the proportion of emissions removed by land and ocean sinks has remained constant over the past 60 years. This suggests that strong self-regulating feedbacks have led the sinks to increase their carbon sequestration capacity over time. However, there is large interannual variability of both the land and ocean sink strength in response to climate variability (e.g. El Niño) and extremes. This suggests likely sensitivity of the sinks to future changes in climate and variability.

Tracking land and ocean sinks and how they may change under a warming and variable climate is vital for understanding the climate change mitigation challenge faced by the international community.

https://nespclimate.com.au/wp-content/uploads/2021/06/ESCC_Global-and-regional-carbon-budgets_Brochure. The brochure is only 4 pages long and worth reading.

Some assessments focus on the carbon cycle as it relates to carbon dioxide just like the one given above. Methane and other greenhouse gases are assessed separately. The assessments discussed in this blog are undertaken in this way. The numbers given track carbon as calculated on the weight of carbon dioxide: CO2 units.  The numbers are higher by 44/12 than when data is presented in C units.  That means all the numbers will be 3.66 times higher than those given in my previous blog post where the data was in C units. As long as all the numbers are in either C units or CO2 units, they are directly comparable. But I have noted assessments that mix up these units and come to erroneous conclusions. All of this blog is in CO2 units.

The Effect of Land-Use ChangesDeforestation, the main driver of land-use emissions, has remained high in the last decade. Re/afforestation has counterbalanced approximately half of the deforestation emissions.

The ocean and land sinks have continued to grow with increasing atmospheric CO2  and take about half of the emissions. Climate change is already reducing these growths by about 4% (ocean sink) and 17% (land sink). Friedlingstein et al 2022; Global Carbon Project 2022. https://www.globalcarbonproject.org/carbonbudget/22/files/GCP_CarbonBudget_2022.pdf

Land Sink removed 29% of total emissions while the Ocean Sink removed 26%.

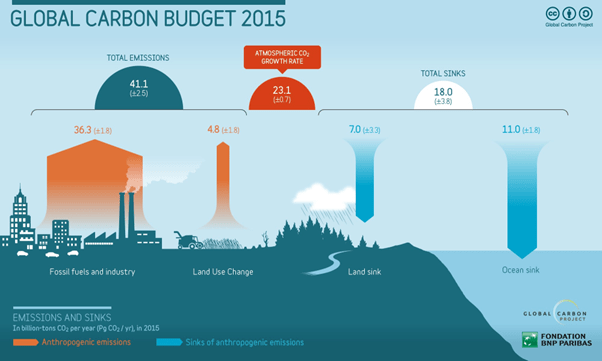
Surprisingly, Nature still manages to remove almost 60% of our emissions BUT 2015 was a bad year globally as illustrated below due to land use change. We cannot keep destroying the land sink. It does far more for us than all the renewables have so far.  A Gt is the same as a billion tons and the same as Pg.

The Australian Carbon Budget

Note that the data for Australia is in millions of tons of CO2 per year while the global data is in billions of tons of CO2  per year.  Our net emission of CO2  to the atmosphere was 23 million tons per year between 2010 and 2019 on average while the global net emissions were 18.4 billion tons per year. This suggests that Australia only produced 0.12% of the net emissions and that we were nearly carbon neutral from 2010 to 2019.

If only it were that simple.  What about our coal and gas exports? The reality that we are buying our wind turbines and solar systems and batteries and EV cars manufactured overseas some of which has been produced using energy from our coal. Simplistically, one could suggest that Australia’s transition to renewables is actually bad for climate change mitigation. Particularly so when we destroy natural system carbon sequestration when installing wind and solar.

Ref: ESCC Hub brochure – units are in millions of tons of carbon dioxide per year.

In Australia, our natural landscape, our natural ecosystems, removed twice as much carbon dioxide as we produced by using fossil fuels (746 to 386 million tons per year) on average for 2010 to 2019. However, this record was spoilt by fire(398). Thus, on average we fed climate change with our carbon dioxide emissions of only 23 million tons per year.

Unfortunately, Australia is a land of heat, fire and drought. 2019 was a particularly bad year. Due to drought our ecosystems were a source of carbon dioxide and not a major sink. Higher bushfire levels added to our totals.  One of our major sources of carbon dioxide is fire that burns our dry tropical savanna lands over large areas. These fires are usually allowed to burn out and are not fought.  For years now programs to lessen the impact of the fires has been undertaken by our indigenous peoples in the Northern Territory using “cool burns”. In bad years the CO2 from fires can negate all the carbon sequestration land-based Nature does: https://bg.copernicus.org/articles/10/851/2013/

It is our savannah lands that usually do most of the sequestration work. However, In very wet years our arid lands also remove vast quantities of carbon from the atmosphere and tie it up in soil.

Every attempt must be made to keep our land-based ecosystems photosynthesising as much as possible which will maximise carbon sequestration. This means keeping soils damp and not allowing them to heat up any more than can be helped. It means ensuring that we don’t make Australia more arid than it is now. Experiences in many countries around the world show that it is possible to help Nature help us by making arid lands wetter again. This is an enormous topic in itself and will be covered in future blogs.

How We Are Failing to Reduce Regional Climate Effects

Several classic situations exist in my current home state of Queensland.

Stupidly, we built a major transmission line along the peaks  of the Great Dividing Range.  This meant that Renewable Energy Project proponents wanted (needed?) to place their wind turbines and solar installations near this transmission line. This leads to the disturbance then destruction of some of our best remaining forests much earlier than might happen with Climate Change. It has been known for a long time that even narrow roads pushed through forest can change the composition of vegetation up to 100 metres on either side – edge effects. The giant wind turbines require very wide steep roads winding through the mountains, blasting of the mountain tops, direct loss of thousands of ha of forest – step by step loss of our effective land sink.

We forget that in the area near wind turbines, soil and forest dries out making fire risk much higher.

The next examples of poor planning and policy relates to solar energy.  In Queensland, the big solar farms need to be turned down when there is too much electricity produced during the day. Never mind negative prices for large scale solar, operators still get their carbon credits which still makes operating them a financially attractive investment.

 When the sun goes down solar energy stops. So, at night most of our power comes from coal-fired power stations which still need to run all day as they cannot ramp up from zero.

Roof top solar does a great job but subsidies have not encouraged battery storage with roof top solar. The Australian Energy Market Operator (AEMO) has no means to control roof top solar.

We keep hearing how the “Energy Plan” will create jobs.  Up here in the Far North, tourism is a very important part of our economy.  Mangling our Natural Assets doesn’t help.  Coal Fired Power Stations hire lots of skilled workers. When the power stations close their income plummets. https://theconversation.com/heres-what-happens-to-workers-when-coal-fired-power-plants-close-it-isnt-good-215434

The pseudo “Green” economy seems to replace some of these jobs with lower paid jobs – what someone described to me as “Toilet Jobs”. In contrast, replacing coal fired power stations with nuclear facilities would keep these skilled workers and provide even better paid positions.

Lastly, fire- fighting in most of Australia is dependent on Volunteer Rural Fire Brigades with little equipment. Should we be spending far more resources on fire mitigation? Logically, it takes a lot more effort to fight big fires than to deal with them adequately when they first start. Satellite systems and AI could be used to pinpoint fires early. Would we be better to spend all those billions of dollars on the very best fire-fighting personnel and equipment rather than imported renewables?

In conclusion, I believe we need to be concentrating on 2 things in Australia:

  • Helping nature to do its work in every way we can.
  • Using nuclear power for energy production.  

The Carbon Budgets of Natural Landscapes

Mother Nature is still doing a magnificent job removing carbon dioxide from the atmosphere. Over half of the carbon dioxide, we produce from fossil fuels and other carbon intensive activities is taken up by the ocean and vegetation on the land.

The Global Carbon Budget

There are many entities around the world, doing their best to measure and calculate the earth’s carbon budget. The clearest summary I have seen so far is shown below and copied from an overview article Carbon Stocks, Fluxes and the Land Sector  by Graham Diedrich February 07, 2022. https://www.canr.msu.edu/news/carbon-fluxes-and-carbon-stocks

The figure above shows global carbon stocks and fluxes. The boxes represent the stocks of carbon in its different forms, but the numbers always relate to the amount of carbon. The arrows show the movement of carbon in or out of these carbon storages. The annual carbon exchange flux is represented numerically in PgC per year units, in which 1 PgC is equal to 1 billion metric tons of carbon. Nature has stored away huge quantities of carbon over eons of time as coal, gas and oil. Even more carbon is stored in the deep ocean (37 trillion tonnes). Each year we are burning carbon so that about 7.8 billion metric tonnes of carbon join with oxygen and add to the carbon dioxide already in the atmosphere. Land use change adds even more as we desecrate forests and release carbon from soils.

Mother Nature is still doing a magnificent job removing carbon dioxide from the atmosphere. Over half of the carbon dioxide, we produce from fossil fuels and other carbon intensive activities is taken up by the ocean and vegetation on the land. The movement of carbon into the soil is very substantial but very variable and hard to measure. Note just how much carbon is stored in soil and permafrost.

Why Care About Natural Terrestrial Ecosystems

Nature provides a range of services such as:

  • Capturing and storing carbon.
  • Regulating climate – lowering the intensity of droughts and floods while stabilising temperatures.
  • Maintaining water balance – helping to make it rain and storing and cleaning water.
  • Providing biodiversity – bees to koalas to earthworms and magpies.
  • Creating jobs in ecotourism.
  • Providing resources for our use including our food.
  • Manufacturing soil.

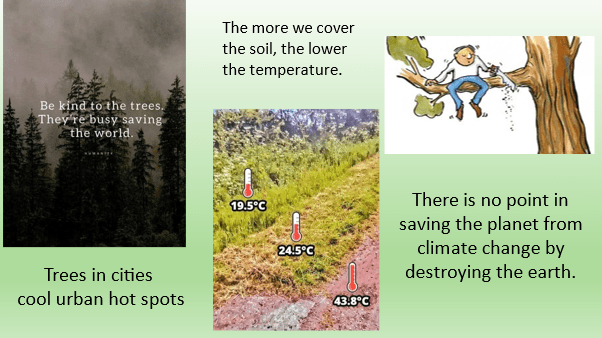
Forests are particularly important not just for providing shade and storing lots of carbon, but they lower the earth’s temperature by as much as a degree. They do this through evapotranspiration, a process similar to the cooling produced by evaporative air conditioning. Some trees such as our eucalyptus also emit chemicals that trigger cloud formation providing yet more cooling effect.

A slide from one of my talks

But Australia’s natural ecosystems are at risk from:

  • climate change and variability – extreme heat events and droughts,
  • fire – carbon stored in woody vegetation is vulnerable to increased fire risk through burning under climate change,
  • land-use change particularly land clearing,
  • disturbance including invasive species, and disease.

Death of vegetation from drought stress, extreme disturbance events, disease, and pests could also result in increased carbon release to the atmosphere and changes to CO2 emissions from soils. An issue often overlooked is the release of water from soil as vegetation cover lessens. Lower soil water levels reduce the rate of photosynthesis and hence carbon removal.

Factors That Affect Nature’s Role in Reducing Carbon Dioxide in the Air

The vegetation on Earth holds a lot of carbon, somewhere between 450 and 650 billion tons of carbon (PgC). Just how much carbon is sequestered as vegetation each year is a delicate balance between photosynthesis and plant respiration and horror – wildfires or as we know them in Australia bush fires. During photosynthesis plants take up carbon dioxide and convert it to carbohydrates while releasing oxygen. During respiration plants take up oxygen and release carbon dioxide.

Lots of scientists are looking at the factors that effect the rate of photosynthesis and respiration by plants. What would it take to tip the balance in the wrong direction? What we know is that increasing carbon dioxide levels in the air are increasing photosynthesis. But far more important is the water available to plants and the temperature. There seems to be a maximum temperature for many plant species. Increasing temperature increases photosynthesis until the maximum is reached then as temperatures become even higher, photosynthesis falls away – heat stress. Droughts decrease carbon uptake by plants. Very wet years in Central Australia can result in massive increases in carbon uptake even over a short period of time. Unfortunately, plant respiration seems to continually go up as temperatures climb.

Will plants adapt to the changing conditions? It has been noted that plants in dry northern Australia recover from fire faster now and become carbon sinks again after a fire made the area a carbon source.

It is not surprising that seasonal variation is found depending on the weather. Winters are cooler. Rainfall patterns vary considerably. In Australia, there are major differences between El Nino and La Nina years. Long droughts in Australia can cause the more arid regions to become carbon sources.

Forests Buffer Thermal Fluctuation Better than Non-forests

A systematic study of thermal buffer ability (TBA) of different vegetation types showed that forests and wetlands buffer thermal fluctuation better than non-forests (grasslands, savannas, and croplands). Notably, seriously disturbed and young planted forests displayed a greatly reduced TBA as low as that of non-forests at high latitudes. Canopy height was a primary controller of TBA of forests, while the TBA of grasslands and savannas were mainly determined by energy partition, water availability, and carbon sequestration rates. Protecting mature forests is critical to mitigate thermal fluctuation under extreme events. https://www.sciencedirect.com/science/article/abs/pii/S0168192320300964?via%3Dihub

An introduction to the Australian and New Zealand flux tower network – OzFlux

OzFlux is the regional Australian and New Zealand flux tower network that aims to provide a continental-scale national research facility to monitor and assess trends, and improve predictions, of Australia’s terrestrial biosphere and climate. https://bg.copernicus.org/articles/13/5895/2016/  and https://ozflux.org.au/index.html

Many universities and other research entities form the network and the OzFlux website provides hundreds of research articles if you wish to read more detailed information. OzFlux is part of a worldwide network FLEXNET.

Studies in Australia are measuring factors that effect photosynthesis and respiration, the effect of fires and other stressors. The earliest measurements were made two decades ago.  Since then, lots more monitoring points have been added and some removed.  The monitoring data collected by OzFlex and FLEXNET is used to calculate and understand the factors increasing carbon dioxide in the air to work out the best strategies to adopt to climate change and mitigate it. OzFlex has helped us to understand the major roles the savanna lands and arid desert play in Australia’s carbon balance.

The Protection of Our Ecosystems is Our Most  Important Action

We must do everything we can to slow the loss of natural vegetation in Australia. Otherwise, we face a future where our carbon sinks become carbon sources and Australia becomes one of the hottest places on Earth.

Regional climate protection is in our hands.  Global Climate Change is not. I will explain more in the next blog post and look at Australia’s carbon balance in more detail.

And for those readers who like a little more complexity, I include a few diagrams below from an older IPCC report. The numbers are outdated.