Australia is Almost Carbon Neutral but Could Go Backwards Very Fast

This is a particularly important blog for Australians. It is time we learnt about our land and just what happens in Australia.

Earth Systems and Climate Change Hub provided a big red flag and some fascinating insights into Australia’s total carbon budget from 2010 to 2019. The ESCC Hub is funded by the Australian Government’s National Environmental Science Program and feeds data into the international entity the Global Carbon Project. Carbon budgets provide information and data to inform and raise awareness about how the world is tracking against the global climate change mitigation challenge. https://nespclimate.com.au/wp-content/uploads/2021/06/ESCC_Global-and-regional-carbon-budgets_Brochure.pdf 

Good News: Australia was almost carbon neutral for the ten years from 2010 to 2019.

We only emitted 0.1% of the carbon dioxide added to the atmosphere worldwide over that 10-year period. It is our wonderful natural land that acted as a giant carbon sink squirrelling away almost all the carbon dioxide we produced. The situation varies from year to year depending on weather conditions and our actions.

Yes, we can save our biodiversity and do our bit to fight climate change at the same time. Indeed, we must do so.

Bad News: bushfires produced half the carbon dioxide.

In many parts of Australia, when bushfires start, we simply let them burn. Most firefighting is done by an ageing voluntary fire service with little equipment and even this equipment is old and often no longer safe.

Work undertaken, particularly in the Northern Territory, shows that traditional fire management practices work well to reduce emissions. Indeed, our First Nations People earn carbon credits using their traditional cultural practices. Using properly timed cool burning techniques, the carbon dioxide produced by fire is greatly diminished. If these practices were used more widely, great savings could be made in the loss of human life, property, and biodiversity. Indeed, scientific studies have shown that biodiversity can even be improved.

As the climate gets hotter, the potential damage done by bushfire in Australia will increase dramatically unless we do all we can to protect our land from fire and fight fires quickly and effectively when they do start. It has already been shown that access to water bombing helicopters can result in fire being stopped very quickly. Timing is critical – the sooner a fire is reached, and action taken, the less the damage. Satellites can now provide the necessary information in real time.

A First Nations man told me recently that Australia spends less than 5% on fire management and 95% paying for the damage afterwards. He wanted to know why we had it so backwards.

We are spending billions of dollars to reduce the emission of carbon dioxide when we produce electricity. Yet, fire releases far more carbon dioxide and has the potential to become much worse. If we stay on our current pathway, we will destroy the ability of our land to be a carbon sink.

Worldwide, natural systems on both land and sea still sequester over half the world’s production of carbon dioxide each year. But there are signs of this slowing. So far, as we have produced more carbon dioxide each year, the natural systems have kept up. We need to be helping natural systems as much as we can, and this is particularly important in Australia. Worldwide, the oceans do half of the work and land systems the other half. But in Australia, our natural land-based systems can sequester all of our carbon dioxide.

Figure: The Australian carbon budget, including natural and human-caused CO2 sources and sinks (and their net effect in the atmosphere). Annual fluxes are the average for the 2010-2019 decade. Units are in million tons of CO2.

What should we do with the resources we have?

  1. Upgrade our fire fighting ability with quicker, scientifically backed fire fighting techniques.  A stitch in time saves nine and saves lots of human lives and property, carbon emissions PLUS our precious BIODIVERSITY.
  2. Use the best sources of energy. Ask: Which power systems impact the least land area, are low carbon, use the least materials in their manufacture,  and can be used to make steel and bricks and cement?
  3. Australia is dotted with pit lakes from mining activities.  Many of these pit lakes may be suitable as a source of water for water bombing in regional areas.

The Carbon Budgets of Natural Landscapes

Mother Nature is still doing a magnificent job removing carbon dioxide from the atmosphere. Over half of the carbon dioxide, we produce from fossil fuels and other carbon intensive activities is taken up by the ocean and vegetation on the land.

The Global Carbon Budget

There are many entities around the world, doing their best to measure and calculate the earth’s carbon budget. The clearest summary I have seen so far is shown below and copied from an overview article Carbon Stocks, Fluxes and the Land Sector  by Graham Diedrich February 07, 2022. https://www.canr.msu.edu/news/carbon-fluxes-and-carbon-stocks

The figure above shows global carbon stocks and fluxes. The boxes represent the stocks of carbon in its different forms, but the numbers always relate to the amount of carbon. The arrows show the movement of carbon in or out of these carbon storages. The annual carbon exchange flux is represented numerically in PgC per year units, in which 1 PgC is equal to 1 billion metric tons of carbon. Nature has stored away huge quantities of carbon over eons of time as coal, gas and oil. Even more carbon is stored in the deep ocean (37 trillion tonnes). Each year we are burning carbon so that about 7.8 billion metric tonnes of carbon join with oxygen and add to the carbon dioxide already in the atmosphere. Land use change adds even more as we desecrate forests and release carbon from soils.

Mother Nature is still doing a magnificent job removing carbon dioxide from the atmosphere. Over half of the carbon dioxide, we produce from fossil fuels and other carbon intensive activities is taken up by the ocean and vegetation on the land. The movement of carbon into the soil is very substantial but very variable and hard to measure. Note just how much carbon is stored in soil and permafrost.

Why Care About Natural Terrestrial Ecosystems

Nature provides a range of services such as:

  • Capturing and storing carbon.
  • Regulating climate – lowering the intensity of droughts and floods while stabilising temperatures.
  • Maintaining water balance – helping to make it rain and storing and cleaning water.
  • Providing biodiversity – bees to koalas to earthworms and magpies.
  • Creating jobs in ecotourism.
  • Providing resources for our use including our food.
  • Manufacturing soil.

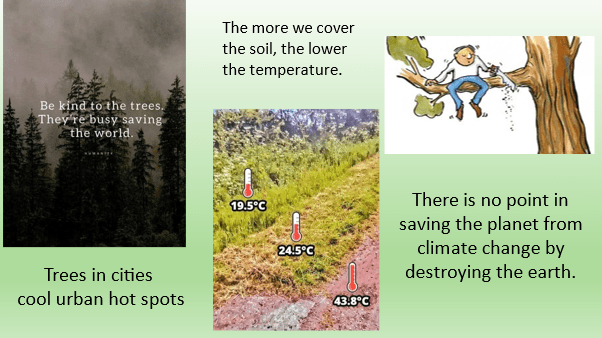
Forests are particularly important not just for providing shade and storing lots of carbon, but they lower the earth’s temperature by as much as a degree. They do this through evapotranspiration, a process similar to the cooling produced by evaporative air conditioning. Some trees such as our eucalyptus also emit chemicals that trigger cloud formation providing yet more cooling effect.

A slide from one of my talks

But Australia’s natural ecosystems are at risk from:

  • climate change and variability – extreme heat events and droughts,
  • fire – carbon stored in woody vegetation is vulnerable to increased fire risk through burning under climate change,
  • land-use change particularly land clearing,
  • disturbance including invasive species, and disease.

Death of vegetation from drought stress, extreme disturbance events, disease, and pests could also result in increased carbon release to the atmosphere and changes to CO2 emissions from soils. An issue often overlooked is the release of water from soil as vegetation cover lessens. Lower soil water levels reduce the rate of photosynthesis and hence carbon removal.

Factors That Affect Nature’s Role in Reducing Carbon Dioxide in the Air

The vegetation on Earth holds a lot of carbon, somewhere between 450 and 650 billion tons of carbon (PgC). Just how much carbon is sequestered as vegetation each year is a delicate balance between photosynthesis and plant respiration and horror – wildfires or as we know them in Australia bush fires. During photosynthesis plants take up carbon dioxide and convert it to carbohydrates while releasing oxygen. During respiration plants take up oxygen and release carbon dioxide.

Lots of scientists are looking at the factors that effect the rate of photosynthesis and respiration by plants. What would it take to tip the balance in the wrong direction? What we know is that increasing carbon dioxide levels in the air are increasing photosynthesis. But far more important is the water available to plants and the temperature. There seems to be a maximum temperature for many plant species. Increasing temperature increases photosynthesis until the maximum is reached then as temperatures become even higher, photosynthesis falls away – heat stress. Droughts decrease carbon uptake by plants. Very wet years in Central Australia can result in massive increases in carbon uptake even over a short period of time. Unfortunately, plant respiration seems to continually go up as temperatures climb.

Will plants adapt to the changing conditions? It has been noted that plants in dry northern Australia recover from fire faster now and become carbon sinks again after a fire made the area a carbon source.

It is not surprising that seasonal variation is found depending on the weather. Winters are cooler. Rainfall patterns vary considerably. In Australia, there are major differences between El Nino and La Nina years. Long droughts in Australia can cause the more arid regions to become carbon sources.

Forests Buffer Thermal Fluctuation Better than Non-forests

A systematic study of thermal buffer ability (TBA) of different vegetation types showed that forests and wetlands buffer thermal fluctuation better than non-forests (grasslands, savannas, and croplands). Notably, seriously disturbed and young planted forests displayed a greatly reduced TBA as low as that of non-forests at high latitudes. Canopy height was a primary controller of TBA of forests, while the TBA of grasslands and savannas were mainly determined by energy partition, water availability, and carbon sequestration rates. Protecting mature forests is critical to mitigate thermal fluctuation under extreme events. https://www.sciencedirect.com/science/article/abs/pii/S0168192320300964?via%3Dihub

An introduction to the Australian and New Zealand flux tower network – OzFlux

OzFlux is the regional Australian and New Zealand flux tower network that aims to provide a continental-scale national research facility to monitor and assess trends, and improve predictions, of Australia’s terrestrial biosphere and climate. https://bg.copernicus.org/articles/13/5895/2016/  and https://ozflux.org.au/index.html

Many universities and other research entities form the network and the OzFlux website provides hundreds of research articles if you wish to read more detailed information. OzFlux is part of a worldwide network FLEXNET.

Studies in Australia are measuring factors that effect photosynthesis and respiration, the effect of fires and other stressors. The earliest measurements were made two decades ago.  Since then, lots more monitoring points have been added and some removed.  The monitoring data collected by OzFlex and FLEXNET is used to calculate and understand the factors increasing carbon dioxide in the air to work out the best strategies to adopt to climate change and mitigate it. OzFlex has helped us to understand the major roles the savanna lands and arid desert play in Australia’s carbon balance.

The Protection of Our Ecosystems is Our Most  Important Action

We must do everything we can to slow the loss of natural vegetation in Australia. Otherwise, we face a future where our carbon sinks become carbon sources and Australia becomes one of the hottest places on Earth.

Regional climate protection is in our hands.  Global Climate Change is not. I will explain more in the next blog post and look at Australia’s carbon balance in more detail.

And for those readers who like a little more complexity, I include a few diagrams below from an older IPCC report. The numbers are outdated.