This is a difficult challenge. It is one we all face daily. But it is a particularly hard task for politicians. Working out policies with the right balance between the needs of constituents today and the future of a country is essential. So far democracies under strong benevolent leaders seem to do this best. The 20th Century attempts at Communism and Nazism failed.
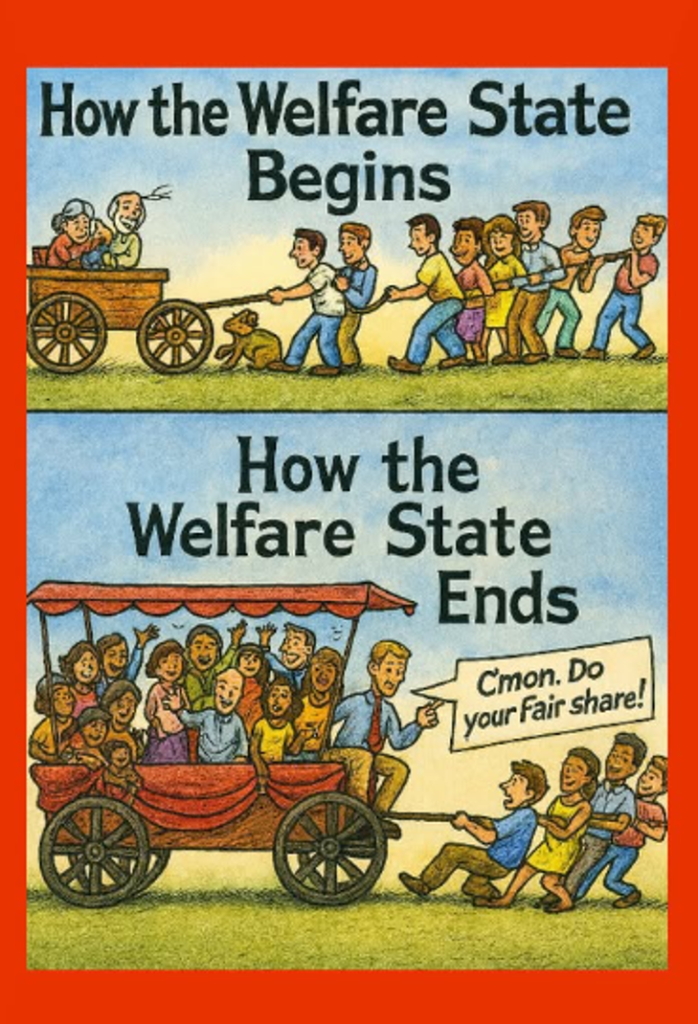
Source unknown – copied from a friend’s Facebook page.
The cartoon suggests that the balance fails because of greed and entitlement. But is that always the case? To get the balance right, there does need to be enough people pulling the wagon to balance the load in the cart.
What Causes the Imbalance?
In Australia a number of factors suggest themselves. They have arisen over many decades and/or the leadership of many political parties.
We are an aging population.
After WW2 we had an explosion of babies. Yes, I am one of the early Boomers.
We are no longer have enough babies to replace ourselves. This is not just happening in Western Nations and is worthy of a blog or two as are many of the following topics.
We have the highest proportion of public servants in the world
We also have a great many entities servicing the programs of the public servants. While these entities and their staff pay taxes, it is only a proportion of the tax money paid to them to undertake these services.
We decided that Service Industries were the Future – “The Clever Country“
We belittled manufacturing and the skilled personnel that created so much of what we now buy from China or India. We stopped most manual arts courses at schools. We belittled TAFE and valued a university education more. Did we get the balance right?
Today’s Labour Laws ask Tradesmen to take on Apprentices and Pay For Them
Tradesmen tell me that most apprentices have few skills and take up a lot of their time and money. When they are finally paying their way, they leave.
When my tradesman husband did his apprenticeship in the 60s, he was paid barely enough to cover the cost of travelling to work. He went to Technical School after work in his own hours. In other words, he was treated like a student.
We believed in a Global Playing Field
Australia removed all its tariffs and protection for local industries and tried to compete on the global stage when most of our competitors kept their tariffs and Government support. And yes, that does include China.
Many of our Small Businesses are in Trouble.
Their operating costs are too high. They are failing and closing their doors. Any incentives to take financial risks and work long hours are disappearing.
Do we need to support and laud our farmers more?
Australian farmers are very efficient in world terms, yet we are asking them to take more and more of the financial risk with lesser return. We show them little understanding.
We bring in lots of immigrants
We need their skills and their labour, but we don’t have the infrastructure to support them. Housing is expensive and insufficient.
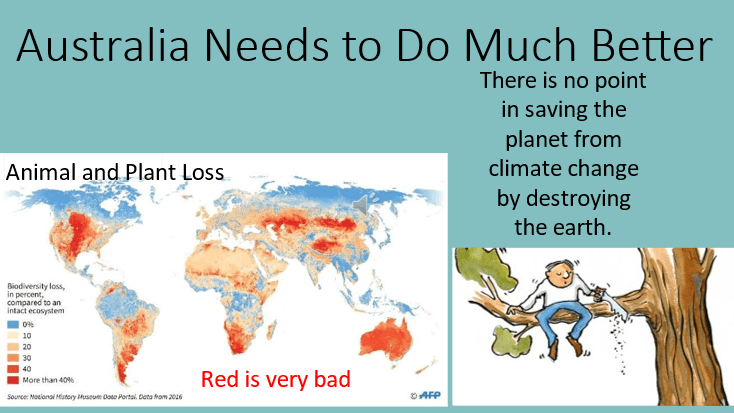
Finding the Balance between Protecting the Environment and Development.
As an environmental scientist working within development projects both here in Australia and in Asia, I see a system that is not working. It is not balanced. There seems to be a current belief that there has to be a choice between one and the other.
Our city planning is woeful. We are building cities that will suffer badly as the world keeps heating up.
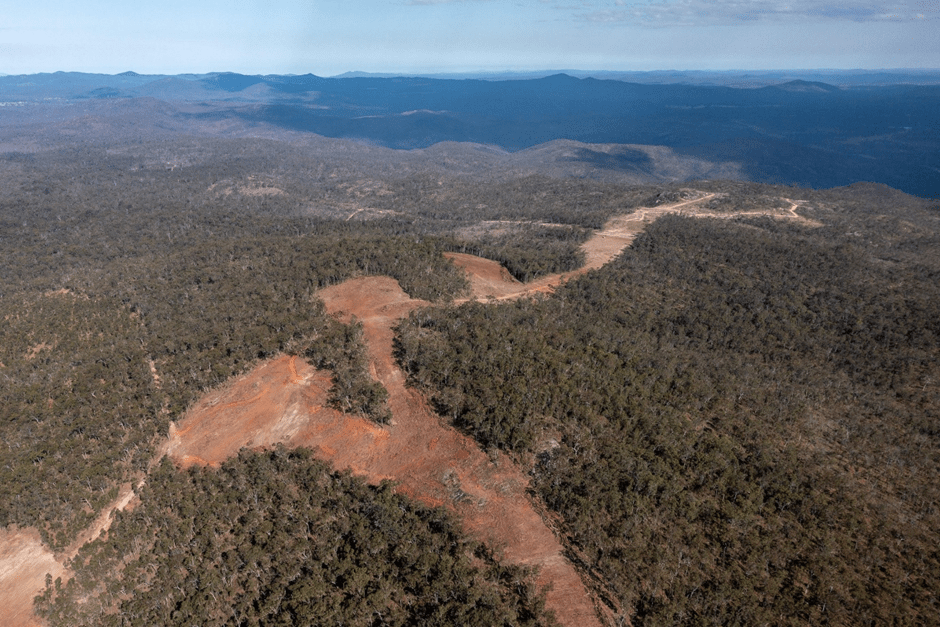
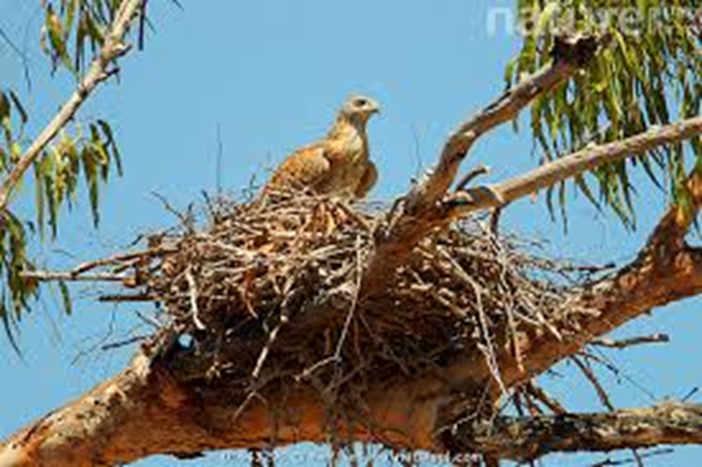
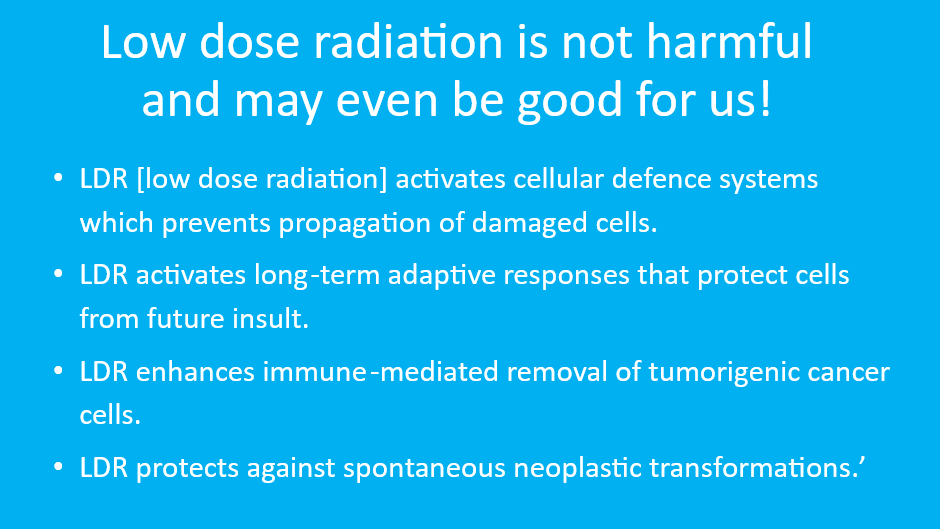
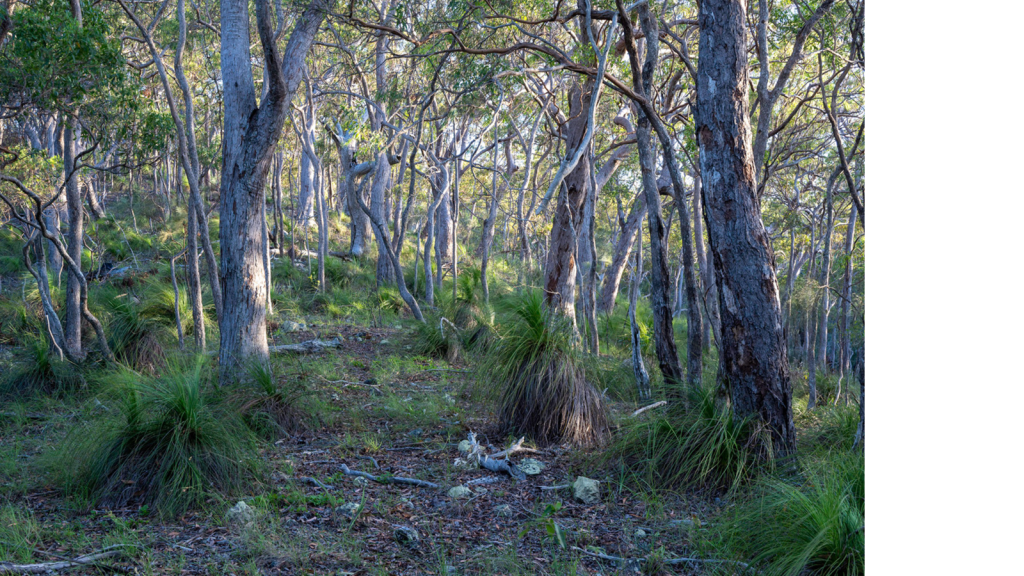
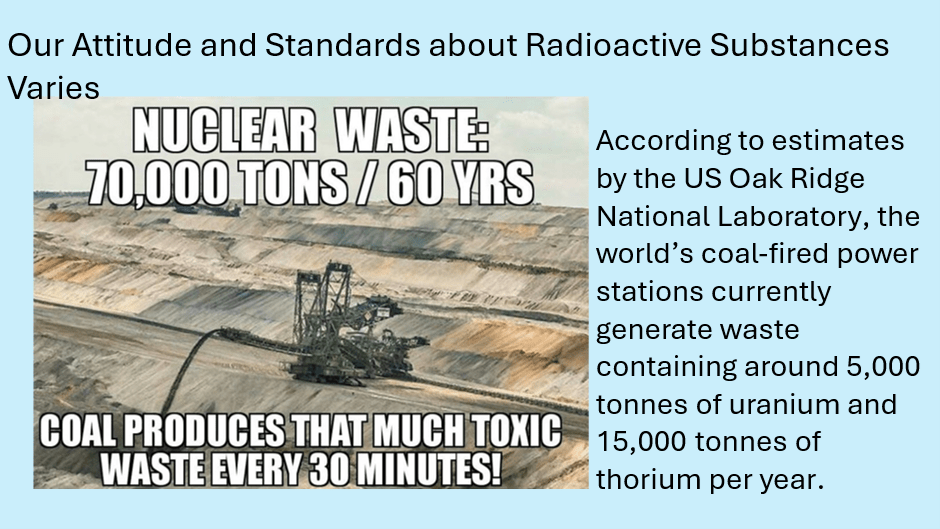
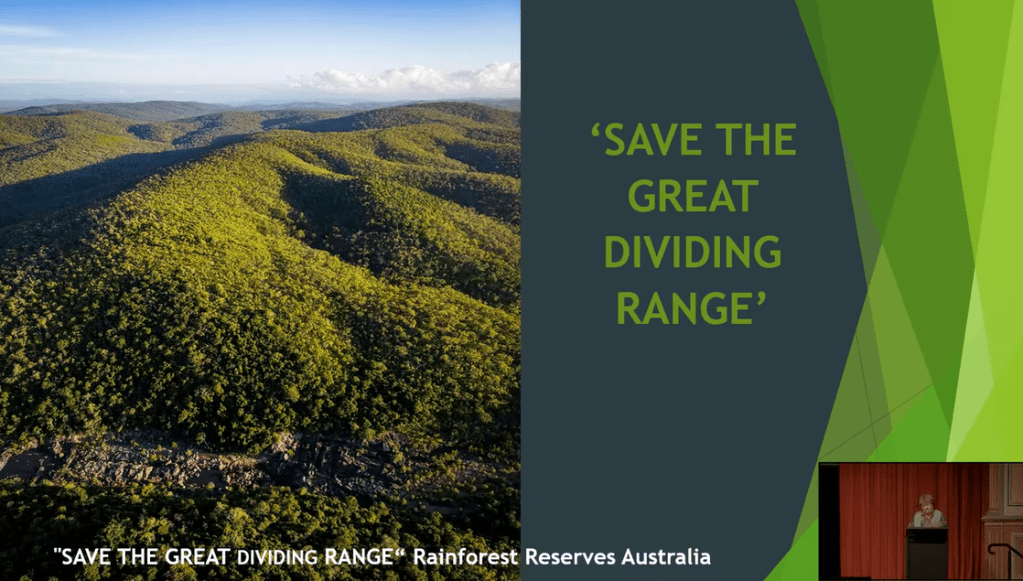
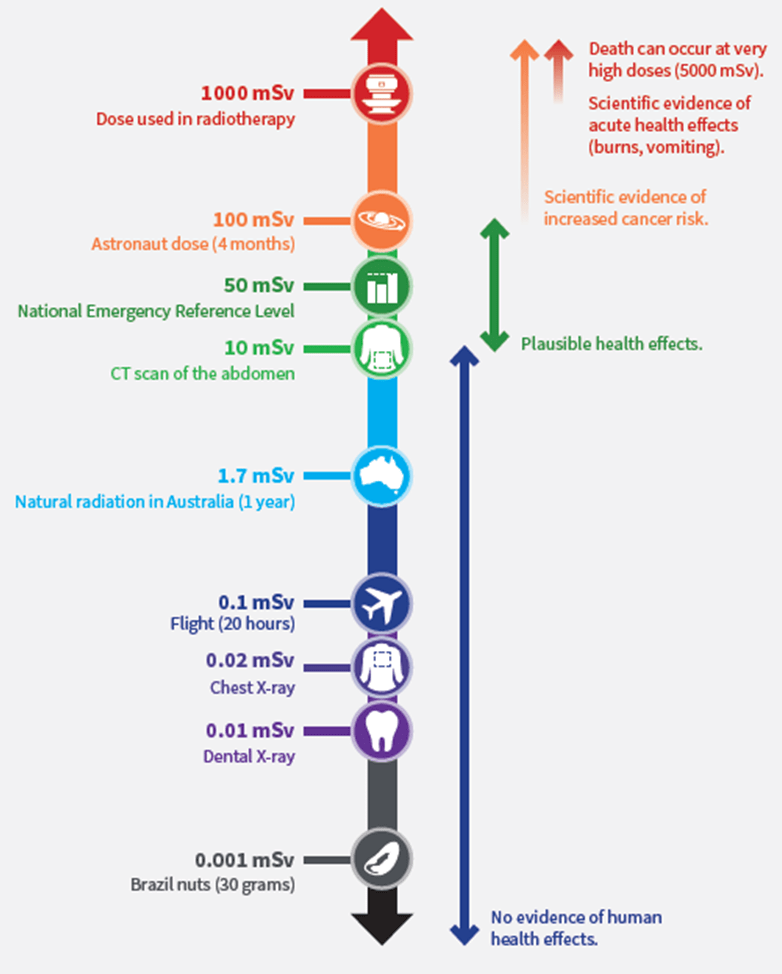
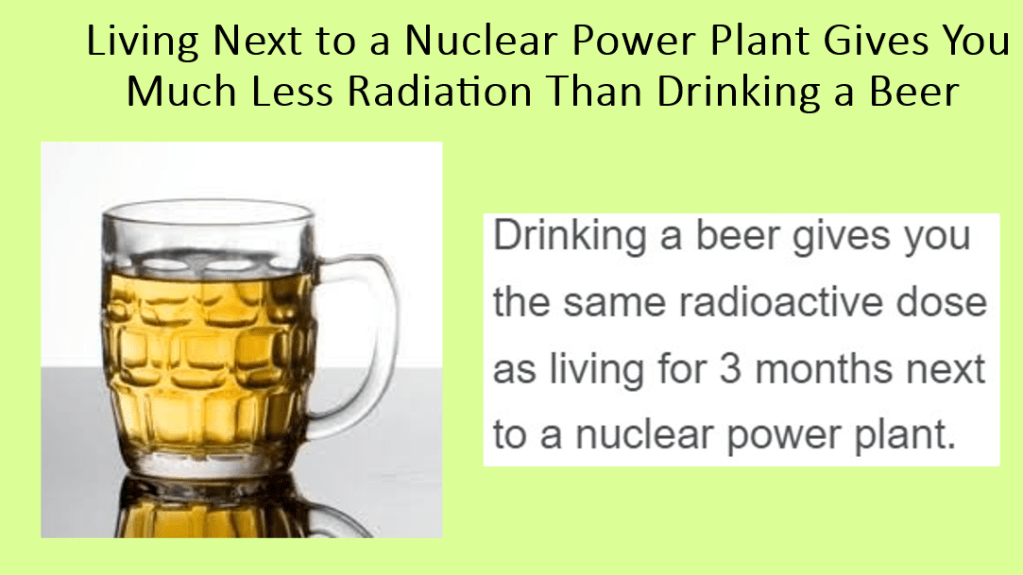
We seem to believe that it is necessary to pay big dollars from our taxes to overseas entities for the energy transition while harming our forests and best farming regions while killing off koalas in the process. Nuclear power takes up far less land and resources.
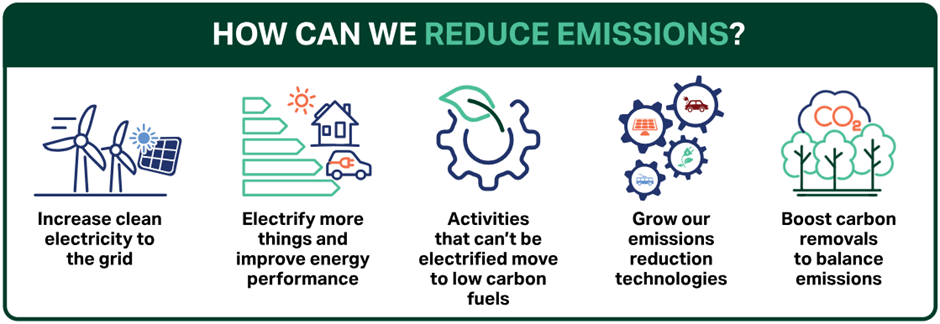
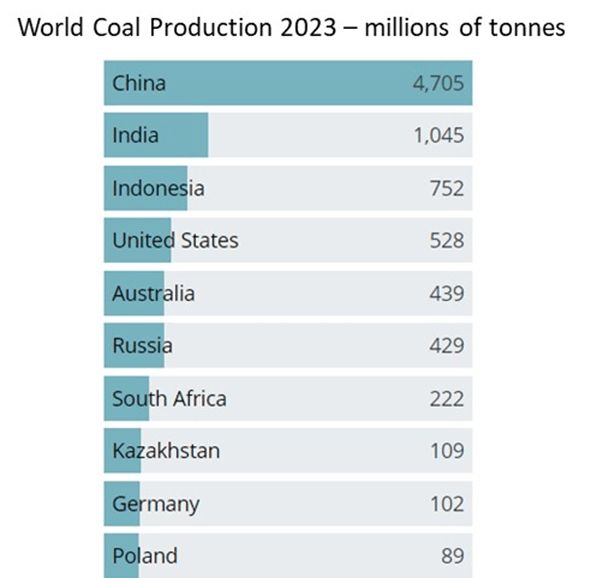
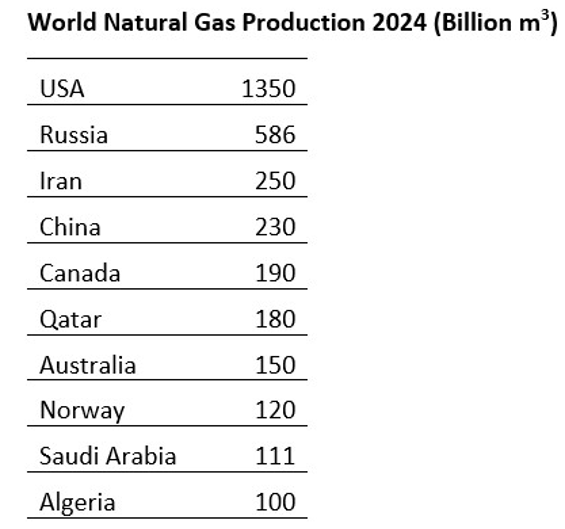
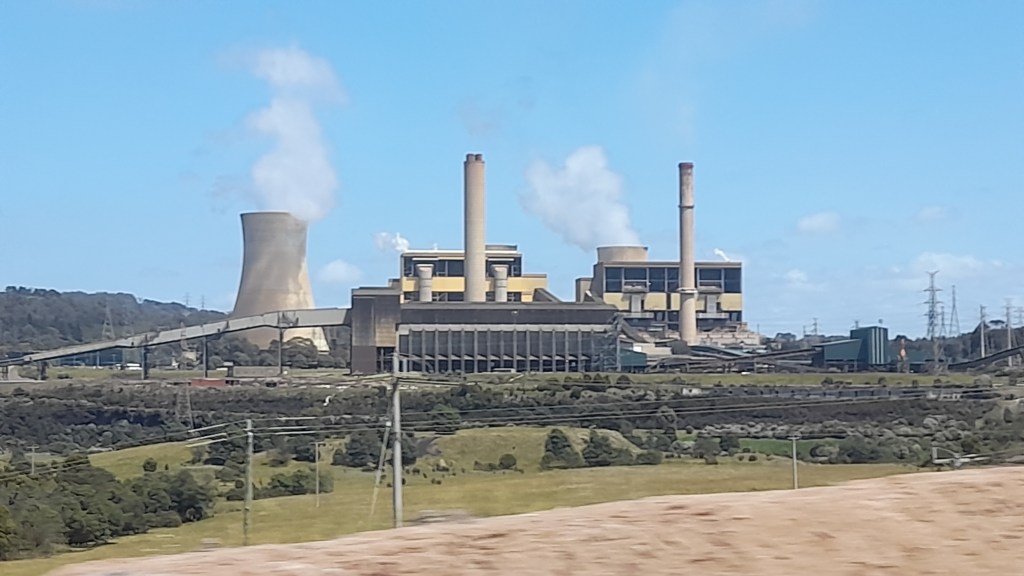
We Need to Use our Resources Wisely
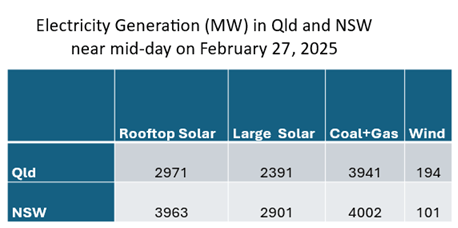
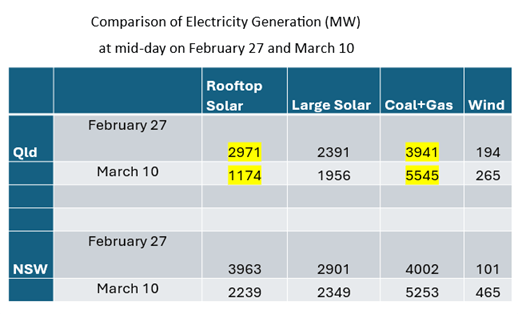
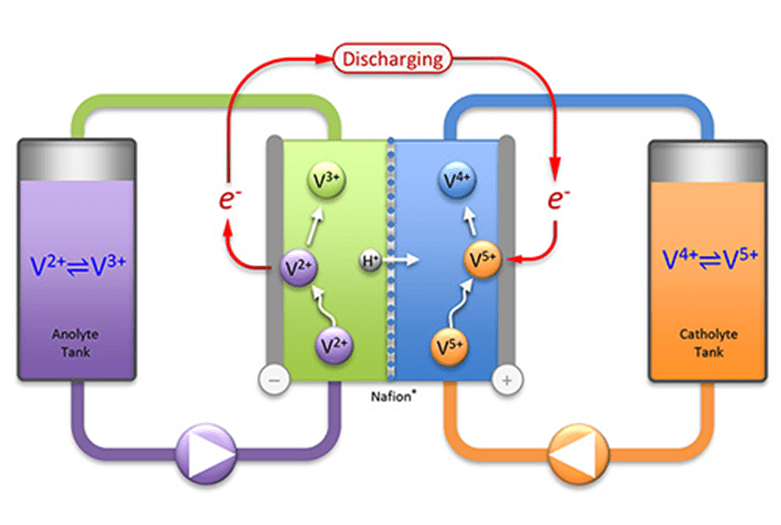
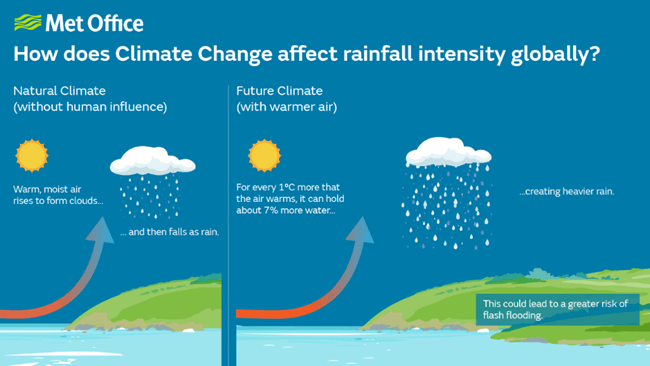
There is now a fight between “renewable” energy sources and fossil fuel use. Fossil fuels are only partly used to make electricity. They are valuable feedstocks needed to manufacture so many of the products we rely on from pharmaceuticals to surfboards. We shouldn’t be just burning fossil fuels and turning them into carbon dioxide. What a waste! We are wasting the limited resources of future generations.
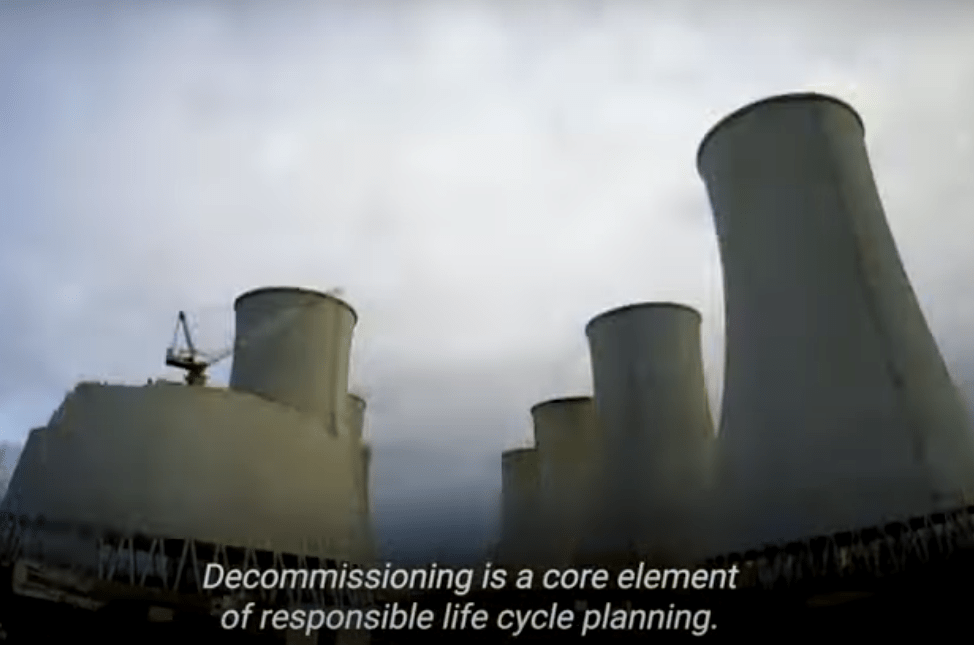
We need to plan our energy systems with a balance of resources for now, while transitioning as we can in a balanced way. We need to remember that much of the renewable energy assets we have now will need replacing before 2050. Nuclear needs to be part of the solution. We have used some form of wind or solar power for hundreds of years. It is likely that various forms of nuclear power will provide much of our energy in generations to come. Why are we letting Australia fall so badly behind?
Is Intergenerational Equity Being Lost?
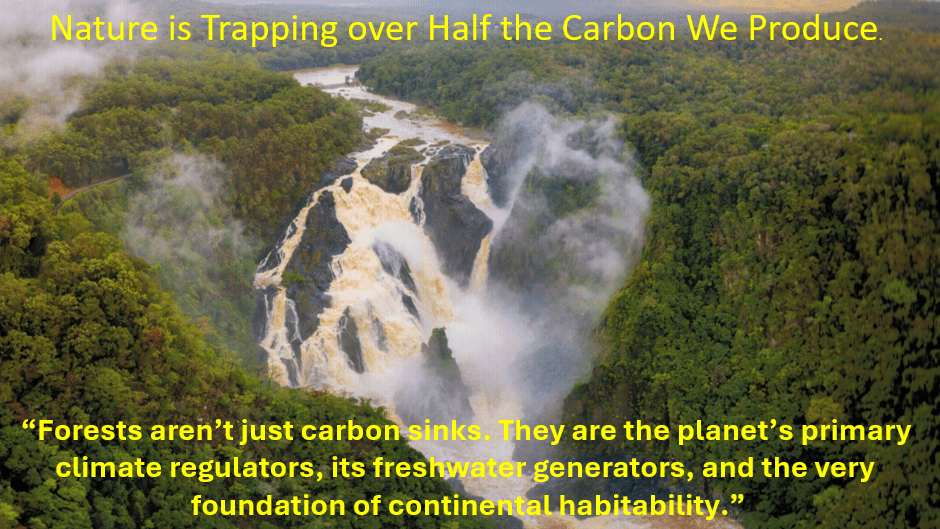
Nothing takes more weight off the next generation than being as self-sufficient as possible while husbanding our natural resources. I want my great grandchildren to enjoy and treasure the natural world that does so much for us.
When I retired decades ago, Australia did not have big government debt. We owned our own house at last; we kept working part-time in a small business and put money into super as we both had parents that lived long into their 90s. We volunteered in community organisations.
Are we greedy and denying the next generations a home of their own? We have helped our own children with school fees and with buying a home. They in their turn are helping their children. As self-funded retirees, we pay for most of any services we receive and now worry we may not be able to afford to go into an aged care home with the proposed new taxes. Our first house had 2 bedrooms, it needed a new roof, had no sewage connected and was made of asbestos. We could not afford a telephone for years, social life had to be “bring a plate”, no eating out or having a beer or coffee. We did not buy magazines or newspapers for years. (Thank goodness for libraries). Our home loan interest rate was 14%.
Actually, we had a lot of fun in those years and we still do.