In the process of researching information for this blog, I have learnt a lot that surprised me. My final conclusions are that we need to be concentrating on 2 things in Australia:
- Helping nature to do its work in every way we can.
- Using nuclear power for energy production.
Know the Enemy
It always helps to know the enemy as best we can when planning the strategy for any fight. It increases our chances of success and reduces costs to ourselves or things we value. When we plan strategies for dealing with “Climate Change”, we really need to understand the big picture or we risk wasting all our resources fiddling around the edges. Many countries around the world are spending or planning to spend trillions of dollars and so far there has been no global reduction of carbon dioxide emissions to our atmosphere. Meanwhile Nature is being trashed with the survival of more and more species being threatened every year that passes. The threat of food and water shortages is leading to a very unstable world politically as climate refugees try to survive.
Our ability to measure carbon budgets has improved with time. The recent uses of satellite data and AI systems are impressive.
This blog begins by presenting text and diagrams from the Earth Systems and Climate Change Hub https://nespclimate.com.au/wp-content/uploads/2021/06/ESCC_Global-and-regional-carbon-budgets_Brochure.pdf The ESCC Hub is funded by the Australian Government’s National Environmental Science Program. To learn a lot more about their activities, visit https://nespclimate.com.au/ The ESCC Hub feeds data into the international entity the Global Carbon Project. Their diagrams are simpler than those I gave in my last blog but the data is very similar even though the units used are different. I suggest that readers take the time to look closely at the diagrams in this blog.
Tracking emissions of carbon dioxide over time through carbon budgets allows us to quantify and explain how human activities and natural processes add to and subtract emissions from the atmosphere. This can help to identify where the biggest opportunities for mitigation exist, and how carbon-climate feedbacks might help or hinder efforts to achieve global targets for reducing greenhouse gas emissions.
Carbon budgets track sources and sinks of carbon dioxide and their transfer between the atmosphere, ocean and land.
The Global Carbon Dioxide Budget
I start with the Global budget so it can be compared with the unique features of Australia’s carbon budget.

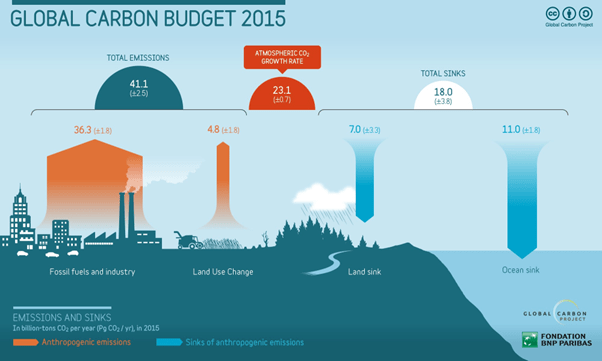
Source: Global Carbon Project – the numbers are in billions of tons of carbon dioxide per year averaged between 2010 and 2019.
The arrows show the major fluxes. So, fossil fuels and industry produce 34.4 billion tons per year (Pg CO2/yr) while land use change emits 5.7 for a total carbon dioxide source of 40.1 billion tons CO2/yr.
The land sink is 12.5 billion tons of CO2 per year and the ocean absorbs 9.2 making a total sink of 21.7 billion tons of carbon dioxide per year. Again, the data shows that natural systems were removing more than half of anthropogenic (man-made) carbon dioxide between 2010 and 2019 averaged over this period.
The land and ocean draw down atmospheric CO2 and act as sinks to slow the accumulation of human caused CO2 emissions, thereby slowing the progression of climate change. Combined, land and ocean sinks removed an annual average of 54 per cent of all CO2 from human activities – with land sinks removing about 31 per cent of all annual emissions and ocean sinks about 23 per cent. These natural sinks therefore play an important service in mitigating climate change.
Although CO2 has continued to accumulate in the atmosphere, the proportion of emissions removed by land and ocean sinks has remained constant over the past 60 years. This suggests that strong self-regulating feedbacks have led the sinks to increase their carbon sequestration capacity over time. However, there is large interannual variability of both the land and ocean sink strength in response to climate variability (e.g. El Niño) and extremes. This suggests likely sensitivity of the sinks to future changes in climate and variability.
Tracking land and ocean sinks and how they may change under a warming and variable climate is vital for understanding the climate change mitigation challenge faced by the international community.
https://nespclimate.com.au/wp-content/uploads/2021/06/ESCC_Global-and-regional-carbon-budgets_Brochure. The brochure is only 4 pages long and worth reading.
Some assessments focus on the carbon cycle as it relates to carbon dioxide just like the one given above. Methane and other greenhouse gases are assessed separately. The assessments discussed in this blog are undertaken in this way. The numbers given track carbon as calculated on the weight of carbon dioxide: CO2 units. The numbers are higher by 44/12 than when data is presented in C units. That means all the numbers will be 3.66 times higher than those given in my previous blog post where the data was in C units. As long as all the numbers are in either C units or CO2 units, they are directly comparable. But I have noted assessments that mix up these units and come to erroneous conclusions. All of this blog is in CO2 units.
The Effect of Land-Use ChangesDeforestation, the main driver of land-use emissions, has remained high in the last decade. Re/afforestation has counterbalanced approximately half of the deforestation emissions.

The ocean and land sinks have continued to grow with increasing atmospheric CO2 and take about half of the emissions. Climate change is already reducing these growths by about 4% (ocean sink) and 17% (land sink). Friedlingstein et al 2022; Global Carbon Project 2022. https://www.globalcarbonproject.org/carbonbudget/22/files/GCP_CarbonBudget_2022.pdf
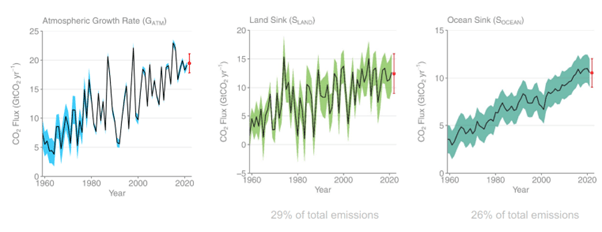
Land Sink removed 29% of total emissions while the Ocean Sink removed 26%.
Surprisingly, Nature still manages to remove almost 60% of our emissions BUT 2015 was a bad year globally as illustrated below due to land use change. We cannot keep destroying the land sink. It does far more for us than all the renewables have so far. A Gt is the same as a billion tons and the same as Pg.
The Australian Carbon Budget
Note that the data for Australia is in millions of tons of CO2 per year while the global data is in billions of tons of CO2 per year. Our net emission of CO2 to the atmosphere was 23 million tons per year between 2010 and 2019 on average while the global net emissions were 18.4 billion tons per year. This suggests that Australia only produced 0.12% of the net emissions and that we were nearly carbon neutral from 2010 to 2019.
If only it were that simple. What about our coal and gas exports? The reality that we are buying our wind turbines and solar systems and batteries and EV cars manufactured overseas some of which has been produced using energy from our coal. Simplistically, one could suggest that Australia’s transition to renewables is actually bad for climate change mitigation. Particularly so when we destroy natural system carbon sequestration when installing wind and solar.
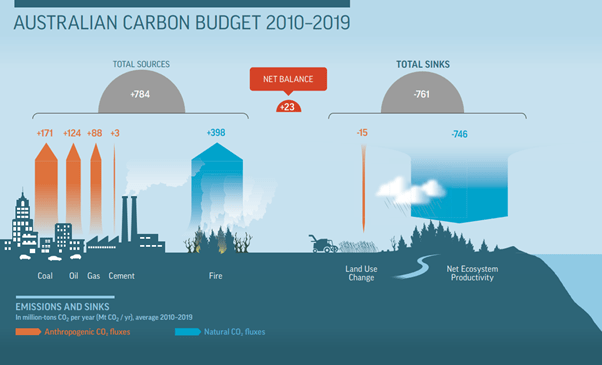
Ref: ESCC Hub brochure – units are in millions of tons of carbon dioxide per year.
In Australia, our natural landscape, our natural ecosystems, removed twice as much carbon dioxide as we produced by using fossil fuels (746 to 386 million tons per year) on average for 2010 to 2019. However, this record was spoilt by fire(398). Thus, on average we fed climate change with our carbon dioxide emissions of only 23 million tons per year.
Unfortunately, Australia is a land of heat, fire and drought. 2019 was a particularly bad year. Due to drought our ecosystems were a source of carbon dioxide and not a major sink. Higher bushfire levels added to our totals. One of our major sources of carbon dioxide is fire that burns our dry tropical savanna lands over large areas. These fires are usually allowed to burn out and are not fought. For years now programs to lessen the impact of the fires has been undertaken by our indigenous peoples in the Northern Territory using “cool burns”. In bad years the CO2 from fires can negate all the carbon sequestration land-based Nature does: https://bg.copernicus.org/articles/10/851/2013/
It is our savannah lands that usually do most of the sequestration work. However, In very wet years our arid lands also remove vast quantities of carbon from the atmosphere and tie it up in soil.
Every attempt must be made to keep our land-based ecosystems photosynthesising as much as possible which will maximise carbon sequestration. This means keeping soils damp and not allowing them to heat up any more than can be helped. It means ensuring that we don’t make Australia more arid than it is now. Experiences in many countries around the world show that it is possible to help Nature help us by making arid lands wetter again. This is an enormous topic in itself and will be covered in future blogs.
How We Are Failing to Reduce Regional Climate Effects
Several classic situations exist in my current home state of Queensland.
Stupidly, we built a major transmission line along the peaks of the Great Dividing Range. This meant that Renewable Energy Project proponents wanted (needed?) to place their wind turbines and solar installations near this transmission line. This leads to the disturbance then destruction of some of our best remaining forests much earlier than might happen with Climate Change. It has been known for a long time that even narrow roads pushed through forest can change the composition of vegetation up to 100 metres on either side – edge effects. The giant wind turbines require very wide steep roads winding through the mountains, blasting of the mountain tops, direct loss of thousands of ha of forest – step by step loss of our effective land sink.
We forget that in the area near wind turbines, soil and forest dries out making fire risk much higher.
The next examples of poor planning and policy relates to solar energy. In Queensland, the big solar farms need to be turned down when there is too much electricity produced during the day. Never mind negative prices for large scale solar, operators still get their carbon credits which still makes operating them a financially attractive investment.
When the sun goes down solar energy stops. So, at night most of our power comes from coal-fired power stations which still need to run all day as they cannot ramp up from zero.
Roof top solar does a great job but subsidies have not encouraged battery storage with roof top solar. The Australian Energy Market Operator (AEMO) has no means to control roof top solar.
We keep hearing how the “Energy Plan” will create jobs. Up here in the Far North, tourism is a very important part of our economy. Mangling our Natural Assets doesn’t help. Coal Fired Power Stations hire lots of skilled workers. When the power stations close their income plummets. https://theconversation.com/heres-what-happens-to-workers-when-coal-fired-power-plants-close-it-isnt-good-215434
The pseudo “Green” economy seems to replace some of these jobs with lower paid jobs – what someone described to me as “Toilet Jobs”. In contrast, replacing coal fired power stations with nuclear facilities would keep these skilled workers and provide even better paid positions.
Lastly, fire- fighting in most of Australia is dependent on Volunteer Rural Fire Brigades with little equipment. Should we be spending far more resources on fire mitigation? Logically, it takes a lot more effort to fight big fires than to deal with them adequately when they first start. Satellite systems and AI could be used to pinpoint fires early. Would we be better to spend all those billions of dollars on the very best fire-fighting personnel and equipment rather than imported renewables?
In conclusion, I believe we need to be concentrating on 2 things in Australia:
- Helping nature to do its work in every way we can.
- Using nuclear power for energy production.
Discover more from My Blog has become My Nuclear Journey
Subscribe to get the latest posts sent to your email.

Great informative information. Plus all the links to verify statements.
LikeLike
Thankyou for this great information. This is much appreciated
LikeLike