The “nameplate” capacity of a powerplant is the maximum design output that can be produced, assuming no constraints on inputs.
The capacity factor measures how often a power plant is running at maximum power. For example, a plant with a capacity factor of 100% means it is producing power all of the time.
In practice, the capacity factor is defined as the ratio of the actual electrical energy produced by a facility over a specific period (usually a year) to the maximum possible electrical energy that could have been produced if the generator operated at continuous full power.
In practice here are two contributions to capacity factor. Firstly, the “fuel” that drives the generator, and secondly the availability of the generator.
In the case of renewables, the fuel is limited by the amount of sunshine (solar), wind speed (wind turbines) and water (hydroelectricity). For fossil fuels it is the availability of gas or coal. Technically, and in the absence of plant breakdown, a gas or coal plant could operate 24/7 with a continuous supply of fuel. This is not the case for solar (day/night cycle), and generally not the case for wind. Once through hydropower can operate 24/7 if there is enough water available. However, in the case of pumped hydro the operating hours are limited by the availability of electric power from another source to recharge the system.
The availability of a generator depends on how much time is needed to maintain it via scheduled and unscheduled maintenance. Historically, Australia’s coal fired power plants were run continuously at high capacity to provide so-called baseload power. However, as more renewables have come into the system the operating output has had to be severely reduced during the middle of the day to accommodate especially the surge in input from rooftop and large scale solar. Thus, in recent years this has caused a drop in the average effective capacity factor of the coal fired generators. This is distinct from the intrinsic capacity of these stations, which is realised at night, where in excess of 80% of the electricity needed in Qld and NSW is still produced by these generators (see previous instalment).
Solar Power
As of 30 September 2024, there was over 3.92 million PV installations in Australia, with a combined nameplate capacity of over 37.8 gigawatts (https://pv-map.apvi.org.au/analyses ).
This power source can only operate when the sun is shining. So, the basic limitation is the day/night cycle, the length of which changes through the year. In southern latitudes both the day length and maximum solar intensity can be much less during the winter months than in summer. This annual difference is much less in the tropical latitudes. An additional issue is whether the solar panels can track the position of the sun during the day and throughout the year. Tracking arrays are often installed in large solar farms but this is not the case for the fixed orientation of rooftop solar. So, typically large scale solar has a higher capacity factor than rooftop solar.
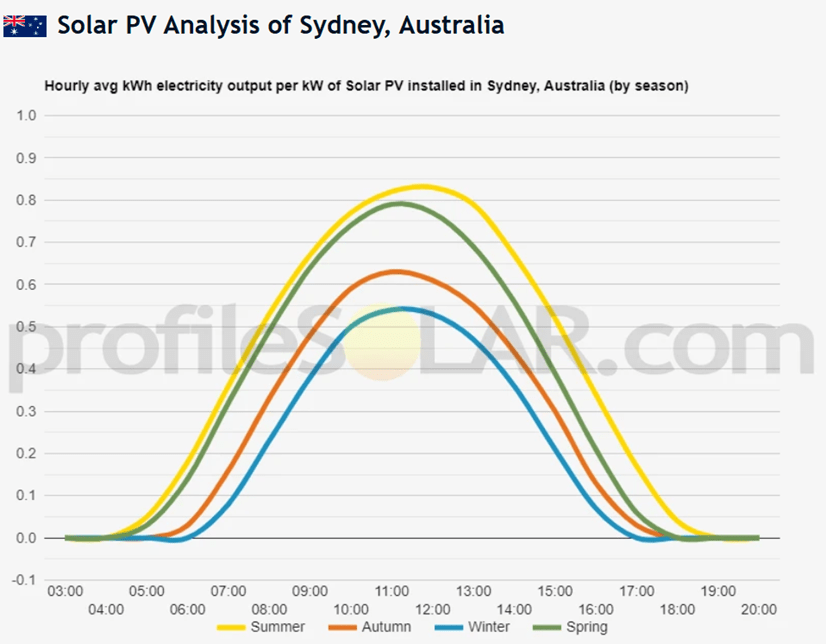
https://profilesolar.com/locations/Australia/Sydney/
See https://wattclarity.com.au/articles/2023/03/why-capacity-factor-is-an-increasingly-simplistic-way-to-compare-solar-farm-performance/ for a more detailed discussion about the impacts of these factors on solar output.
In Qld the capacity factor of large solar approaches 30%, whereas in Vic and SA it drops to 20%, for an overall Australian average of about 22%. In contrast, the average capacity factor for rooftop solar is only around 12 per cent, much lower than for large utility-scale solar. Ironically the much higher yielding large solar is increasingly being curtailed by AEMO (because it can control these inputs) precisely because of the increasing amounts of currently uncontrolled roof top solar that is flooding the grid.
In a recent report by the Clean Energy Council (Rooftop solar and storage report January—June 2024) the first dot point in the Executive Summary stated that:
“Rooftop solar photovoltaic (PV) installations are on track to pass a total of 25 GW installed capacity in Australia by the end of 2024. By comparison, black and brown coal combined for a total of 21.3.GW of installed capacity in the financial year 2023-24.“
This sounds like a lot doesn’t it? However, from the discussion above, directly comparing installed (nameplate) capacity of rooftop solar with coal generators is totally inappropriate, owing to the vastly different capacity factors of these two sources of electricity. Fortunately, the 4th dot point in the Clean Energy Council report Executive Summary clarifies this by stating that rooftop solar installations produced about 11% of dispatchable power in the first half of 2024. This is a substantial amount, but only a fraction of what the first statement above from the Clean Energy Council could be taken to imply. Indeed 11% is about 13,500 GWh which converts to 3.1GW input, and 3.1GW is 12.4% of 25GW. This is exactly the capacity factor for rooftop solar that is quoted above!
Wind Power
Wind turbines typically require wind speeds greater than 6km/h to operate, with generation peaking at around 15km/h, noting that there is a mechanical limit on how fast the blades can rotate. The figure below shows the wind speed dependence for a 3.5MW turbine.

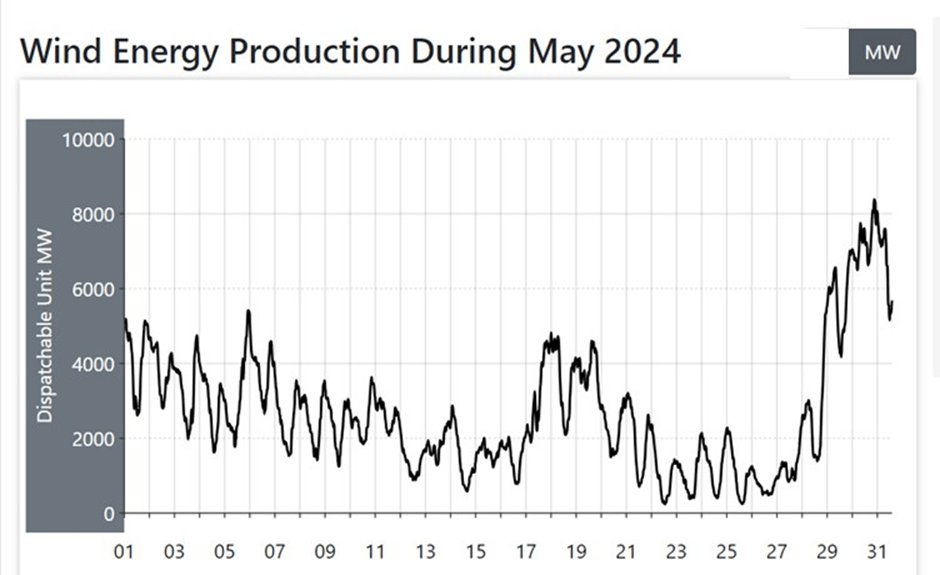
The average capacity factor for an on-shore wind farm in Australia is around 35%, and ranges from 25% (even less at some locations) to 45% (source: Wind Energy Fact Sheet, NSW Dept of Environment and Heritage, https://www.environment.nsw.gov.au/resources/communities/100923-wind-facts.pdf ). Wind, unlike solar, is not constrained by the day/night cycle and thus can potentially operate throughout the day. However, wind generation is highly variable. The plots below show the dispatchable power (MW) and capacity factors (%) for the eastern grid system for the month of September 2024 ( https://anero.id/energy/wind-energy). For reference the total current installed wind capacity is about 11,000MW. Offshore wind potentially has a higher capacity factor (up to 50%) than onshore wind, but the Australian offshore wind industry is still in its infancy.


September was a good month. However, earlier in the year there was a prolonged wind “drought” through April and May, with the dispatchable power and capacity factors for May shown below ( https://anero.id/energy/wind-energy).

Hydroelectricity (Hydro)
Hydro is regarded as a renewable source of electricity since its source of “fuel” is water that is provided by rainfall. There are two types of hydro. (1) Once-through hydro which requires a continuous supply of water, and (2) pumped hydro which recycles its water via energy supplied from other primary sources. In total, the two forms of hydro currently account for about 6% of total annual electricity production (Source: Table 13 in the Australian Energy Update 2024 produced by the Australian Government (https://www.energy.gov.au/sites/default/files/2024-08/australian_energy_update_2024.pdf). Apart from in Tasmania, where it provides the bulk of electricity at all times, hydro is mainly used on the mainland in the evening peak periods.
Hence the “capacity factor” for hydro is currently highly variable. However, this may change in the future when there is planned to be a substantial expansion of pumped hydro to provide large-scale long-term storage for wind and solar generators.
Coal
Over past decades coal power stations operated at around 85% of full capacity since historically they were run 24/7 at near full output to provide the majority of supply to the grid. This is where the term baseload power originates from. However, the capacity factor has declined substantially from 88% in 2008 to 67% in 2020 and subsequently to 60% in 2023-24.
Much of the recent decline in capacity factor has been the result of daytime curtailment of generation by the preferred feed in status given to rooftop and large scale solar. In fact, it is not uncommon in Qld, NSW and Vic for the production from coal-fired power stations to be almost 50% or ½ during the middle of the day compared to night-time. The need to ramp up and down over such a large range also causes significant thermo-mechanical stresses which increase the need for maintenance and increases the possibility of unplanned shutdowns. Further complicating this situation is that as more generators are shut down there is less and less redundancy in the system to buffer unplanned outages, especially during the night time period.
It is this “perfect storm” of risk factors that is the source of the perception that coal-fired power stations are the source of the reliability problems in the grid. In fact, the reverse is the case where in the current absence of sufficient storage for renewable generation they are providing much of the critical day-night buffer without which the grid would collapse at night.
Gas
In contrast to coal gas power station capacity factors vary from as high as 85% to less than 10% (if designed only to supply electricity at peak periods). Gas currently accounts for about 18% of annual electricity generation, with its main use in the Eastern states being during the nighttime peak period.
The Table below summarises the average capacity factors for the current major suppliers of electricity to the grid, coal, rooftop and large solar, and wind. I have not included hydro or gas in this Table because they are typically used for peak demand management and hence are not directly comparable with these other sources.
Summary
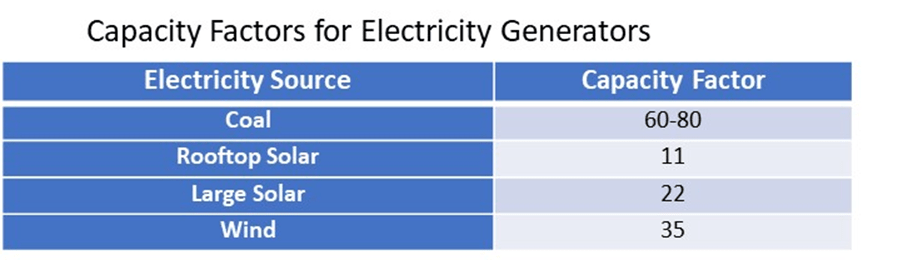
What immediately stands out here is that the capacity factor for coal is many times higher than for solar and wind. This means is that for a given 100MW nameplate capacity you will on average get 60-80MW from coal, 11MW from rooftop solar, 22 MW from large solar and 35MW from wind. So, when a new renewables development is announced and the claim is made that it will produce x megawatts that will supply a certain number of homes, it may not be clear what this actually means. If such a claim is based on nameplate capacity, then it is at best very misleading!
In my next instalment I will be talking about storage, and how critical it will be to have sufficient storage in place for the renewable energy transition.
Discover more from My Blog has become My Nuclear Journey
Subscribe to get the latest posts sent to your email.
