This is the fourth in a basic series about electricity written by Dr David Jones.
The 80% renewable electricity target by 2030 cannot be achieved unless there is sufficient storage in place for the output of variable renewables.
When you think about it, storage has always been a primary issue for electricity generation. In the case of coal there has always needed to be sufficient coal in bunker storage at a power station to feed the furnaces. Coal is a concentrated form of “solar energy” that was captured by plant photosynthesis many millions of years ago – so it is a form of energy storage. Likewise with gas.
As Australia transitions towards a planned renewables-based electricity generating system it will be critical to have sufficient storage to maintain power supply during periods when intermittent primary generation sources are not producing power. Shutting down existing dispatchable, fossil-fuelled generation before the required storage is in place will likely lead to frequent, unpredictable, widespread blackouts.
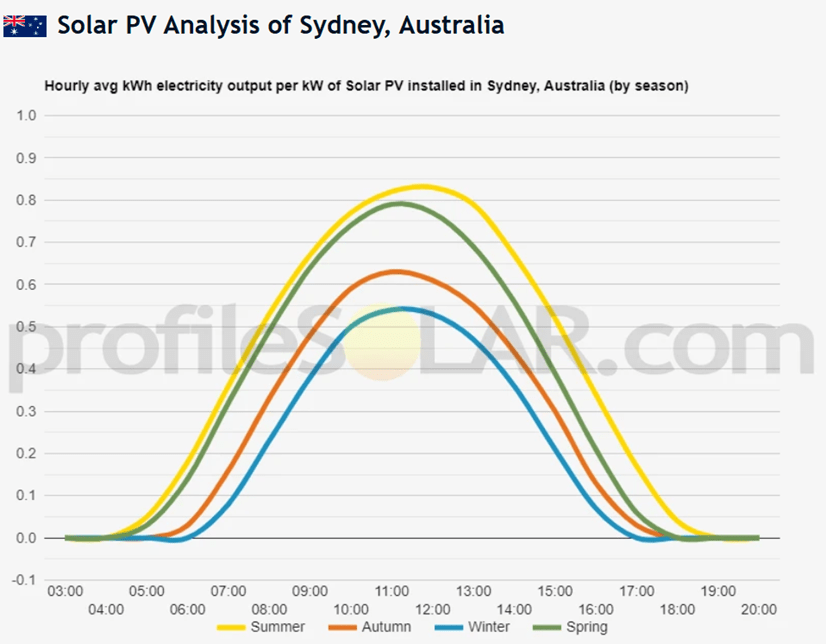
As discussed in a previous instalment, solar PV (especially rooftop solar) has a low capacity factor since electricity is only produced when the sun is shining. Let’s assume for simplicity that large scale solar PV with a capacity factor of 30% is the only source of generation. Electricity is produced during an 8h daytime window. What about the rest of the 24h period?
To ensure that sufficient electricity is produced for a 24h period, “surplus” electricity needs to be produced and stored during the day, for use during the dawn and dusk periods and through the night. This means that more than 3 times, over and above the daytime requirement, needs to be produced and stored. Thus, a 300MW nameplate capacity solar farm would be needed to produce 100MW, averaged over the 24h period, with sufficient storage.
The situation is more complicated with wind because of its intermittent nature, noting that the average capacity factor of an onshore windfarm in Australia is about 35%. However, in contrast to the regular and predictable day/night cycle for solar, wind is typically quite variable. So even with overbuilding x3 to allow for the capacity factor, if there is no wind (be it day or night) there will be no power produced.
So, we are going to need storage and LOTS of it, if our current electricity system is going to function with 80% renewables by 2030. What are we looking at for 2030 and how much more is going to be needed between now and then, and beyond?
Australia’s total current storage capacity is only 3GW. Current forecasts by the Australian Energy Market Operator (AEMO) show Australia will need at least 22GW by 2030 – a more than 7 fold (700%) increase in capacity in the next six years.
In my next instalment I will be taking a closer look at the main options that are being proposed for large scale storage – pumped hydro and batteries – and the challenges associated with them.
The “nameplate” capacity of a powerplant is the maximum design output that can be produced, assuming no constraints on inputs.
The capacity factor measures how often a power plant is running at maximum power. For example, a plant with a capacity factor of 100% means it is producing power all of the time.
In practice, the capacity factor is defined as the ratio of the actual electrical energy produced by a facility over a specific period (usually a year) to the maximum possible electrical energy that could have been produced if the generator operated at continuous full power.
In practice here are two contributions to capacity factor. Firstly, the “fuel” that drives the generator, and secondly the availability of the generator.
In the case of renewables, the fuel is limited by the amount of sunshine (solar), wind speed (wind turbines) and water (hydroelectricity). For fossil fuels it is the availability of gas or coal. Technically, and in the absence of plant breakdown, a gas or coal plant could operate 24/7 with a continuous supply of fuel. This is not the case for solar (day/night cycle), and generally not the case for wind. Once through hydropower can operate 24/7 if there is enough water available. However, in the case of pumped hydro the operating hours are limited by the availability of electric power from another source to recharge the system.
The availability of a generator depends on how much time is needed to maintain it via scheduled and unscheduled maintenance. Historically, Australia’s coal fired power plants were run continuously at high capacity to provide so-called baseload power. However, as more renewables have come into the system the operating output has had to be severely reduced during the middle of the day to accommodate especially the surge in input from rooftop and large scale solar. Thus, in recent years this has caused a drop in the average effective capacity factor of the coal fired generators. This is distinct from the intrinsic capacity of these stations, which is realised at night, where in excess of 80% of the electricity needed in Qld and NSW is still produced by these generators (see previous instalment).
Solar Power
As of 30 September 2024, there was over 3.92 million PV installations in Australia, with a combined nameplate capacity of over 37.8 gigawatts (https://pv-map.apvi.org.au/analyses ).
This power source can only operate when the sun is shining. So, the basic limitation is the day/night cycle, the length of which changes through the year. In southern latitudes both the day length and maximum solar intensity can be much less during the winter months than in summer. This annual difference is much less in the tropical latitudes. An additional issue is whether the solar panels can track the position of the sun during the day and throughout the year. Tracking arrays are often installed in large solar farms but this is not the case for the fixed orientation of rooftop solar. So, typically large scale solar has a higher capacity factor than rooftop solar.
In Qld the capacity factor of large solar approaches 30%, whereas in Vic and SA it drops to 20%, for an overall Australian average of about 22%. In contrast, the average capacity factor for rooftop solar is only around 12 per cent, much lower than for large utility-scale solar. Ironically the much higher yielding large solar is increasingly being curtailed by AEMO (because it can control these inputs) precisely because of the increasing amounts of currently uncontrolled roof top solar that is flooding the grid.
In a recent report by the Clean Energy Council (Rooftop solar and storage report January—June 2024) the first dot point in the Executive Summary stated that:
“Rooftop solar photovoltaic (PV) installations are on track to pass a total of 25 GW installed capacity in Australia by the end of 2024. By comparison, black and brown coal combined for a total of 21.3.GW of installed capacity in the financial year 2023-24.“
This sounds like a lot doesn’t it? However, from the discussion above, directly comparing installed (nameplate) capacity of rooftop solar with coal generators is totally inappropriate, owing to the vastly different capacity factors of these two sources of electricity. Fortunately, the 4th dot point in the Clean Energy Council report Executive Summary clarifies this by stating that rooftop solar installations produced about 11% of dispatchable power in the first half of 2024. This is a substantial amount, but only a fraction of what the first statement above from the Clean Energy Council could be taken to imply. Indeed 11% is about 13,500 GWh which converts to 3.1GW input, and 3.1GW is 12.4% of 25GW. This is exactly the capacity factor for rooftop solar that is quoted above!
Wind Power
Wind turbines typically require wind speeds greater than 6km/h to operate, with generation peaking at around 15km/h, noting that there is a mechanical limit on how fast the blades can rotate. The figure below shows the wind speed dependence for a 3.5MW turbine.
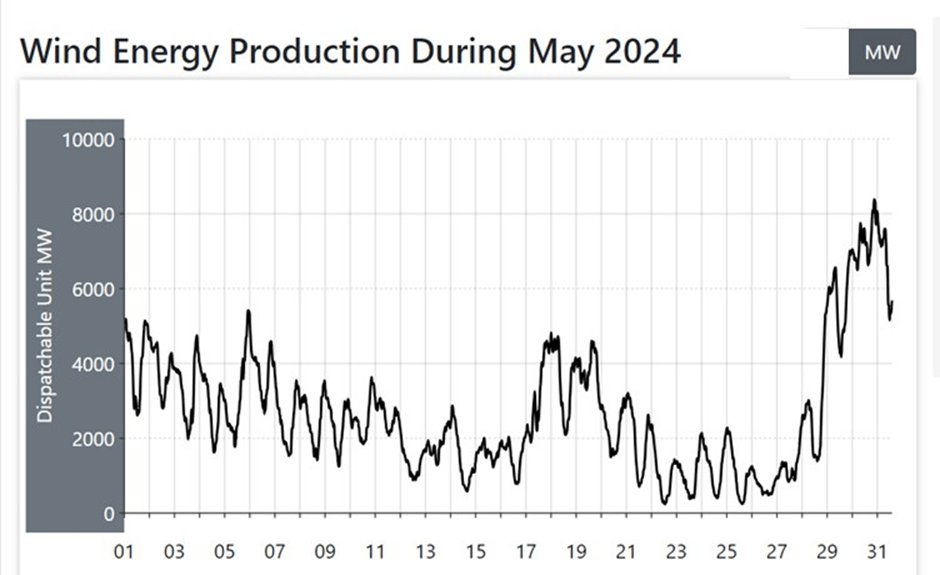
The average capacity factor for an on-shore wind farm in Australia is around 35%, and ranges from 25% (even less at some locations) to 45% (source: Wind Energy Fact Sheet, NSW Dept of Environment and Heritage, https://www.environment.nsw.gov.au/resources/communities/100923-wind-facts.pdf ). Wind, unlike solar, is not constrained by the day/night cycle and thus can potentially operate throughout the day. However, wind generation is highly variable. The plots below show the dispatchable power (MW) and capacity factors (%) for the eastern grid system for the month of September 2024 ( https://anero.id/energy/wind-energy). For reference the total current installed wind capacity is about 11,000MW. Offshore wind potentially has a higher capacity factor (up to 50%) than onshore wind, but the Australian offshore wind industry is still in its infancy.
September was a good month. However, earlier in the year there was a prolonged wind “drought” through April and May, with the dispatchable power and capacity factors for May shown below ( https://anero.id/energy/wind-energy).
Hydroelectricity (Hydro)
Hydro is regarded as a renewable source of electricity since its source of “fuel” is water that is provided by rainfall. There are two types of hydro. (1) Once-through hydro which requires a continuous supply of water, and (2) pumped hydro which recycles its water via energy supplied from other primary sources. In total, the two forms of hydro currently account for about 6% of total annual electricity production (Source: Table 13 in the Australian Energy Update 2024 produced by the Australian Government (https://www.energy.gov.au/sites/default/files/2024-08/australian_energy_update_2024.pdf). Apart from in Tasmania, where it provides the bulk of electricity at all times, hydro is mainly used on the mainland in the evening peak periods.
Hence the “capacity factor” for hydro is currently highly variable. However, this may change in the future when there is planned to be a substantial expansion of pumped hydro to provide large-scale long-term storage for wind and solar generators.
Coal
Over past decades coal power stations operated at around 85% of full capacity since historically they were run 24/7 at near full output to provide the majority of supply to the grid. This is where the term baseload power originates from. However, the capacity factor has declined substantially from 88% in 2008 to 67% in 2020 and subsequently to 60% in 2023-24.
Much of the recent decline in capacity factor has been the result of daytime curtailment of generation by the preferred feed in status given to rooftop and large scale solar. In fact, it is not uncommon in Qld, NSW and Vic for the production from coal-fired power stations to be almost 50% or ½ during the middle of the day compared to night-time. The need to ramp up and down over such a large range also causes significant thermo-mechanical stresses which increase the need for maintenance and increases the possibility of unplanned shutdowns. Further complicating this situation is that as more generators are shut down there is less and less redundancy in the system to buffer unplanned outages, especially during the night time period.
It is this “perfect storm” of risk factors that is the source of the perception that coal-fired power stations are the source of the reliability problems in the grid. In fact, the reverse is the case where in the current absence of sufficient storage for renewable generation they are providing much of the critical day-night buffer without which the grid would collapse at night.
Gas
In contrast to coal gas power station capacity factors vary from as high as 85% to less than 10% (if designed only to supply electricity at peak periods). Gas currently accounts for about 18% of annual electricity generation, with its main use in the Eastern states being during the nighttime peak period.
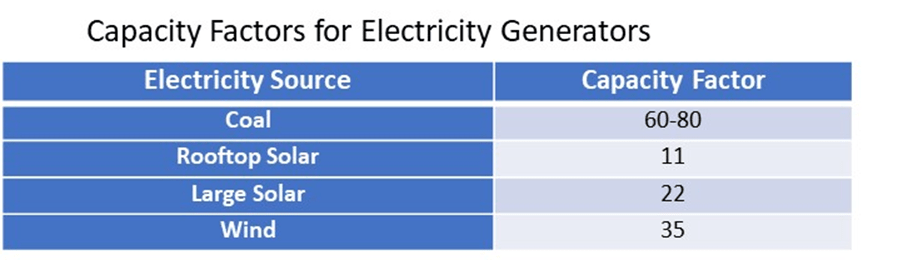
The Table below summarises the average capacity factors for the current major suppliers of electricity to the grid, coal, rooftop and large solar, and wind. I have not included hydro or gas in this Table because they are typically used for peak demand management and hence are not directly comparable with these other sources.
Summary
What immediately stands out here is that the capacity factor for coal is many times higher than for solar and wind. This means is that for a given 100MW nameplate capacity you will on average get 60-80MW from coal, 11MW from rooftop solar, 22 MW from large solar and 35MW from wind. So, when a new renewables development is announced and the claim is made that it will produce x megawatts that will supply a certain number of homes, it may not be clear what this actually means. If such a claim is based on nameplate capacity, then it is at best very misleading!
In my next instalment I will be talking about storage, and how critical it will be to have sufficient storage in place for the renewable energy transition.
In 2022-23 two-thirds (66%) of electricity came from fossil fuels (black coal, brown coal and gas). Fossils fuels are still by far the dominant source of electricity on an annualised basis. However, the huge increase over the past few years in solar PV has meant that there has been a fundamental change in the primary sources of electricity between the day and the night. This difference between the day and the night has critical implications for ongoing management of the electricity supply grid and will be the focus of much of this instalment.
The Nem-Watch site reports the distribution of electricity sources for Australia’s Southern and Eastern Power Grid (Qld, NSW, Vic, Sa, Tas) and for WA. These data are updated every 5-30 mins over a 24h period.
Middle of the Day
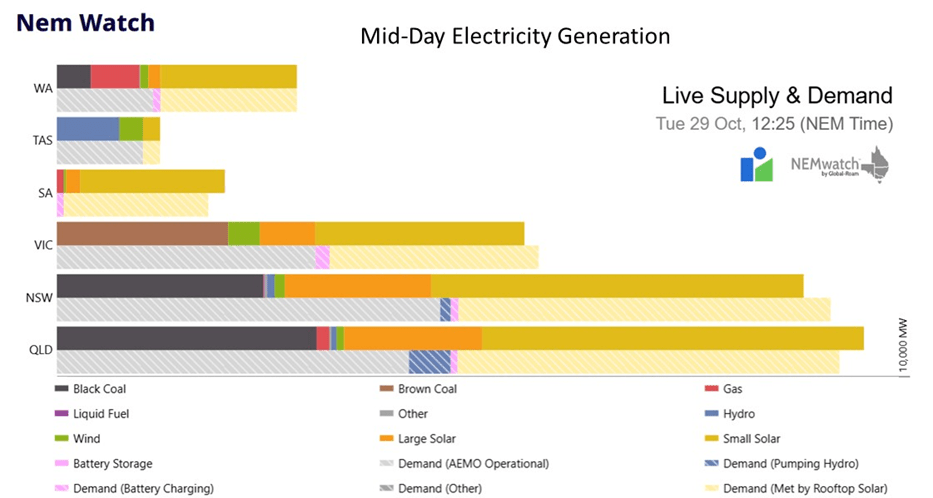
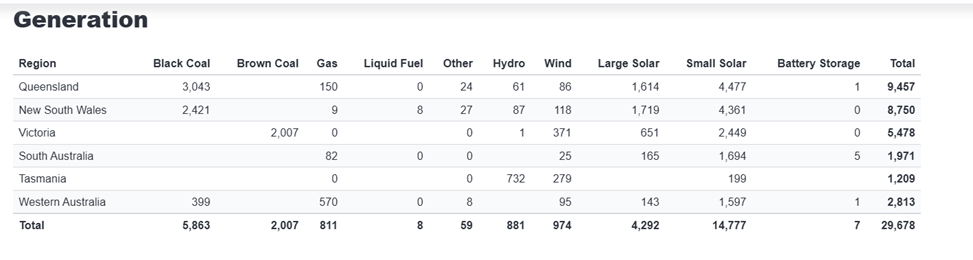
A “typical” current (October 2024) around mid-day distribution of electricity supply is shown below in graphical and tabular format (source: NEM-Watch).
What is immediately apparent is the very large contribution from rooftop (small solar) and large scale solar (the large orange bars on right of the plots above for each state) to the totals in all states apart from Tasmania. This mid-day (ie solar maximum) contribution is very consistent from day-to-day in the absence of cloud cover. Moreover, at this specific time the input from rooftop solar was much greater than for large solar, perhaps indicating that large solar was being curtailed.
Wind Power
In contrast to the regularity of solar, the contribution from wind tends to be highly variable from day-to-day (see below October 2024 output plot for wind: source – https://anero.id/energy/wind-energy) noting that there is currently about 11000 MW of nameplate wind capacity feeding into the southern and eastern power grid. A good performing wind farm in Australia is regarded as one that has a capacity factor of 37%. That is, on average the dispatchable electricity is a bit more than 1/3 of the nameplate.
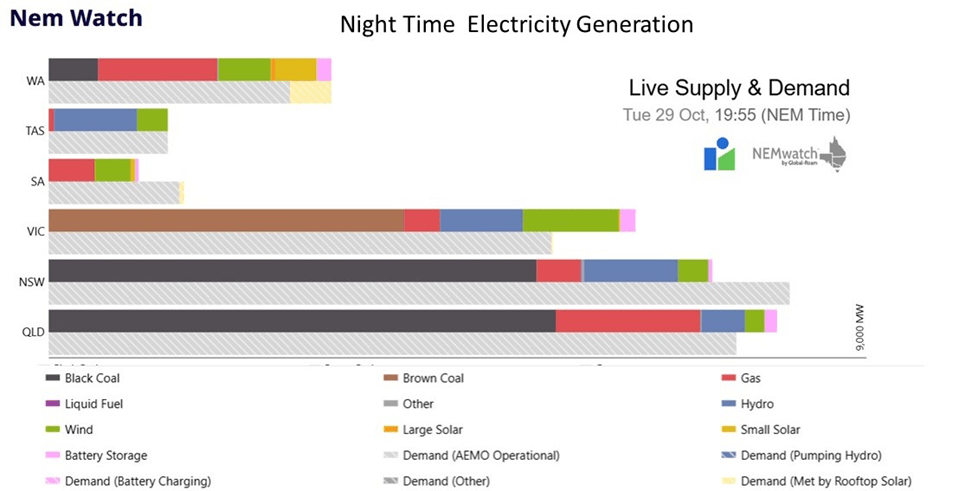
Night Time
By the time that night has fallen (figure below) there is a complete reversal of the major sources of electricity with coal and gas becoming major sources in all states apart from Tas, and by far the dominant sources in Qld, NSW, Vic and WA. The coal is shown by the black and brown bars and gas by the red bars.
What About South Australia?
South Australia is often regarded as being the “poster child” for the uptake of renewable energy by a mainland state. Yes, it is true that for limited periods the state has been running on 100% renewables. However, the reality is that without the backup provided by gas generators and by inputs of top-up power via the grid connections with other states, SA would be without sufficient electricity for extended periods of time.
Summary
The specific examples I have given above have been selected to illustrate the extremes that do occur between day and night. There are periods when both wind and hydroelectricity make larger contributions in the evening and night, reducing the demand on coal and gas. Hydro is a particularly consistent performer in Qld, NSW and Vic. In contrast WA has no hydro, and generation in Tasmania is dominated by hydro essentially all the time.
So, in summary during the peak sunlight hours rooftop solar currently makes the major contribution to total generation, ranging from 57% in NSW to 94% in SA. Indeed, there is now so much rooftop solar that it is starting to threaten grid stability. Hence, the recently announced move by AEMO (the Australian Electricity Market Operator) to start to limit the export of rooftop solar into the grid.
When the sun goes down coal and gas dominate the grid, ranging from 51% in SA to over 80 % in Qld and NSW. For this dependence (for 16h of the day!) on fossils fuels to be reduced, not only will there need to be much more renewable capacity installed but there will have to be in tandem a massive increase in the amount of storage (batteries and pumped hydro) from its current low levels.
In my next instalment I will be discussing capacity factors and what these mean for the amount of electricity that can be provided by renewables.
There is currently much confusion in understanding how big the task will be, and how long it will take, to decarbonise Australia’s energy supply. In particular, electricity generation is being used interchangeably with energy demand in communications from the Government and much of the general media. This confused situation is not helping us understand the current heated debate about the path forward for the energy transition.
The chart below shows how Australia’s energy mix has changed from the 1980s to the present. The energy units are Petajoules (PJ). One PJ is the heat energy content of about 43,000 tonnes of black coal or 29 million litres of petrol.
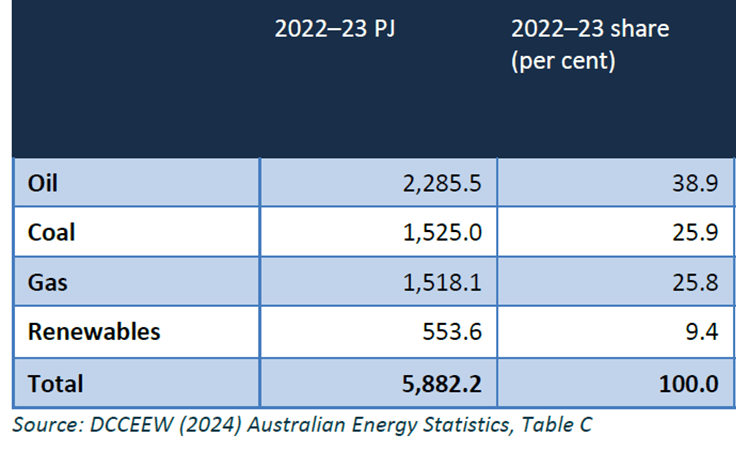
Source: DCCEEW (2024) Australian Energy Statistics, Table C
Latest Data on Australian Energy Consumption by Fuel Type
Oil, including crude oil, liquefied petroleum gas (LPG) and refined products, make up the largest share of energy consumption (39 per cent), with coal and natural gas both at 26 per cent.
Although renewable electricity generation has more than doubled over the last decade, it still only accounts for 9% of Australia’s total energy consumption. It will be a surprise to many to learn that combustion of biomass such as firewood and bagasse (the remnant sugar cane pulp left after crushing in Qld & northern NSW) makes up about a third of all renewable energy generation in Australia. But wait a minute, aren’t we being told that renewables make up 37% (solar-16%, wind – 12% and hydro-6%) of the total amount of electricity currently being generated in Australia?
So where does this 37% number come from, when renewables only make up only 9% of the total energy mix?
Well, the fact is that electricity generation currently only makes up about one-quarter or 25% of the total current energy demand. 25% of 37% is 9.2%.
So, both numbers (9% and 37%) are technically correct, it just depends on what they are referring to.
On the one hand, this means that we are now almost half way to the Australian Government’s current target of 82% renewable electricity by 2030. However, even if we do make that target it means that we are still less than one quarter of the way to decarbonising Australia’s energy supply by 2050. That leaves a huge gap between 2030 and 2050.
If that gap is to be made up of wind, solar and hydro alone then it would mean having to install and connect nearly 10 times more generating capacity (with associated storage) than we have in 2025. This will be a truly mammoth undertaking, noting that between now and 2050 the earlier solar and wind installations (and associated battery storage) will need to be replaced up to two times.
My next instalment is Australia’s Energy Resources – Where our “Power” Comes from.