What Cyclone Alfred taught us about Rooftop Solar Power Generation – by Dr David Jones

Cyclone Alfred was a 1 in 50y event that brought low grade cyclonic winds to southeast Queensland and northern NSW over a period of a week between March 4-11. However, it was the rain and associated flooding after the cyclone crossed the coast that caused the most widespread damage. The multi-day duration of cloud cover that the system brought is the basis of this blog.

Rooftop solar refers to solar panel on roofs, and this is dominated by residential (domestic) installations.

Currently more than 1-in-3 Queensland homes have rooftop solar, the highest rate of any Australian state or territory, with 6 GW having been installed by early 2024. Three quarters of the population of Queensland lives in the southeast corner of the state. Thus, three quarters of the dwellings with rooftop solar are located in this geographic region and account for the great majority of rooftop solar being fed into the grid during the day.

The table below shows the contributions of small (rooftop) and large scale (solar farms) inputs in MW to the Queensland grid in the middle of a typical bright sunny day. The electricity coming from coal and gas, and from wind are included for reference.

These figures were taken from the NemWatch site on February 27 when the cyclone and associated cloud was well off the coast (satellite image below) and the east coast was largely cloud free. I have also included the comparable figures from NSW for reasons that will soon become apparent.

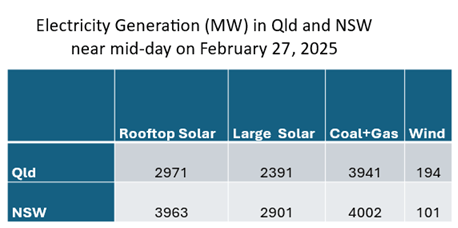
For both states, solar was making by far the largest contribution to electricity generation.

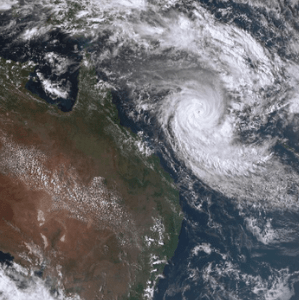
Satellite Image (source: BOM) on February 27 showing cyclone Alfred and associated cloud well off the east coast.

The table below compares the data from February 27 with that at a similar time during the day on March 10 when there was extensive cloud cover over southeastern Qld and northern to central coastal NSW (see satellite image below).

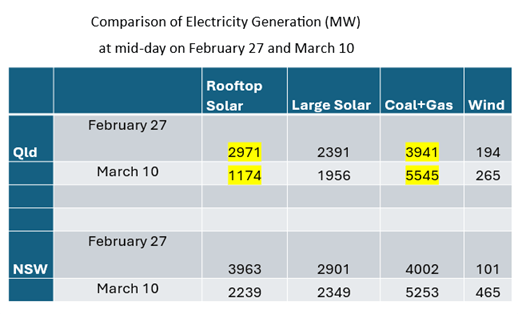
What is immediately apparent from this table is the huge 60% drop (1800MW) in rooftop solar output seen on March 10. There is also an almost 20% drop in the output of large solar, but this is small in comparison. The 2200 MW loss from solar had to be made up by coal and gas generators.

The question is why rooftop solar was impacted so much whereas large solar only suffered a modest decline. The reason is location! The locations of large-scale solar plants down the east coast of Australia are mapped below. What is immediately apparent is that in Queensland most of these are located further inland and north of the cloud covered area.

In New South Wales there was 45% drop in rooftop solar, and a similar 20% drop in large solar. Once again for similar reasons to Queensland where the cloud cover extended down the coast to the Sydney area which hosts the majority of rooftop solar in New South Wales. However, the drop wasn’t as big in Sydney because there was less cloud cover.

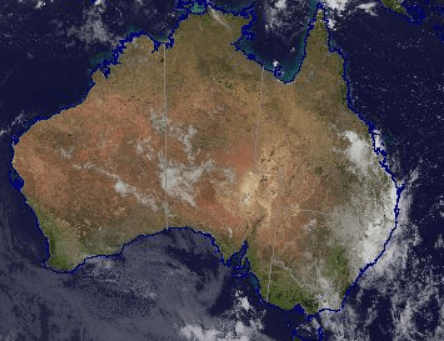
Satellite Image (source: BOM) on March 10 showing extent of cloud cover in southeastern Queensland and northern New South Wales.

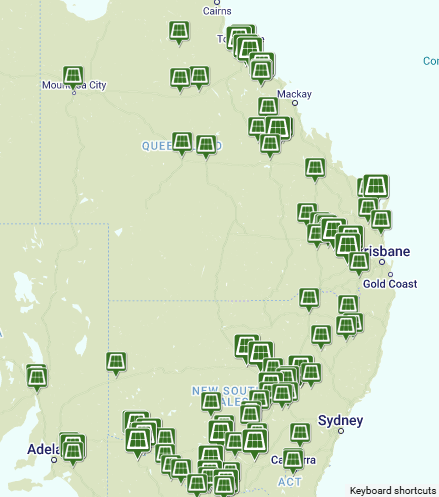
Locations of large solar farms in Qld and NSW https://reneweconomy.com.au/large-scale-solar-farm-map-of-australia/

This rooftop solar drought lasted for several days after Alfred, with coal and gas power continuing to make up the shortfall. Given that there is very little storage for the renewables component of the grid, this highlights the vulnerability of having the bulk of the rooftop solar generating capacity in the one geographic area. Even for those fortunate enough to have battery storage for their rooftop solar, this backup would not have been sufficient to last for the days of cloud cover.

This situation occurred again in March when a broad band of cloud blanketed much of southeastern Queensland for much of the month, extending across eastern New South Wales in the last week of March (satellite image for March 28 below). The solar output figures for Queensland and New South Wales at mid-day on March 28 are compared with the “reference” February 27 outputs below. The almost complete “collapse” of large-scale solar outputs in both Queensland and New South Wales was caused by the cloud extending much further inland in both states, and further north in Queensland than was the case on March 10. In both states, but particularly in NSW, the loss of solar was partly offset by an increase in wind generation.

What this shows is that the concentration of rooftop solar in the large coastal cities of Brisbane and Sydney exposes the vulnerability of the state’s solar generating capacity to cloud cover, especially during the summer season. This situation is likely to be worse in the coming years when it is likely that there will be increased southerly excursions of warm moist air from the tropics. These periods can last for days at a time and highlight the critical need for much more medium and long duration storage to firm even the current penetration of renewable generation.

Electricity Storage Explained -Overview by Dr David Jones

In my last instalment I explained that Australia is going to need at least seven time more energy storage if we are going to have a chance of achieving a reliable and stable 80% renewables target by 2030. I will be upfront here and state that I don’t believe that that this notional target can possibly be met – with medium to long term storage being the big elephant in the room. The reason for this is that pumped hydro is the most critical component needed for large-scale long-term storage. The environmental approvals alone can take years before construction can even start so it is naïve to think that the quantum of required storage can be brought on line before the early 2030s. The current experience with Snowy Hydro 2 provides an object lesson.

Storage Basics

The basic unit of power for energy generation or storage is watts. Typically, we refer to large scale energy systems having a capacity of mega (million) watts or giga (1000 million) watts. In my last blog I noted that Australia is going to need about 22 GW of storage by 2030 to balance the grid. HOWEVER, I did not clarify what this means in terms of duration of storage, and how generation and storage must be matched to ensure we have a 24/7 electricity supply. This critical issue was picked up in some of the comments I received.

So, firstly a primer on energy storage systems (ESS).  ESSs are not primary electricity generators. That is, they do not generate electricity from a fuel such as coal or gas, or from a solar PV system. They must use electricity supplied by separate electricity generators or from an electric power grid to charge the storage system, which makes ESSs secondary generation sources. ESSs use more electricity for charging than they can provide when discharging and supplying electricity. This is contrary to what many people believe because the perception is that the commonly used rechargeable power sources are actually power generators. They are technically “power banks”.

The Power capacity of an ESS is the maximum instantaneous amount of electric power that can be generated on a continuous basis and is measured in units of watts – megawatts [MW], or gigawatts [GW])

The Energy capacity of an ESS is the total amount of energy that can be stored in or discharged from the storage system and is measured in units of watthours – megawatt hours [MWh], or gigawatt hours [GWh])

A battery (eg Li Ion) can be built with an instantaneous capacity of 100MW, BUT it is typically only capable of maintaining this for 2 hours. Thus, you will see this battery being described as 100MW/200MWh. This time rating is somewhat analogous to the capacity factor concept for power generation that I have discussed previously

To put this into practical context such a battery would last for a maximum of 2 hours at full discharge load to supply about 30,00 homes. This would tide the consumers over the 2h peak period in the evening but no more. At least 6 of these batteries would need to be fully charged and ready to go to supply the rest of the night, and the low solar dawn and dusk periods, assuming no other source of power (eg coal, gas, wind, hydro). This is a simplification but what it does show is that a LOT of storage is going to be needed to keep a renewable-based electricity system running 24/7, given that solar can only supply for 7 to 8 hours on a good day, and the intrinsic variability of wind.

How Much Storage?

In fact, the National Electricity Market (NEM) is forecast to need 36 GW/522 GWh of storage capacity by 2034-35 (Figure below) if the current policy trajectory is realised, and coal power is phased out according to these policy settings. (https://aemo.com.au/energy-systems/major-publications/integrated-system-plan-isp/2024-integrated-system-plan-isp).

To put this number into context, the first of the so-called big batteries installed (in South Australia) has a capacity of only 0.13GWh, and the current total system storage is about 20GWh.

Source: Figure 20, 2024 Integrated System Plan, AEMO (https://aemo.com.au/energy-systems/major-publications/integrated-system-plan-isp/2024-integrated-system-plan-isp)

I have constructed the figure below from the data provided in the ISP 2024 to more clearly show the magnitude of the task ahead over the next 5 years. The use of the word “significant” by the authors of this plan doesn’t even come close to describing the order of magnitude increase in storage capacity that is going to be needed.

Storage Duration

Different forms of storage are needed to firm both consumer-owned and utility-scale renewables at different times of the day and year. These vary according to the length of time that electricity can be discharged at maximum output before they are exhausted. https://www.energycouncil.com.au/analysis/battery-storage-australia-s-current-climate/

 Li-batteries are only capable of providing short duration storage of 2 to 4 hours, compared to a typical stockpile of coal providing a one-to-two-month buffer at a coal fired power station. As mentioned in my last blog it is somewhat perverse that coal-fired power stations are effectively providing the night time storage in energy supply to keep the electricity system in this country running through the night!

The next in line proven and commercially available technologies to provide medium duration storage (4-10 hours) for electricity from renewables are flow batteries – with the Australian developed vanadium flow battery technology being an example. Compressed air storage and solar concentrator/molten salt  are others. These storage types can typically last up to 10h. The medium duration storage can also be provided by pumped hydro.

https://www.ess-news.com/2024/11/06/australian-made-vanadium-flow-battery-project-could-offer-storage-cost-of-166-mwh/ https://www.nsw.gov.au/ministerial-releases/broken-hills-energy-future-secured-by-hi-tech-air-energy-storage-system https://arena.gov.au/blog/commercial-concentrated-solar-one-step-closer/ 

Even the largest utility-scale battery installations, cannot yet provide the deep or long-duration storage for many hours, or even multiple days that the grid of the future will need as renewables start to take up an increasing proportion of the generation mix.

Beyond 10 hours and up to the many days that may be needed in the event of a solar and/or wind drought, pumped hydro is the best and most proven option The key difference between a pumped hydro scheme and a traditional hydropower operation is that pumped hydro is not a net generator of electricity. It is both a load and a generator, at different times, as needed. https://www.csiro.au/en/work-with-us/services/consultancy-strategic-advice-services/csiro-futures/energy-and-resources/renewable-energy-storage-roadmap

In my next instalment I will be taking a deeper dive into batteries and pumped hydro, looking at their strengths and weaknesses and summarising where Australia currently sits in the deployment of these technologies.