
Source: https://www.dreamstime.com/stock-vector-illustrations-clipart
Firstly, I will summarise where our electricity and energy (the “power” to run things) currently comes from. Secondly, point out the “elephant in the room” which is the fact that much of Australia’s income (our economic “power”) comes from the export of fossil fuels and is sustaining a large part of our economy and lifestyle.
Australia’s Current Energy Mix
In 2022-2023 fossil fuels (coal, oil and natural gas) accounted for almost all (91 per cent) of Australia’s primary energy mix, and 2/3 (65%) of our electricity. While the percentage contribution by renewables to electricity generation has been steeply rising over the last ten years it still has a very long way to go if the Australian Government’s target of 82% of the electricity is to be provided from renewables by 2030.
Australia’s Energy Exports
The export of fossil fuels (coal and gas) is the largest contributor to Australia’s foreign income. That is, they are the source of much of our economic “power”. It is this income that provides much of the funding for our social security, health and education systems, and perversely for the government’s funding initiatives to facilitate the energy transition. So, the question is what will replace this income stream? This is an existential issue that will need to be addressed sooner rather than later by our Federal and State Governments.
It is well known that Australia is an energy-rich country with large reserves of coal, gas and uranium. In fact, we are the largest exporter of primary energy sources in the world, holding the following rankings:
• Metallurgical (Coking) Coal (for steel making) – No 1
• Thermal Coal (for electricity generation)– No 2 after Indonesia
• Liquefied Natural Gas (LNG) – No 1 or 2 after Qatar or the USA
• Uranium – No 4
So, can it be concluded that since we produce so much coal and gas that we are making (directly or indirectly) a major contribution to the world’s carbon emissions?
World Production Of Coal and Gas
No – not on a world scale where the total amounts of coal and gas produced in Australia are only small fractions of the totals that are being produced elsewhere. Apart from Indonesia, most of the coal produced is used internally by the countries that mine it.
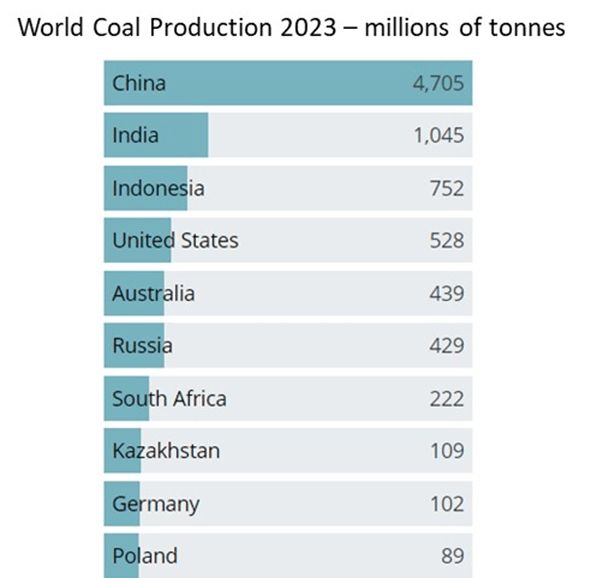
https://yearbook.enerdata.net/coal-lignite/coal-production-data.html
The situation is remarkably similar for natural gas. However, in this case it is the USA and Russia that are by far the dominant producers. Australia ranks a long seventh in the production statistics accounting for about 4.6% of the world’s production. About 70% of the gas produced in Australia is exported as liquefied natural gas (LNG).
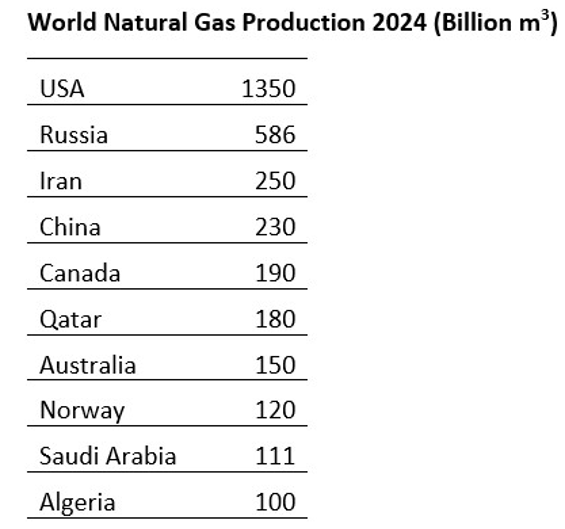
https://investingnews.com/top-natural-gas-producers/
The Value of Australia’s Energy Exports
The energy content and monetary value of Australia’s energy exports for 2021/22 are summarised in the table below. In this table I have shown coal exports (thermal and coking) in aggregate and separately. The reason for this is their different uses- thermal for electricity generation and coking for steel production. It is really important to distinguish between these two uses, since while renewables can potentially replace thermal coal for power generation over the intermediate term such is not the case for steel making where the majority of steel will continue to be made for some time using coke (https://www.aspistrategist.org.au/throttling-australias-coking-coal-exports-wont-help-world-decarbonise/ )
So how much foreign income does Australia get from the export of these energy commodities? In 2021/2022 fossil fuels totalled $183Bn! This is just over one-quarter (25%) of the country’s total income. For interest, the number 1 contributor to our foreign income is iron ore, which accounts for one-fifth (20%).

Sources: Australian Energy Statistics 2023 Tables J & S – https://www.energy.gov.au/publications/australian-energy-update-2023 ; Department of Foreign Affairs and Trade, Value of Australia’s top 25 exports, goods and services – https://www.dfat.gov.au/trade/trade-and-investment-data-information-and-publications/trade-statistics/trade-in-goods-and-services/australias-trade-goods-and-services-2022-23
One of the most important things to take from this table is that although uranium was worth only a fraction of the amount received for coal, the equivalent thermal energy embodied in that uranium is huge. In fact, on a per tonne basis uranium contains 70,000 times the amount of energy as coal. To put it another way that tiny (comparatively speaking) tonnage of U contained 40% of the energy embodied in the total mass of thermal coal that was produced in 2021/22. This partly explains why the fuel is such a low % of the overall cost of constructing and operating a nuclear power plant. It is the other way round for a coal (or gas) power station.
In summary, most of Australia’s energy supply continues to be provided by fossil fuels. Moreover, the export of coal and gas provides the single largest contribution to our foreign income. Reducing the production and export of fossil fuels will require a corresponding increase in foreign income from other sources. This is a major challenge that must be addressed by future governments or else our national per capita income will continue to decline.
In my next instalment I will be taking a closer look at our current sources of electricity.
