We have so much to do to meet the challenges of climate change. We only have limited time, money and resources. So, it becomes critical that we don’t act like headless chooks running around in circles wasting energy. Whatever we do needs to be efficient and well planned and evaluated.
Our public electricity production generates more carbon dioxide per unit of electricity than most of the developed world. On the positive side, our households generate and use a very high level of solar energy outside of the public system.
The Queensland Government reports that our greenhouse emissions have already fallen by 29% since 2005. Our target for 2030 is 30% below our emission levels in 2005. This suggests that we have almost reached our target. What is responsible for this decrease? It is all about clearing land.
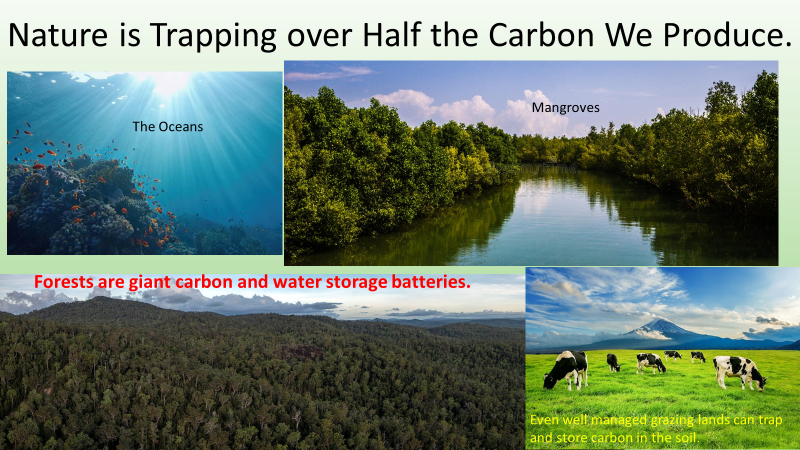
The forests in Queensland are doing a great job of capturing and storing the carbon dioxide we produce. Perversely the decrease in the emission data is entirely due to the slowdown in the rate of forest clearing. When forests are cleared two changes occur. Firstly, there is less forest working hard on our behalf. Secondly, the felled trees and the soil beneath release their stored carbon back into the atmosphere.
Let’s look at some of the data.
How is Queensland going? Queensland’s carbon intensity of electricity consumption is currently almost 700 gCO2eq/kWh. Only a couple of areas in the world produce more carbon dioxide from the production of electricity per unit of electricity. Grant Chalmers presents this data on a regular basis.
For comparison, Tasmania only produces about 25 g of carbon dioxide per kilowatt-hour of electricity produced while South Australia manages an average of slightly more than 100 g per kilowatt-hour of electricity. However, during the night, South Australia hits 400 after the sun goes down when it still relies on the dirtiest form of electricity produced – Victoria’s brown coal.
Unfortunately, most data available from Government sources are a year older than Grant’s data. Grant’s data does not take into account electricity used directly from rooftop solar.
The graph below provides an overview of Queensland’s production of greenhouse gases.

Two sectors stand out: Land use, land-use change and forestry at -3.2% and public electricity producing nearly a third of the greenhouse gases. The graph below shows how the various sectors have changed over time.
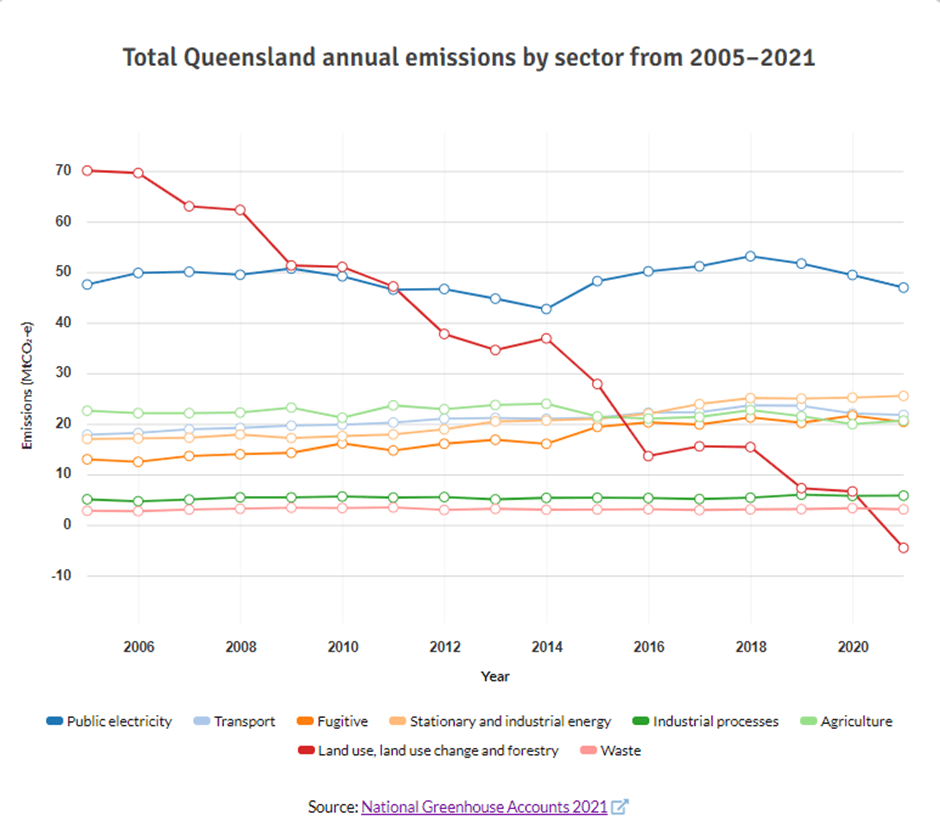
Even the quickest of glances at the graph above shows that greenhouse gas emissions from most sectors have not changed much or even risen since 2005. But look at the fall from the land use, land use change and forestry sector: 70 to below zero. In 2005 about one third of Queensland’s greenhouse gas emissions came from the land use change. Our forests and well managed soils are now just counteracting the damage we are still doing by removing trees in forests but also on grasslands.

This data comes from https://www.des.qld.gov.au/climateaction/emissions-targets if you would like to dig a lot deeper.
The slide below comes from one of my talks and was prepared using information published by the UN.
In my next blog I provide a little more information about the forests in Queensland.
Discover more from My Blog has become My Nuclear Journey
Subscribe to get the latest posts sent to your email.
