Cyclone Alfred was a 1 in 50y event that brought low grade cyclonic winds to southeast Queensland and northern NSW over a period of a week between March 4-11. However, it was the rain and associated flooding after the cyclone crossed the coast that caused the most widespread damage. The multi-day duration of cloud cover that the system brought is the basis of this blog.
Rooftop solar refers to solar panel on roofs, and this is dominated by residential (domestic) installations.
Currently more than 1-in-3 Queensland homes have rooftop solar, the highest rate of any Australian state or territory, with 6 GW having been installed by early 2024. Three quarters of the population of Queensland lives in the southeast corner of the state. Thus, three quarters of the dwellings with rooftop solar are located in this geographic region and account for the great majority of rooftop solar being fed into the grid during the day.
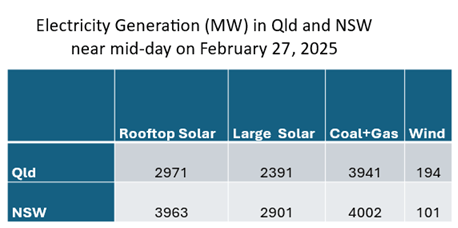
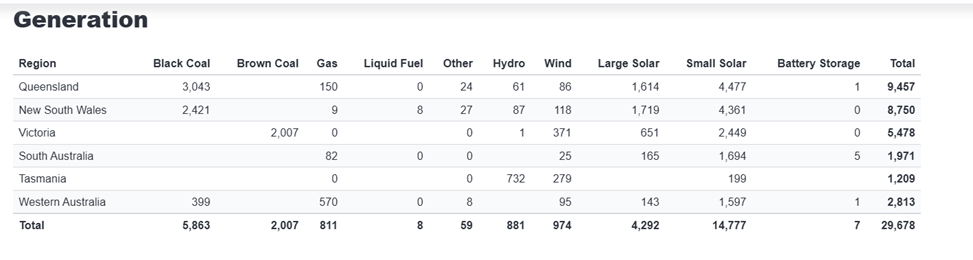
The table below shows the contributions of small (rooftop) and large scale (solar farms) inputs in MW to the Queensland grid in the middle of a typical bright sunny day. The electricity coming from coal and gas, and from wind are included for reference.
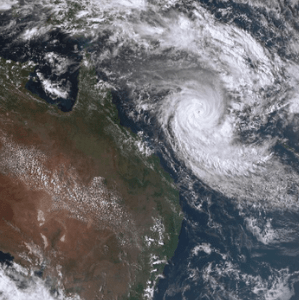
These figures were taken from the NemWatch site on February 27 when the cyclone and associated cloud was well off the coast (satellite image below) and the east coast was largely cloud free. I have also included the comparable figures from NSW for reasons that will soon become apparent.
For both states, solar was making by far the largest contribution to electricity generation.
Satellite Image (source: BOM) on February 27 showing cyclone Alfred and associated cloud well off the east coast.
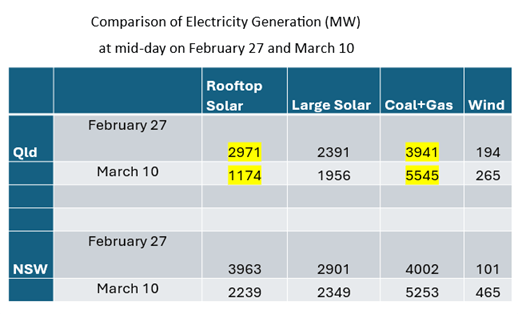
The table below compares the data from February 27 with that at a similar time during the day on March 10 when there was extensive cloud cover over southeastern Qld and northern to central coastal NSW (see satellite image below).
What is immediately apparent from this table is the huge 60% drop (1800MW) in rooftop solar output seen on March 10. There is also an almost 20% drop in the output of large solar, but this is small in comparison. The 2200 MW loss from solar had to be made up by coal and gas generators.
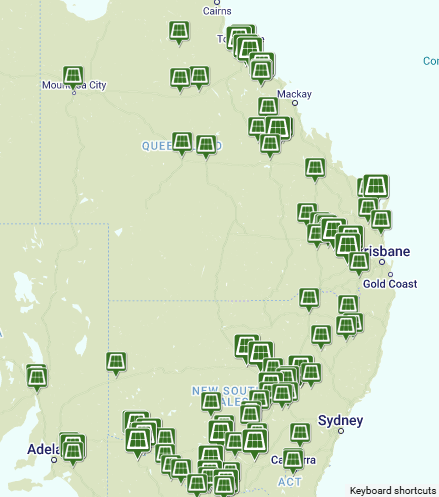
The question is why rooftop solar was impacted so much whereas large solar only suffered a modest decline. The reason is location! The locations of large-scale solar plants down the east coast of Australia are mapped below. What is immediately apparent is that in Queensland most of these are located further inland and north of the cloud covered area.
In New South Wales there was 45% drop in rooftop solar, and a similar 20% drop in large solar. Once again for similar reasons to Queensland where the cloud cover extended down the coast to the Sydney area which hosts the majority of rooftop solar in New South Wales. However, the drop wasn’t as big in Sydney because there was less cloud cover.
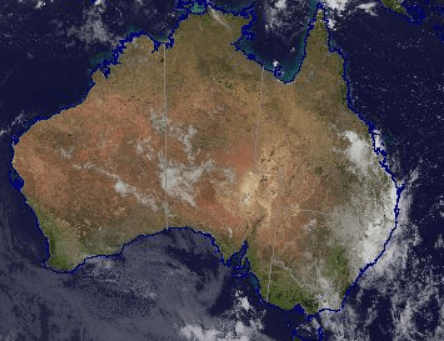
Satellite Image (source: BOM) on March 10 showing extent of cloud cover in southeastern Queensland and northern New South Wales.
This rooftop solar drought lasted for several days after Alfred, with coal and gas power continuing to make up the shortfall. Given that there is very little storage for the renewables component of the grid, this highlights the vulnerability of having the bulk of the rooftop solar generating capacity in the one geographic area. Even for those fortunate enough to have battery storage for their rooftop solar, this backup would not have been sufficient to last for the days of cloud cover.
This situation occurred again in March when a broad band of cloud blanketed much of southeastern Queensland for much of the month, extending across eastern New South Wales in the last week of March (satellite image for March 28 below). The solar output figures for Queensland and New South Wales at mid-day on March 28 are compared with the “reference” February 27 outputs below. The almost complete “collapse” of large-scale solar outputs in both Queensland and New South Wales was caused by the cloud extending much further inland in both states, and further north in Queensland than was the case on March 10. In both states, but particularly in NSW, the loss of solar was partly offset by an increase in wind generation.
What this shows is that the concentration of rooftop solar in the large coastal cities of Brisbane and Sydney exposes the vulnerability of the state’s solar generating capacity to cloud cover, especially during the summer season. This situation is likely to be worse in the coming years when it is likely that there will be increased southerly excursions of warm moist air from the tropics. These periods can last for days at a time and highlight the critical need for much more medium and long duration storage to firm even the current penetration of renewable generation.
I began my last blog by noting that sufficient storage, especially medium to long term storage will be critical to ensuring reliability for a renewable dominated grid. Here I will be discussing battery storage from home to utility scale, and the critical role that pumped hydro must play for long duration storage.
Batteries
The big benefit of batteries is their flexibility. Energy stored in batteries can be discharged quickly when needed. However, individual battery systems of the Lithium-ion (Li-ion) type can only currently provide about 2-4h of backup supply at full discharge rate. Below I discuss separately battery use for rooftop and large scale solar and wind.
Rooftop (Small) Solar
At the end of 2024 there were almost 4 million rooftop solar photovoltaic (PV) installations in Australia on 1 in 3 homes, totalling about 25 GW of nameplate capacity. This sounds like a lot and indeed in the middle of the day this is the biggest single source (up to 40%) of the electricity entering the grid in Qld, NSW and Vic. Installations are increasing by about 350,000 annually However, this situation is starting to lead to serious problems with maintaining 24/7 stability of the grid, largely because only 1/14 of the millions of rooftop solar installations have any associated storage! One of the major reasons for this situation has been the high cost of batteries which has made them economically unattractive for most homes.
“But when your power is coming from the sun, there’s no fuel. We’re not short of sun. It’s not really wasting it.
“Worrying about wasting surplus solar energy is kind of like worrying about the rain coming out of the sky when your rain tanks are full.”
I contend that this is a perverse statement. The reason being that while the energy from the sun might be free, the solar panels that convert the light to electrical energy require a lot of energy (mainly from coal) and material inputs to manufacture them. So, spillage effectively amounts to a decrease in the emission savings that can be attributed to solar. And no one is taking that into account!
There are proposals to install larger scale community batteries to take some of the daytime solar surplus, but the issue of who will pay for these initiatives beyond a few government-subsidised trial locations remains to be seen. Likewise daytime charging of electric vehicles may ultimately take up some of the rooftop solar surplus, but that is contingent on many more EVs entering service and charging stations being installed.
There is also the (policy) expectation that the batteries in EVs will be able to act as storage systems for the home (an EV battery is often 4-5 times bigger than a typical 12-14kWh home storage battery), and that this will ultimately make up a substantial proportion of short-term storage for the grid. However, as of the end of 2024 South Australia was the only state that allows bidirectional chargers to be installed in homes. Bidirectional chargers are also expensive, costing around $10,000, and the payback time for households is still more than ten years. https://www.mynrma.com.au/open-road/advice-and-how-to/what-is-v2l-v2h-v2g
Utility (Large) Batteries
There is currently about 18GW of large solar PV and 11 GW of wind power in Australia. However, very few of these projects currently have significant co-located storage.
Li-ion
The so-called “big” batteries are being installed to store surplus power from the renewables. About 8GW of largely Li-ion storage, typically with a duration of 2-4 hours, is currently under construction and being commissioned.
To meet projected grid storage requirements there will need to be 7 GW of battery type storage installed every year.
Decommissioned coal-fired power plant sites have been preferred locations for large-scale battery projects due to their existing electricity transmission infrastructure and previous industrial usage. AGL is building the 500MW/ 1GWh Liddell Battery Project in New South Wales. In May 2024 Queensland announced it was doubling the size of its Stanwell Clean Energy Hub battery, to 300 MW/1200 MWh. A battery at Collie in Western Australia will have a 219 MW/877 MWh first stage, with potentially up to 1000 MW/4000 MWh. To put these examples of current projects into context the initial “big” battery in South Australia had a capacity of only 130 MWh.
However, even the biggest of these batteries, is “small” compared to what will be needed. Not only that but typically they can only provide 2-4h storage. So, a 500MW battery might sound large but typically it can only provide full power for 2-4h (ie 1000-2000 MWh). We are going to need a lot more of these batteries if the 2030 renewables target is to be met.
One advantage that batteries have over pumped hydro is that they can be installed relatively quickly.
Like solar panels, the operational lifespan of current Li-ion batteries is relatively short, needing to be replaced around every 15 years. This presents a challenge for Australia’s net zero ambitions, as batteries that have been installed through the 2020s are likely to be need to be replaced in the 2040s – when the transition to net zero by 2050 will be imminent.
One critical aspect of Li-ion batteries that is rarely mentioned when the capacity of utility batteries is stated is that unless they are operated routinely between 20-80% of capacity then their life can be substantially shortened. This will constrain the effective supply capacity of a battery system if lifetime is to be maximised.
Flow Batteries
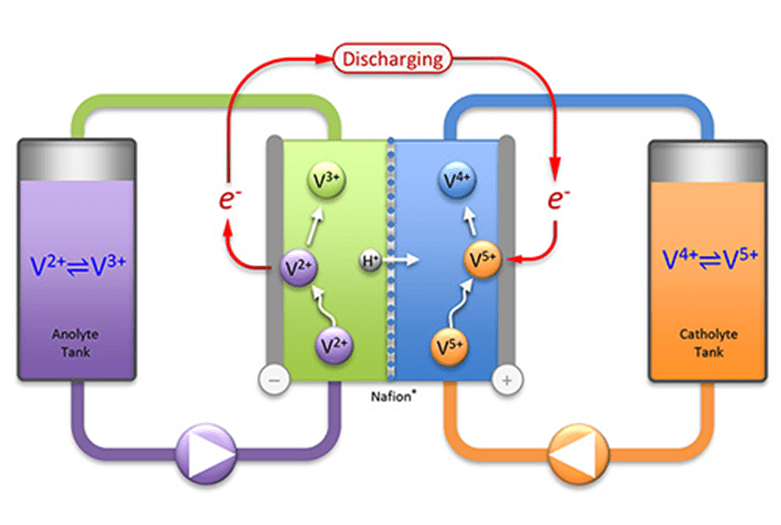
The other type of utility scale battery that is starting to emerge are flow batteries. These function a bit like pumped hydro because they work on the principle of the electrolyte fluid being circulated from charge to discharge tanks. Unlike Li batteries they can be made very large, and can be easily scaled up by increasing the capacity of the electrolyte storage tanks. They also have potentially a very long life, they cannot catch on fire, and the components are easy to recycle. They are ideal for large stationary utility storage. Vanadium flow battery technology was originally developed at the University of NSW in 1980s.
This is a schematic of a Vanadium flow battery, showing the different charged states of the Vanadium.
The largest commercial vanadium flow battery project is currently in China with a capacity of 175 MW/700 MWh. Australia has the third largest vanadium resource in the world so is potentially ideally placed to capitalise on this technology for future storage requirements. A potential 100MW/400GWh battery project is currently undergoing commercial evaluation in Perth. (https://www.ess-news.com/2024/11/06/australian-made-vanadium-flow-battery-project-could-offer-storage-cost-of-166-mwh/)
Pumped Hydro
The key difference between a pumped hydro scheme and a traditional hydropower operation is that pumped hydro is not a net generator of electricity. It is both a load and a generator, at different times, as needed. There are over 120 operating hydroelectric power stations in Australia, large and small, mostly located in south eastern Australia. In contrast, there are currently only 3 operating pumped hydro systems.
RTE measures the effectiveness of a storage system by measuring the ratio of energy output to energy input during a full charge-discharge cycle. The higher the RTE, the lower the losses and therefore higher the efficiency. Even more compelling is that the return on energy invested compared with return over its lifetime (EROI) for pumped hydro is almost 30 times higher than Li ion batteries! Pumped hydro projects also use very well-known and tested technologies and infrastructure that can last 50 to 100 years or even longer, compared to the much shorter (15-20 years) lifespan of batteries.
There is another compelling attraction for pumped hydro. Hydropower systems are synchronous generators. That is, they are similar to coal and gas fired thermal power stations running large turbines and do not require the elaborate stabilisation and conditioning (with associated costs) needed for direct inputs from solar and wind.
However, there is a major problem with pumped hydro compared with large battery systems that can be installed in months following delivery of the components. Pumped hydro systems are big infrastructure projects with long timelines required for environmental approvals, site characterisation, and construction.
So, what pumped hydro capacity does Australia currently have? The fact is that there has been very little hydro development in Australia since the 1970s. The plot below shows the annual output of hydro schemes in Australia from 1970 to 2021. In essence it has flatlined since 1970.
Data Source: Department of Climate Change, Energy, the Environment and Water, Australian Energy Statistics, Table I, September 2022
There is currently only 1.4 GW of operational pumped hydro capacity in Australia, with none having been commissioned since Wivenhoe in 1984. A further nominal 2GW is currently under construction as part of the much delayed and cost escalating Snowy Hydro 2 scheme.
Pumped Hydro (existing and under construction) in Australia
However, there is absolutely no doubt about the cost effectiveness of the Snowy project, even at the current estimated cost of $12Bn. For comparison, it would cost hundreds of billions of dollars using Li-Ion batteries to provide the equivalent amount of long duration storage.
Until the end of 2024 the 5GW Pioneer Burdekin pumped hydro scheme was being proposed for Qld. This would have been the largest pumped hydro scheme in the world, at an estimated cost of $20-30Bn. However, this project was terminated following the Qld State election and change of government, in favour of a number of smaller schemes, including the 2GW Borumba project. However, even the Borumba project may be scaled back to 1.5GW. Each of these pumped hydro schemes will require years to fully plan, obtain environmental approvals, and construct. There are other pumped hydro projects that are being considered but they are too early in the planning and approvals process to be mentioned here. https://www.allens.com.au/insights-news/insights/2025/02/pumped-hydro-current-projects-in-development-across-australia/
It is clear that there is no way that sufficient long duration storage is going to be in place by 2030-2035 when the current national policy settings require the 80% renewable electricity target to be met, as major coal-fired generators are scheduled to be phased out.
In my next instalment I will discuss what Cyclone Alfred has taught us about the vulnerability of electricity supply from rooftop solar in Queensland during adverse climate events in the southeast of the state.
In my last instalment I explained that Australia is going to need at least seven time more energy storage if we are going to have a chance of achieving a reliable and stable 80% renewables target by 2030. I will be upfront here and state that I don’t believe that that this notional target can possibly be met – with medium to long term storage being the big elephant in the room. The reason for this is that pumped hydro is the most critical component needed for large-scale long-term storage. The environmental approvals alone can take years before construction can even start so it is naïve to think that the quantum of required storage can be brought on line before the early 2030s. The current experience with Snowy Hydro 2 provides an object lesson.
Storage Basics
The basic unit of power for energy generation or storage is watts. Typically, we refer to large scale energy systems having a capacity of mega (million) watts or giga (1000 million) watts. In my last blog I noted that Australia is going to need about 22 GW of storage by 2030 to balance the grid. HOWEVER, I did not clarify what this means in terms of duration of storage, and how generation and storage must be matched to ensure we have a 24/7 electricity supply. This critical issue was picked up in some of the comments I received.
So, firstly a primer on energy storage systems (ESS). ESSs are not primary electricity generators. That is, they do not generate electricity from a fuel such as coal or gas, or from a solar PV system. They must use electricity supplied by separate electricity generators or from an electric power grid to charge the storage system, which makes ESSs secondary generation sources. ESSs use more electricity for charging than they can provide when discharging and supplying electricity. This is contrary to what many people believe because the perception is that the commonly used rechargeable power sources are actually power generators. They are technically “power banks”.
The Power capacity of an ESS is the maximum instantaneous amount of electric power that can be generated on a continuous basis and is measured in units of watts – megawatts [MW], or gigawatts [GW])
The Energy capacity of an ESS is the total amount of energy that can be stored in or discharged from the storage system and is measured in units of watthours – megawatt hours [MWh], or gigawatt hours [GWh])
A battery (eg Li Ion) can be built with an instantaneous capacity of 100MW, BUT it is typically only capable of maintaining this for 2 hours. Thus, you will see this battery being described as 100MW/200MWh. This time rating is somewhat analogous to the capacity factor concept for power generation that I have discussed previously
To put this into practical context such a battery would last for a maximum of 2 hours at full discharge load to supply about 30,00 homes. This would tide the consumers over the 2h peak period in the evening but no more. At least 6 of these batteries would need to be fully charged and ready to go to supply the rest of the night, and the low solar dawn and dusk periods, assuming no other source of power (eg coal, gas, wind, hydro). This is a simplification but what it does show is that a LOT of storage is going to be needed to keep a renewable-based electricity system running 24/7, given that solar can only supply for 7 to 8 hours on a good day, and the intrinsic variability of wind.
To put this number into context, the first of the so-called big batteries installed (in South Australia) has a capacity of only 0.13GWh, and the current total system storage is about 20GWh.
I have constructed the figure below from the data provided in the ISP 2024 to more clearly show the magnitude of the task ahead over the next 5 years. The use of the word “significant” by the authors of this plan doesn’t even come close to describing the order of magnitude increase in storage capacity that is going to be needed.
Storage Duration
Different forms of storage are needed to firm both consumer-owned and utility-scale renewables at different times of the day and year. These vary according to the length of time that electricity can be discharged at maximum output before they are exhausted. https://www.energycouncil.com.au/analysis/battery-storage-australia-s-current-climate/
Li-batteries are only capable of providing short duration storage of 2 to 4 hours, compared to a typical stockpile of coal providing a one-to-two-month buffer at a coal fired power station. As mentioned in my last blog it is somewhat perverse that coal-fired power stations are effectively providing the night time storage in energy supply to keep the electricity system in this country running through the night!
The next in line proven and commercially available technologies to provide medium duration storage (4-10 hours) for electricity from renewables are flow batteries – with the Australian developed vanadium flow battery technology being an example. Compressed air storage and solar concentrator/molten salt are others. These storage types can typically last up to 10h. The medium duration storage can also be provided by pumped hydro.
Even the largest utility-scale battery installations, cannot yet provide the deep or long-duration storage for many hours, or even multiple days that the grid of the future will need as renewables start to take up an increasing proportion of the generation mix.
In my next instalment I will be taking a deeper dive into batteries and pumped hydro, looking at their strengths and weaknesses and summarising where Australia currently sits in the deployment of these technologies.
This is the fourth in a basic series about electricity written by Dr David Jones.
The 80% renewable electricity target by 2030 cannot be achieved unless there is sufficient storage in place for the output of variable renewables.
When you think about it, storage has always been a primary issue for electricity generation. In the case of coal there has always needed to be sufficient coal in bunker storage at a power station to feed the furnaces. Coal is a concentrated form of “solar energy” that was captured by plant photosynthesis many millions of years ago – so it is a form of energy storage. Likewise with gas.
As Australia transitions towards a planned renewables-based electricity generating system it will be critical to have sufficient storage to maintain power supply during periods when intermittent primary generation sources are not producing power. Shutting down existing dispatchable, fossil-fuelled generation before the required storage is in place will likely lead to frequent, unpredictable, widespread blackouts.
As discussed in a previous instalment, solar PV (especially rooftop solar) has a low capacity factor since electricity is only produced when the sun is shining. Let’s assume for simplicity that large scale solar PV with a capacity factor of 30% is the only source of generation. Electricity is produced during an 8h daytime window. What about the rest of the 24h period?
To ensure that sufficient electricity is produced for a 24h period, “surplus” electricity needs to be produced and stored during the day, for use during the dawn and dusk periods and through the night. This means that more than 3 times, over and above the daytime requirement, needs to be produced and stored. Thus, a 300MW nameplate capacity solar farm would be needed to produce 100MW, averaged over the 24h period, with sufficient storage.
The situation is more complicated with wind because of its intermittent nature, noting that the average capacity factor of an onshore windfarm in Australia is about 35%. However, in contrast to the regular and predictable day/night cycle for solar, wind is typically quite variable. So even with overbuilding x3 to allow for the capacity factor, if there is no wind (be it day or night) there will be no power produced.
So, we are going to need storage and LOTS of it, if our current electricity system is going to function with 80% renewables by 2030. What are we looking at for 2030 and how much more is going to be needed between now and then, and beyond?
Australia’s total current storage capacity is only 3GW. Current forecasts by the Australian Energy Market Operator (AEMO) show Australia will need at least 22GW by 2030 – a more than 7 fold (700%) increase in capacity in the next six years.
In my next instalment I will be taking a closer look at the main options that are being proposed for large scale storage – pumped hydro and batteries – and the challenges associated with them.
The “nameplate” capacity of a powerplant is the maximum design output that can be produced, assuming no constraints on inputs.
The capacity factor measures how often a power plant is running at maximum power. For example, a plant with a capacity factor of 100% means it is producing power all of the time.
In practice, the capacity factor is defined as the ratio of the actual electrical energy produced by a facility over a specific period (usually a year) to the maximum possible electrical energy that could have been produced if the generator operated at continuous full power.
In practice here are two contributions to capacity factor. Firstly, the “fuel” that drives the generator, and secondly the availability of the generator.
In the case of renewables, the fuel is limited by the amount of sunshine (solar), wind speed (wind turbines) and water (hydroelectricity). For fossil fuels it is the availability of gas or coal. Technically, and in the absence of plant breakdown, a gas or coal plant could operate 24/7 with a continuous supply of fuel. This is not the case for solar (day/night cycle), and generally not the case for wind. Once through hydropower can operate 24/7 if there is enough water available. However, in the case of pumped hydro the operating hours are limited by the availability of electric power from another source to recharge the system.
The availability of a generator depends on how much time is needed to maintain it via scheduled and unscheduled maintenance. Historically, Australia’s coal fired power plants were run continuously at high capacity to provide so-called baseload power. However, as more renewables have come into the system the operating output has had to be severely reduced during the middle of the day to accommodate especially the surge in input from rooftop and large scale solar. Thus, in recent years this has caused a drop in the average effective capacity factor of the coal fired generators. This is distinct from the intrinsic capacity of these stations, which is realised at night, where in excess of 80% of the electricity needed in Qld and NSW is still produced by these generators (see previous instalment).
Solar Power
As of 30 September 2024, there was over 3.92 million PV installations in Australia, with a combined nameplate capacity of over 37.8 gigawatts (https://pv-map.apvi.org.au/analyses ).
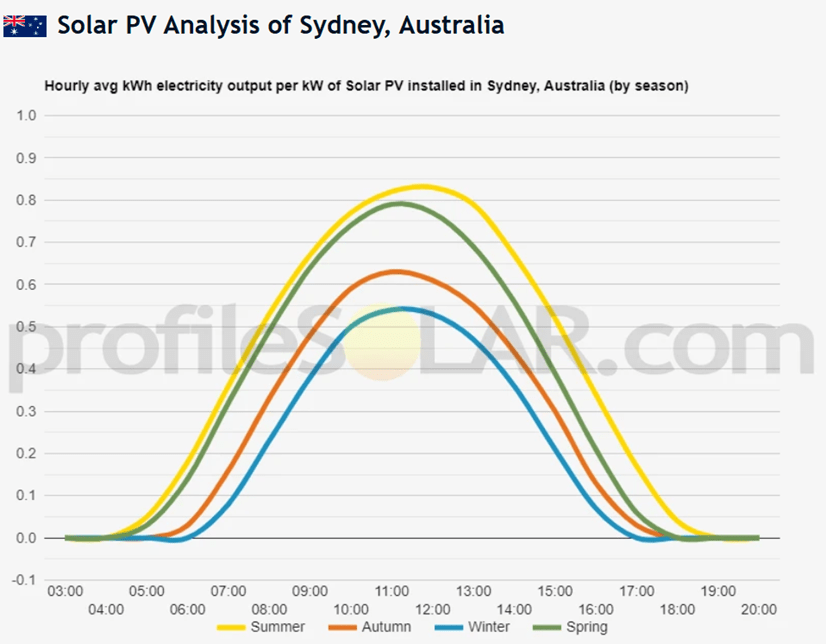
This power source can only operate when the sun is shining. So, the basic limitation is the day/night cycle, the length of which changes through the year. In southern latitudes both the day length and maximum solar intensity can be much less during the winter months than in summer. This annual difference is much less in the tropical latitudes. An additional issue is whether the solar panels can track the position of the sun during the day and throughout the year. Tracking arrays are often installed in large solar farms but this is not the case for the fixed orientation of rooftop solar. So, typically large scale solar has a higher capacity factor than rooftop solar.
In Qld the capacity factor of large solar approaches 30%, whereas in Vic and SA it drops to 20%, for an overall Australian average of about 22%. In contrast, the average capacity factor for rooftop solar is only around 12 per cent, much lower than for large utility-scale solar. Ironically the much higher yielding large solar is increasingly being curtailed by AEMO (because it can control these inputs) precisely because of the increasing amounts of currently uncontrolled roof top solar that is flooding the grid.
In a recent report by the Clean Energy Council (Rooftop solar and storage report January—June 2024) the first dot point in the Executive Summary stated that:
“Rooftop solar photovoltaic (PV) installations are on track to pass a total of 25 GW installed capacity in Australia by the end of 2024. By comparison, black and brown coal combined for a total of 21.3.GW of installed capacity in the financial year 2023-24.“
This sounds like a lot doesn’t it? However, from the discussion above, directly comparing installed (nameplate) capacity of rooftop solar with coal generators is totally inappropriate, owing to the vastly different capacity factors of these two sources of electricity. Fortunately, the 4th dot point in the Clean Energy Council report Executive Summary clarifies this by stating that rooftop solar installations produced about 11% of dispatchable power in the first half of 2024. This is a substantial amount, but only a fraction of what the first statement above from the Clean Energy Council could be taken to imply. Indeed 11% is about 13,500 GWh which converts to 3.1GW input, and 3.1GW is 12.4% of 25GW. This is exactly the capacity factor for rooftop solar that is quoted above!
Wind Power
Wind turbines typically require wind speeds greater than 6km/h to operate, with generation peaking at around 15km/h, noting that there is a mechanical limit on how fast the blades can rotate. The figure below shows the wind speed dependence for a 3.5MW turbine.
The average capacity factor for an on-shore wind farm in Australia is around 35%, and ranges from 25% (even less at some locations) to 45% (source: Wind Energy Fact Sheet, NSW Dept of Environment and Heritage, https://www.environment.nsw.gov.au/resources/communities/100923-wind-facts.pdf ). Wind, unlike solar, is not constrained by the day/night cycle and thus can potentially operate throughout the day. However, wind generation is highly variable. The plots below show the dispatchable power (MW) and capacity factors (%) for the eastern grid system for the month of September 2024 ( https://anero.id/energy/wind-energy). For reference the total current installed wind capacity is about 11,000MW. Offshore wind potentially has a higher capacity factor (up to 50%) than onshore wind, but the Australian offshore wind industry is still in its infancy.
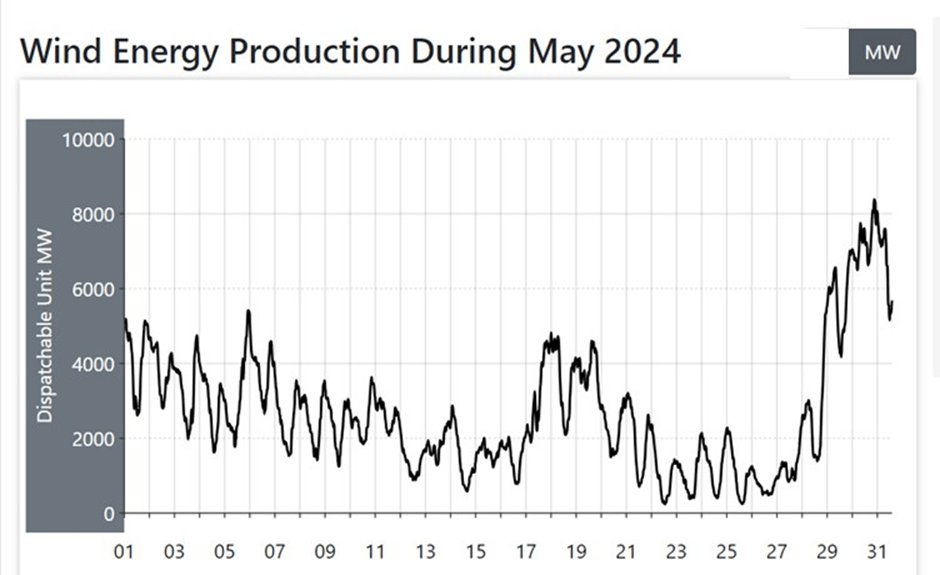
September was a good month. However, earlier in the year there was a prolonged wind “drought” through April and May, with the dispatchable power and capacity factors for May shown below ( https://anero.id/energy/wind-energy).
Hydroelectricity (Hydro)
Hydro is regarded as a renewable source of electricity since its source of “fuel” is water that is provided by rainfall. There are two types of hydro. (1) Once-through hydro which requires a continuous supply of water, and (2) pumped hydro which recycles its water via energy supplied from other primary sources. In total, the two forms of hydro currently account for about 6% of total annual electricity production (Source: Table 13 in the Australian Energy Update 2024 produced by the Australian Government (https://www.energy.gov.au/sites/default/files/2024-08/australian_energy_update_2024.pdf). Apart from in Tasmania, where it provides the bulk of electricity at all times, hydro is mainly used on the mainland in the evening peak periods.
Hence the “capacity factor” for hydro is currently highly variable. However, this may change in the future when there is planned to be a substantial expansion of pumped hydro to provide large-scale long-term storage for wind and solar generators.
Coal
Over past decades coal power stations operated at around 85% of full capacity since historically they were run 24/7 at near full output to provide the majority of supply to the grid. This is where the term baseload power originates from. However, the capacity factor has declined substantially from 88% in 2008 to 67% in 2020 and subsequently to 60% in 2023-24.
Much of the recent decline in capacity factor has been the result of daytime curtailment of generation by the preferred feed in status given to rooftop and large scale solar. In fact, it is not uncommon in Qld, NSW and Vic for the production from coal-fired power stations to be almost 50% or ½ during the middle of the day compared to night-time. The need to ramp up and down over such a large range also causes significant thermo-mechanical stresses which increase the need for maintenance and increases the possibility of unplanned shutdowns. Further complicating this situation is that as more generators are shut down there is less and less redundancy in the system to buffer unplanned outages, especially during the night time period.
It is this “perfect storm” of risk factors that is the source of the perception that coal-fired power stations are the source of the reliability problems in the grid. In fact, the reverse is the case where in the current absence of sufficient storage for renewable generation they are providing much of the critical day-night buffer without which the grid would collapse at night.
Gas
In contrast to coal gas power station capacity factors vary from as high as 85% to less than 10% (if designed only to supply electricity at peak periods). Gas currently accounts for about 18% of annual electricity generation, with its main use in the Eastern states being during the nighttime peak period.
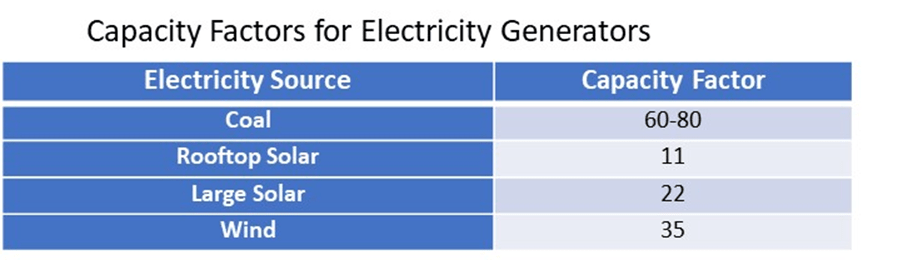
The Table below summarises the average capacity factors for the current major suppliers of electricity to the grid, coal, rooftop and large solar, and wind. I have not included hydro or gas in this Table because they are typically used for peak demand management and hence are not directly comparable with these other sources.
Summary
What immediately stands out here is that the capacity factor for coal is many times higher than for solar and wind. This means is that for a given 100MW nameplate capacity you will on average get 60-80MW from coal, 11MW from rooftop solar, 22 MW from large solar and 35MW from wind. So, when a new renewables development is announced and the claim is made that it will produce x megawatts that will supply a certain number of homes, it may not be clear what this actually means. If such a claim is based on nameplate capacity, then it is at best very misleading!
In my next instalment I will be talking about storage, and how critical it will be to have sufficient storage in place for the renewable energy transition.
In 2022-23 two-thirds (66%) of electricity came from fossil fuels (black coal, brown coal and gas). Fossils fuels are still by far the dominant source of electricity on an annualised basis. However, the huge increase over the past few years in solar PV has meant that there has been a fundamental change in the primary sources of electricity between the day and the night. This difference between the day and the night has critical implications for ongoing management of the electricity supply grid and will be the focus of much of this instalment.
The Nem-Watch site reports the distribution of electricity sources for Australia’s Southern and Eastern Power Grid (Qld, NSW, Vic, Sa, Tas) and for WA. These data are updated every 5-30 mins over a 24h period.
Middle of the Day
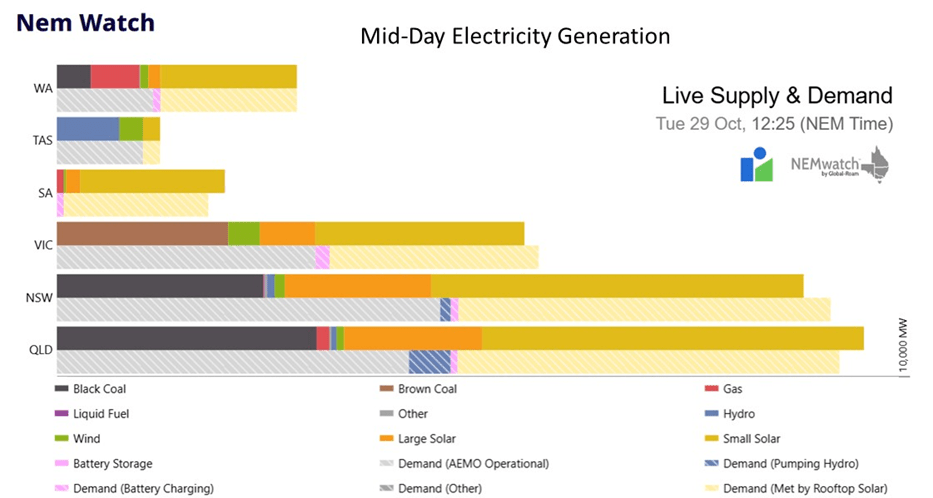
A “typical” current (October 2024) around mid-day distribution of electricity supply is shown below in graphical and tabular format (source: NEM-Watch).
What is immediately apparent is the very large contribution from rooftop (small solar) and large scale solar (the large orange bars on right of the plots above for each state) to the totals in all states apart from Tasmania. This mid-day (ie solar maximum) contribution is very consistent from day-to-day in the absence of cloud cover. Moreover, at this specific time the input from rooftop solar was much greater than for large solar, perhaps indicating that large solar was being curtailed.
Wind Power
In contrast to the regularity of solar, the contribution from wind tends to be highly variable from day-to-day (see below October 2024 output plot for wind: source – https://anero.id/energy/wind-energy) noting that there is currently about 11000 MW of nameplate wind capacity feeding into the southern and eastern power grid. A good performing wind farm in Australia is regarded as one that has a capacity factor of 37%. That is, on average the dispatchable electricity is a bit more than 1/3 of the nameplate.
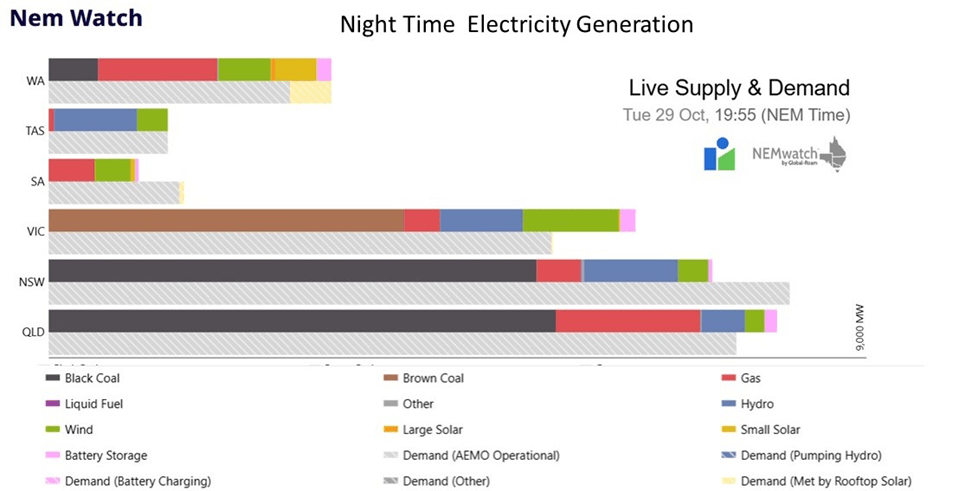
Night Time
By the time that night has fallen (figure below) there is a complete reversal of the major sources of electricity with coal and gas becoming major sources in all states apart from Tas, and by far the dominant sources in Qld, NSW, Vic and WA. The coal is shown by the black and brown bars and gas by the red bars.
What About South Australia?
South Australia is often regarded as being the “poster child” for the uptake of renewable energy by a mainland state. Yes, it is true that for limited periods the state has been running on 100% renewables. However, the reality is that without the backup provided by gas generators and by inputs of top-up power via the grid connections with other states, SA would be without sufficient electricity for extended periods of time.
Summary
The specific examples I have given above have been selected to illustrate the extremes that do occur between day and night. There are periods when both wind and hydroelectricity make larger contributions in the evening and night, reducing the demand on coal and gas. Hydro is a particularly consistent performer in Qld, NSW and Vic. In contrast WA has no hydro, and generation in Tasmania is dominated by hydro essentially all the time.
So, in summary during the peak sunlight hours rooftop solar currently makes the major contribution to total generation, ranging from 57% in NSW to 94% in SA. Indeed, there is now so much rooftop solar that it is starting to threaten grid stability. Hence, the recently announced move by AEMO (the Australian Electricity Market Operator) to start to limit the export of rooftop solar into the grid.
When the sun goes down coal and gas dominate the grid, ranging from 51% in SA to over 80 % in Qld and NSW. For this dependence (for 16h of the day!) on fossils fuels to be reduced, not only will there need to be much more renewable capacity installed but there will have to be in tandem a massive increase in the amount of storage (batteries and pumped hydro) from its current low levels.
In my next instalment I will be discussing capacity factors and what these mean for the amount of electricity that can be provided by renewables.
Firstly, I will summarise where our electricity and energy (the “power” to run things) currently comes from. Secondly, point out the “elephant in the room” which is the fact that much of Australia’s income (our economic “power”) comes from the export of fossil fuels and is sustaining a large part of our economy and lifestyle.
Australia’s Current Energy Mix
In 2022-2023 fossil fuels (coal, oil and natural gas) accounted for almost all (91 per cent) of Australia’s primary energy mix, and 2/3 (65%) of our electricity. While the percentage contribution by renewables to electricity generation has been steeply rising over the last ten years it still has a very long way to go if the Australian Government’s target of 82% of the electricity is to be provided from renewables by 2030.
Australia’s Energy Exports
The export of fossil fuels (coal and gas) is the largest contributor to Australia’s foreign income. That is, they are the source of much of our economic “power”. It is this income that provides much of the funding for our social security, health and education systems, and perversely for the government’s funding initiatives to facilitate the energy transition. So, the question is what will replace this income stream? This is an existential issue that will need to be addressed sooner rather than later by our Federal and State Governments.
It is well known that Australia is an energy-rich country with large reserves of coal, gas and uranium. In fact, we are the largest exporter of primary energy sources in the world, holding the following rankings: • Metallurgical (Coking) Coal (for steel making) – No 1 • Thermal Coal (for electricity generation)– No 2 after Indonesia • Liquefied Natural Gas (LNG) – No 1 or 2 after Qatar or the USA • Uranium – No 4
So, can it be concluded that since we produce so much coal and gas that we are making (directly or indirectly) a major contribution to the world’s carbon emissions?
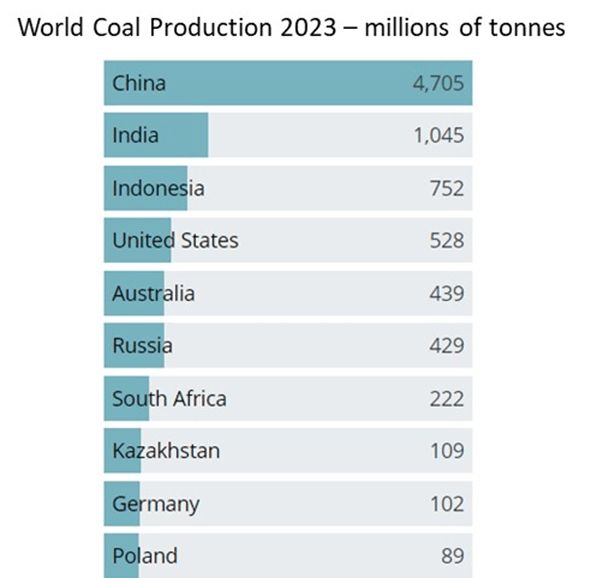
World Production Of Coal and Gas
No – not on a world scale where the total amounts of coal and gas produced in Australia are only small fractions of the totals that are being produced elsewhere. Apart from Indonesia, most of the coal produced is used internally by the countries that mine it.
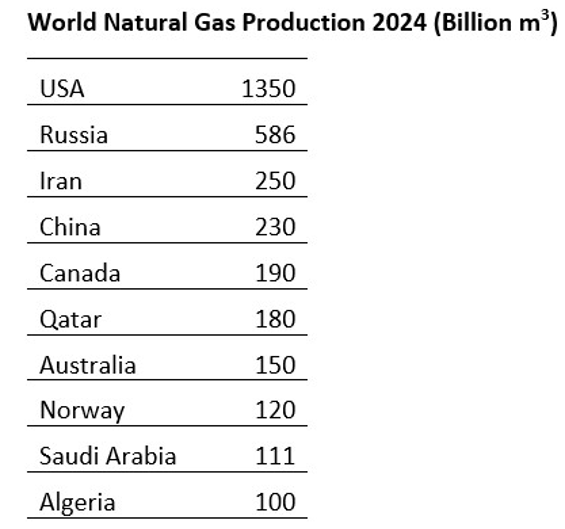
The situation is remarkably similar for natural gas. However, in this case it is the USA and Russia that are by far the dominant producers. Australia ranks a long seventh in the production statistics accounting for about 4.6% of the world’s production. About 70% of the gas produced in Australia is exported as liquefied natural gas (LNG).
The energy content and monetary value of Australia’s energy exports for 2021/22 are summarised in the table below. In this table I have shown coal exports (thermal and coking) in aggregate and separately. The reason for this is their different uses- thermal for electricity generation and coking for steel production. It is really important to distinguish between these two uses, since while renewables can potentially replace thermal coal for power generation over the intermediate term such is not the case for steel making where the majority of steel will continue to be made for some time using coke (https://www.aspistrategist.org.au/throttling-australias-coking-coal-exports-wont-help-world-decarbonise/ )
So how much foreign income does Australia get from the export of these energy commodities? In 2021/2022 fossil fuels totalled $183Bn! This is just over one-quarter (25%) of the country’s total income. For interest, the number 1 contributor to our foreign income is iron ore, which accounts for one-fifth (20%).
One of the most important things to take from this table is that although uranium was worth only a fraction of the amount received for coal, the equivalent thermal energy embodied in that uranium is huge. In fact, on a per tonne basis uranium contains 70,000 times the amount of energy as coal. To put it another way that tiny (comparatively speaking) tonnage of U contained 40% of the energy embodied in the total mass of thermal coal that was produced in 2021/22. This partly explains why the fuel is such a low % of the overall cost of constructing and operating a nuclear power plant. It is the other way round for a coal (or gas) power station.
In summary, most of Australia’s energy supply continues to be provided by fossil fuels. Moreover, the export of coal and gas provides the single largest contribution to our foreign income. Reducing the production and export of fossil fuels will require a corresponding increase in foreign income from other sources. This is a major challenge that must be addressed by future governments or else our national per capita income will continue to decline.
In my next instalment I will be taking a closer look at our current sources of electricity.
There is currently much confusion in understanding how big the task will be, and how long it will take, to decarbonise Australia’s energy supply. In particular, electricity generation is being used interchangeably with energy demand in communications from the Government and much of the general media. This confused situation is not helping us understand the current heated debate about the path forward for the energy transition.
The chart below shows how Australia’s energy mix has changed from the 1980s to the present. The energy units are Petajoules (PJ). One PJ is the heat energy content of about 43,000 tonnes of black coal or 29 million litres of petrol.
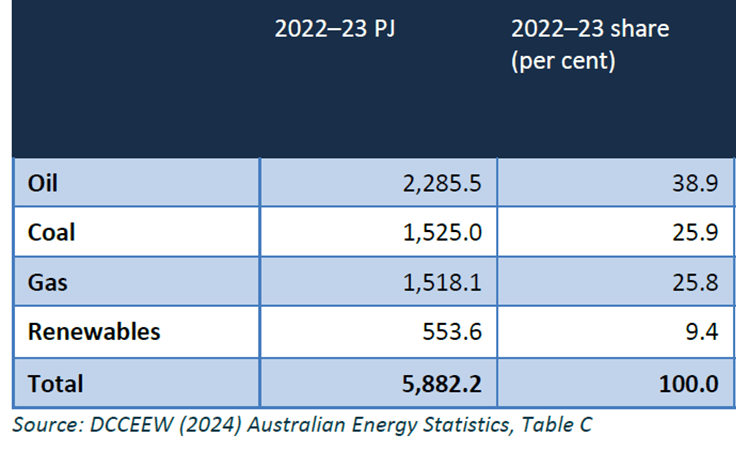
Source: DCCEEW (2024) Australian Energy Statistics, Table C
Latest Data on Australian Energy Consumption by Fuel Type
Oil, including crude oil, liquefied petroleum gas (LPG) and refined products, make up the largest share of energy consumption (39 per cent), with coal and natural gas both at 26 per cent.
Although renewable electricity generation has more than doubled over the last decade, it still only accounts for 9% of Australia’s total energy consumption. It will be a surprise to many to learn that combustion of biomass such as firewood and bagasse (the remnant sugar cane pulp left after crushing in Qld & northern NSW) makes up about a third of all renewable energy generation in Australia. But wait a minute, aren’t we being told that renewables make up 37% (solar-16%, wind – 12% and hydro-6%) of the total amount of electricity currently being generated in Australia?
So where does this 37% number come from, when renewables only make up only 9% of the total energy mix?
Well, the fact is that electricity generation currently only makes up about one-quarter or 25% of the total current energy demand. 25% of 37% is 9.2%.
So, both numbers (9% and 37%) are technically correct, it just depends on what they are referring to.
On the one hand, this means that we are now almost half way to the Australian Government’s current target of 82% renewable electricity by 2030. However, even if we do make that target it means that we are still less than one quarter of the way to decarbonising Australia’s energy supply by 2050. That leaves a huge gap between 2030 and 2050.
If that gap is to be made up of wind, solar and hydro alone then it would mean having to install and connect nearly 10 times more generating capacity (with associated storage) than we have in 2025. This will be a truly mammoth undertaking, noting that between now and 2050 the earlier solar and wind installations (and associated battery storage) will need to be replaced up to two times.
My next instalment is Australia’s Energy Resources – Where our “Power” Comes from.