This is a particularly important blog for Australians. It is time we learnt about our land and just what happens in Australia.
Earth Systems and Climate Change Hub provided a big red flag and some fascinating insights into Australia’s total carbon budget from 2010 to 2019. The ESCC Hub is funded by the Australian Government’s National Environmental Science Program and feeds data into the international entity the Global Carbon Project. Carbon budgets provide information and data to inform and raise awareness about how the world is tracking against the global climate change mitigation challenge.https://nespclimate.com.au/wp-content/uploads/2021/06/ESCC_Global-and-regional-carbon-budgets_Brochure.pdf
Good News: Australia was almost carbon neutral for the ten years from 2010 to 2019.
We only emitted 0.1% of the carbon dioxide added to the atmosphere worldwide over that 10-year period. It is our wonderful natural land that acted as a giant carbon sink squirrelling away almost all the carbon dioxide we produced. The situation varies from year to year depending on weather conditions and our actions.
Yes, we can save our biodiversity and do our bit to fight climate change at the same time. Indeed, we must do so.
Bad News: bushfires produced half the carbon dioxide.
In many parts of Australia, when bushfires start, we simply let them burn. Most firefighting is done by an ageing voluntary fire service with little equipment and even this equipment is old and often no longer safe.
Work undertaken, particularly in the Northern Territory, shows that traditional fire management practices work well to reduce emissions. Indeed, our First Nations People earn carbon credits using their traditional cultural practices. Using properly timed cool burning techniques, the carbon dioxide produced by fire is greatly diminished. If these practices were used more widely, great savings could be made in the loss of human life, property, and biodiversity. Indeed, scientific studies have shown that biodiversity can even be improved.
As the climate gets hotter, the potential damage done by bushfire in Australia will increase dramatically unless we do all we can to protect our land from fire and fight fires quickly and effectively when they do start. It has already been shown that access to water bombing helicopters can result in fire being stopped very quickly. Timing is critical – the sooner a fire is reached, and action taken, the less the damage. Satellites can now provide the necessary information in real time.
A First Nations man told me recently that Australia spends less than 5% on fire management and 95% paying for the damage afterwards. He wanted to know why we had it so backwards.
We are spending billions of dollars to reduce the emission of carbon dioxide when we produce electricity. Yet, fire releases far more carbon dioxide and has the potential to become much worse. If we stay on our current pathway, we will destroy the ability of our land to be a carbon sink.
Worldwide, natural systems on both land and sea still sequester over half the world’s production of carbon dioxide each year. But there are signs of this slowing. So far, as we have produced more carbon dioxide each year, the natural systems have kept up. We need to be helping natural systems as much as we can, and this is particularly important in Australia. Worldwide, the oceans do half of the work and land systems the other half. But in Australia, our natural land-based systems can sequester all of our carbon dioxide.
Figure: The Australian carbon budget, including natural and human-caused CO2 sources and sinks (and their net effect in the atmosphere). Annual fluxes are the average for the 2010-2019 decade. Units are in million tons of CO2.
What should we do with the resources we have?
Upgrade our fire fighting ability with quicker, scientifically backed fire fighting techniques. A stitch in time saves nine and saves lots of human lives and property, carbon emissions PLUS our precious BIODIVERSITY.
Use the best sources of energy. Ask: Which power systems impact the least land area, are low carbon, use the least materials in their manufacture, and can be used to make steel and bricks and cement?
Australia is dotted with pit lakes from mining activities. Many of these pit lakes may be suitable as a source of water for water bombing in regional areas.
Here are 8 good reasons. Most of this post comes from a simple pamphlet I recently put together.
Nuclear Saves Habitat, Jobs and Farming Land
We could be replacing coal-fired power stations with Nuclear Power on the dirty old coal sites. A high proportion of the skilled workforce could be retained with decent salaries. Current transmission infrastructure would replace the need to build new transmission lines, saving money, resources such as copper while saving even more habitat and our best food producing soils.It is our land and its habitat that is sequestering most of the carbon dioxide that Australia produces. See my 2 previous blogs for more information.
2. Nuclear Power is a Low Carbon Energy Source
3. Nuclear Power is Safe
Nuclear activity and its ionising radiation are part of the natural world and were there when life began. Biology had to learn how to live safely with low and moderate levels of radiation. Otherwise, it would not have survived. The problem is with neither the physics nor the biology but with ourselves. While like all animals we are naturally protected and have no need to worry about immersion in moderate radiation, we have learned how to build instruments and make measurements that scare us. We put regulations in place that are designed to protect us from risks that nature has already covered.- Wade Allison Nov 2023
The Cellular Changes Needed To Initiate Cancer Have Not Been Observed at Low Dose Rates. At least 6 to 8 of specific cellular changes must occur for cancer to result. The “Hit Theory” of DNA mutation as a cause of cancer is way out of date and not applicable.
4. Nuclear Waste is the Power Source of the Future
We do know how to bury it safely for ever – Nature has shown us how and some countries are doing so now. BUT, what a waste!
5. Materials Needed to Manufacture Power Systems
The metals used in solar and wind power and transmission lines are becoming scarcer. It takes more than a decade to open up a new mine but we do not even have enough mineral resources to build the first generation of renewables. Recycling is very energy inefficient.
Recent evaluations of all the materials needed for the Energy Transition indicate a shortage of many materials. We do not even have sufficient minerals in the ground- Simon Michaux. We must be careful with all the resources we have whether minerals, money, or biodiversity. We must never forget how much nature is doing to look after us.
6. We Need to Decarbonise More Sectors Than Just Electricity
7. The Energy Produced from a Power System Compared to the Energy Used to Produce that Power System
Until a solar farm can produce enough energy to make itself again, it shouldn’t be called renewable. If it takes too much energy to make and use a power source, it is not a viable long-term solution. Most calculations of money or energy costs do not include all of the system costs.
Why does Nuclear Power have such a high EROI? ANSWER: Because of the orders of magnitude higher energy density of the fuels it can use such as uranium and thorium.
8. The Future
When should Australia introduce nuclear energy? Are we Australians ready yet? The false fear of radiation has even slowed our ability to even look after our low dose waste from research facilities and hospitals to a ridiculous extent. Most of the cost and time delays that effect the building of nuclear power plants around the world do not arise from the reactor itself but from ordinary engineering works. Australia’s recent history with big infrastructure projects including Snowy 2.0 is not impressive. It seems many big projects have very big cost and time overruns.
However, the first stage of the process will take time that we shouldn’t waste. Stage One involves removing the current bans both nationally and state by state. By the time we finish this first stage, we will be in a better position to judge what to build and purchase.
Wish to learn more? See early posts and become a subscriber.
Decades ago, I worked as an environmental scientist based in Hong Kong. I still stay in touch with some of my staff, who now are very experienced in their careers. I had heard that Hong Kong people were being warned about buying seafood, particularly seafood from Japan due to the release of water from Fukushima. I received an interesting article yesterday and quote from a section of it in the original Chinese together with the translation. I have omitted the first paragraphs. The references vary in their language but Note 2 is in English.
I jump to the last paragraphs examining the above 7:30 report.
“Of course, you can still argue that the Japanese figures are fake. Then you can also check out Korean news. According to Yonhap news yesterday, the South Korean government has conducted emergency radiation tests at 30 points in the sea after Japan discharged nuclear waste water last Thursday, all samples met safety standards, and so far no radiation has been detected in seafood or imported seafood in South Korea. (Note 2)
In fact, South Korea has never believed in Japan, or even the International Atomic Energy Agency, so since July, South Korea has done its own water quality monitoring at 200 ocean points, and Japan is not welcome. But strangely enough, China has not joined the monitoring ranks like South Korea, just insist on scaring ghosts and doing “big internal propaganda” in mainland China and Hong Kong, letting writers like “financial writers” spread false information, lest the world will cause panic.
“So we can assume” that the central government is playing a big game of chess, aimed at “teaching the Chinese people a lesson in popular science”, guiding the public to snatch up Geiger counters that test nuclear radiation, and then looking back to discover that their own home’s radiation is more than 900 times stronger than Tokyo (note 3) – perhaps China’s building materials problem – the reason behind it is too heartening.”
As expected, the South Koreans have not been able to find fault with seafood or seawater. One has to question the motives of countries who spread fear about radiation when these same countries build and sell nuclear power plants. Is it a question answered as it so often is “Just follow the money trail”?
The International Atomic Energy Agency (IAEA) was created in 1957 in response to the deep fears and expectations generated by the discoveries and diverse uses of nuclear technology. The Agency was set up as the world’s “Atoms for Peace” organization within the United Nations family. From the beginning, it was given the mandate to work with its Member States and multiple partners worldwide to promote safe, secure and peaceful nuclear technologies.
The IAEA’s headquarters are in Vienna, Austria. It also has two regional offices located in Toronto, Canada (since 1979) and Tokyo, Japan (since 1984). The Agency runs laboratories specialized in nuclear technology in Vienna and Seibersdorf, Austria, and in Monaco.
Due to the involvement of both my husband and I in the regulation of uranium mining in Australia, we have a few friends who have worked for the IAEA in the laboratories and in the cleanup of mining areas in parts of the old Soviet Union. One of them had his office across the corridor from the man most responsible for the data on Chernobyl. David did a short consultancy in the Vienna offices. The scientists of the IAEA take their responsibility for nuclear safety very seriously and come from dozens of nations.
When Japan proposed the water discharge from the Fukushima nuclear plant, the IAEA examined the strategy very closely and gave its blessing but insisted that the discharge be monitored very carefully. Japan gave itself a tough standard of 1500 Bq/L knowing that the WHO standard for drinking water was 10,000Bq/L. A lot of data is available online which I have viewed. It is possible to see the data for every tank on site. Some of the tanks containing water cleaned up early in the process contain a fraction too much caesium isotopes. This water will be cleaned up again before release. The IAEA has a website that shows the monitoring data during the discharge in real time.
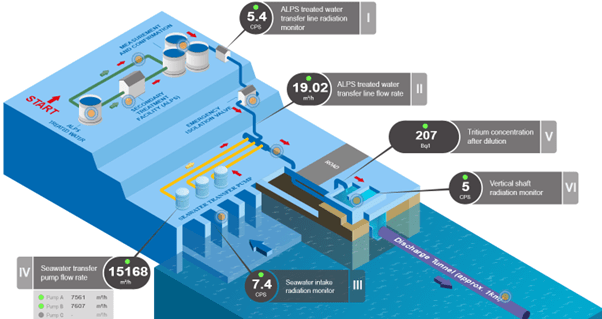
A snapshot in time (as I am writing) is shown below:
Green dots show that the data indicates that everything is OK. A red dot would indicate that the nuclear company, Tepco, should take action. A grey dot shows that a pump is not operating.
The water after dilution is shown as 207 Bq/L, way below the level Japan set for itself and only 2% of the WHO drinking water standard. It is about this amount each time I looked at the data.
What fascinated me was that seawater has slightly more radiation than the treated water as measured in cps. Although details are not given, Geiger type counters probably do not pick up tritium as the beta rays are so weak. These measurements are used to ensure other radioactive elements such as caesium are not being discharged. As the data shows, the levels in both the treated water and the seawater are very low.
In my last couple of posts, when trying to picture what enormous numbers mean, it was shown that 3 big teaspoons of natural rain falling on my head in Australia would contain about a million tritium atoms. This sounds really scary but as I will gradually show, it is of no concern. Washing our hair would increase the amount.
Tritium forms in our atmosphere every day when cosmic rays hit gases in the air, mostly nitrogen. It is washed down into rivers and streams to the ocean as well as falling directly into the ocean. Tritium forms a minute part of the background radiation that surrounds us always. Life evolved on Earth at a time when background radiation levels were 5, maybe even 10 times higher than today. All life with its complex biochemistry deals with low radiation levels so well, that there was never a need to be able to sense radiation and hence avoid it.
Tritium is even less dangerous than most sources of ionizing radiation. It gently sends out low energy beta rays. Too much of anything can kill us. High dose radiation is dangerous, and we need protection from it. The bigger the ray particle and/or the energy involved, determines just how harmful various forms of radiation are. Tritium’s beta rays are low energy electrons. It has a half life of about twelve and a half years. The rays are so weak, they cannot penetrate the skin. If swallowed most of it leaves as water in our urine within a day or so. If tritium water vapour is breathed in the World Health Organisation standard for drinking water is 10,00, it leaves again within minutes.
This is an ironic look at statements made out to be scientific fact. Most of the fear about radiation is not true and certainly not scientific fact.
I am still scared! A million sounds such a lot!
If you read my earlier posts on tritium, you may recall that 1 TU (Tritium Unit) is one tritium atom in 1018 hydrogen atoms. This is far smaller than one person among all the people on earth. You need to visualize one person only on as many planets as there are people on earth all with similar populations as Earth. Three big teaspoons of water contain 12*1023 hydrogen atoms. One million in 12*1023 is equivalent to 1 in 1018. It is mind boggling small.
Australia receives between 2 and 3 TU in rain falling on our land. 1TU is equivalent to 0.118 Bq /L of water. One becquerel (Bq)is defined as the activity of a quantity of radioactive material in which one nucleus decays per second. The World Health Organization standard for drinking water is 10,000 Bq/L. To reach the same levels of radioactivity in 3 big teaspoons of our rainwater you would need to drink about a quarter of a million litres of water in one day. Whoops! A small fraction of that amount of water as just H2O would kill you.
The human body has 30 to 700*1012 cells. Another enormous number.
So single strand DNA breaks occur naturally in the whole human body over 1016 times a day. This is another enormous number. Our bodies repair this damage.
These slides have been taken from a talk I gave to a group of CSIRO alumni.
The message is that the radioactivity associated with the Fukushima discharge will not harm anything physically. Fear may cause damage to many livelihoods.
The final step: making sure to put numbers in their right context. Are we looking at the whole picture? What works for some people may not work so well for others.
There is a tremendous amount of excellent technical information about radioactivity on the web, but it is often hard for anyone without that specific training to understand. There are also a lot of misleading statements and conclusions on the web. These even appear in peer-reviewed scientific journal articles such as the Chinese paper given as a link in my blog Tritium Trivia. This paper showed the results of modelling various releases of tritium water from Fukushima. Unfortunately, the last step was forgotten. Showing great expanses of red all over the Pacific Ocean would lead nearly everybody to say “How terrible! Japan is polluting the Pacific Ocean with radioactive material.” However, at the end of the document the background levels of tritium in the Pacific Ocean are quoted and this puts the release data into perspective. But nowhere in the paper was the context of the data given, that is that the levels of tritium were so low compared to normal background levels that they would be impossible to distinguish from the background variability.
I have made the decision that I will try to make my blogs as easy to read as I can so that they are suitable for most users of the web. This is not easy with technical information and my background of writing technical reports. Word has an editor function that allows you to calculate the readability of the document. Yesterday, for the very first time I managed to achieve my goal.
I was so excited that I quickly finished the blog and published it only to realize within minutes that I had forgotten a crucial step. I had jumped to the conclusion too quickly and not fully put the information into context. I rapidly edited the post and republished it. However, my subscribers received a set of comments that were not quite right. In my joy of finding a way to explain just how low tritium levels can be, I forgot just how many hydrogen atoms are in a little water. 18 g of water (one mole for the technocrats) contains 6*1023 molecules of water, 12*1023 hydrogen atoms and about a million tritium atoms. This is still just as teeny in radiation terms but the numbers 1 and a million sound so different. 1TU is only 0.118 Bq/L. I will explain what this means in future blogs.
I apologize to my subscribers. At my age you are allowed to call it a senior moment. However, I suspect that in our current haste over climate change mitigation, we are all making similar mistakes. We do the first part of the work but then forget to really look at the big picture and put everything into context.
We all have trouble looking at very big or small numbers and understanding their size and importance. I am one of those lucky people who have less trouble than most. This has had its downsides too. As a child I loved mathematics and algebra. I saw the patterns in numbers easily and it was all a big game to me until I was bullied at a small country school for being different. I was tied to a post, day after day, mocked at, spat at, and even pummeled with food scraps.
Now I am a senior, maths is not so easy, but I will try and make some numbers about radiation levels easier to understand.
Tritium is a natural substance.
Tritium is formed in minute quantities every day in our atmosphere. Cosmic rays from space hit the gases in the air, mainly nitrogen, forming tritium. Tritium is a type of hydrogen atom with 2 extra neutrons in its nucleus. Tritium quickly becomes part of a water molecule. Instead of a water molecule with 2 atoms of ordinary common hydrogen with one atom of oxygen (H2O), a few molecules of water are HTO. The chemistry of both is virtually identical. The mixture comes down as rain.
Just how many water molecules have tritium in them? Well, this is where the big and little numbers come in, making the situation hard to visualize. A new unit was created to help scientists assess the meaning of various concentrations. 1 TU or tritium unit equals 1 tritium atom in 1018 atoms of hydrogen. 1018 is 1 followed by 18 zeros. I find that hard to visualize. Let’s try. There are 8 billion people on Earth, that is 8,000,000,000 people. That is only 8 with 9 zeros. So, we have to imagine the same number of planets as there are people on the earth, with populations similar to earth to be in the right ballpark. So TUs are like one tritium or one person out of all those people on all those planets put together. I still find that hard to visualize, but it does tell me that finding 1 tritium atom in all those ordinary hydrogen atoms looks impossible. Yet scientists around the world can and do measure tritium levels in rain, river and ocean water and ground water. In Australia, ANSTO publishes some of this data.
So how high are tritium levels in rain? It is seasonal and dependent on rainfall patterns. In Australia it is 2 to 3 TU. Most numbers vary from 1 to 10 TU. Nuclear bomb testing increased tritium levels in rain for a time but still at levels in the same sort of range, definitely measurable but extremely small.
So, what does this actually mean? What are the chances of one tritiated water molecule falling on your head? 18 g of water (3 big teaspoons) contain 6 *1023 molecules of water. There would be a million tritium atoms in this rainwater.
Yes, if it rains on your hair, you will get natural tritium in your hair.
Before I write about the mechanisms all life on Earth uses to repair itself from any harm caused by low dose radiation, I feel I must present some information about tritium and the current political uproar about release of water at Fukushima in Japan.
Japan’s biggest seafood customer, China, has decided to ban seafood from Japan, followed by South Korea. New Caledonia has decided to ban swimming in the ocean.
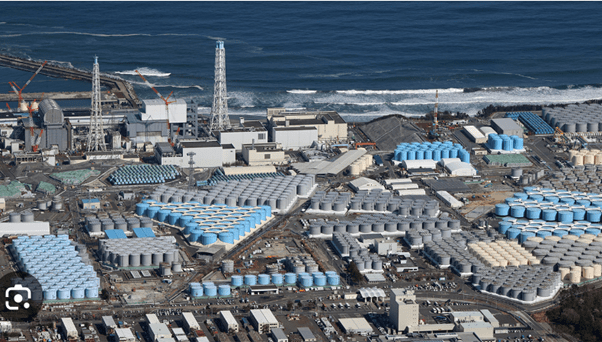
Japan has been storing treated water from the damaged Fukushima nuclear power plants in large tanks. There are about a thousand tanks containing 1.2 million tonnes of water.
Japan has begun releasing treated wastewater used to cool down the nuclear reactors damaged by the tsunami in March 2011. The water has been treated to remove radioactive material, but small quantities remain. Tritium is hard to remove as it forms part of a few of the water molecules. There are very small quantities of carbon 14 and there may be even smaller quantities of strontium and iodine isotopes. Most of the latter were dispersed by May 2011.
Tritium is formed naturally every day in our atmosphere and added to the oceans and land as rainwater. Any taken into our bodies comes out fairly quickly in our urine. Radiation from tritium is weak beta rays. These rays do not travel far and are stopped by skin. Unless the dosage is extremely high, our bodies quickly repair any damage caused.
The release from Japan into the Pacific Ocean can be made to sound bad and scary. “But it actually isn’t. Similar releases have occurred around the world for six decades, and nothing bad has ever happened.
“The radioactivity in the Fukushima water is almost entirely tritium, a type of hydrogen. For scale, the Pacific Ocean contains 8,400 grams of pure tritium, while Japan will release 0.06 grams of tritium every year. The minuscule amount of extra radiation won’t make the tiniest jot of difference. A lifetime’s worth of seafood caught a few kilometres from the ocean outlet has the tritium radiation equivalent of one bite of a banana.” according to Nigel Marks is a Professor in Physics at Curtin University
Tony Hooker, Director of the Centre for Radiation Research, Education and Innovation at The University of Adelaide says: “I would like to reiterate that the release of tritium from nuclear facilities into waterways has and is undertaken world-wide with no evidence of environmental or human health implications. “
Tony Irwin, an Honorary Associate Professor at the Australian National University is also Technical Director of SMR Nuclear Technology Pty Ltd and Chair of Engineers Australia Sydney Division Nuclear Engineering Panel:“There is an understandable perception that all radioactive materials are always and everywhere dangerous, particularly liquid waste, but not all radioactive materials are dangerous. The Fukushima water discharge will contain only harmless tritium and is not a unique event. Nuclear power plants worldwide have routinely discharged water containing tritium for over 60 years without harm to people or the environment, most at higher levels than the 22 TBq per year planned for Fukushima.
“For comparison the Kori nuclear plant in South Korea discharged 91 TBq in 2019, more than four times the planned Fukushima discharge and the French reprocessing plant at La Hague discharged 11,400 TBq in 2018 into the English Channel, more than twelve times the total contents of all the tanks at Fukushima, again without harm to people or the environment.
“It is important that the International Atomic Energy Agency (IAEA) has carried out an independent and transparent review of the procedures and equipment for discharges and its comprehensive report issued in July 2023 confirms that the release will have a negligible radiological effect on people and the environment. The IAEA will maintain a continuous on-site presence on site to independently monitor discharges.
“More tritium is created in the atmosphere than is produced by nuclear power reactors, and it then falls as rain. Ten times more tritium falls as rain on Japan every year than will be discharged. The discharge limit for release of radioactive water at Fukushima is 1/7th of the World Health Organisation standard for drinking water. The discharge is ultra-conservative.”
A paper was published in August 2021 by seven Chinese authors with assistance from authors in the Netherlands, Ukraine, South Korea, and Spain with scary looking figures of their modelling of potential release scenarios by Japan. https://www.sciencedirect.com/science/article/pii/S0025326X2100549X
On closer examination problematic zones were about 0.1 Becquerel(Bq)/m3 of sea water. These scenarios were all assuming much faster dumping of the water than Japan actually plans. The paper itself gives the background concentration of tritium in the surface water of the North Pacific Ocean as around 50 Bq/m3 (0.2% increase, less than natural variation). Good luck monitoring any difference during the release except at the actual release point.
Japan plans to dilute the water in the tanks before release with a maximum concentration of tritium in the release of 1,500 Bq/l. The WHO drinking water standard is 10,000 Bq/l.
The IAEA will monitor the release at various points in the dilution and release system. The data is available at
As I write, the tritium concentration of the discharge is 207 Bq/l. This is way less than the tough standard Japan set itself of 1,500Bq/l. The gamma ray monitoring ensures the water does not contain other radioactive contaminants.
Sometimes I can hold two opposing viewpoints in my head about the same topic. I used to blame this on my birthdate as I am a Pisces. Some people believe Pisces people are best represented by two or even three fish with their tails tied together trying to swim in different directions. I now know the term for this phenomenon, and we can all suffer from it. It’s called Cognitive Dissonance and can arise when our behavior does not match our values or when fears generated in our primitive emotional brain argue with our rational brain.
We have all been fed false fears about low dose radiation since the 1950s. This is sad because these fears fight with the scientific knowledge we have now about ionizing radiation. Nowhere is this seen more clearly than in Japan and Germany.
From a Japanese tourist brochure: Misasa Onsen is an old hot spring with a history of over 850 years. Its spring quality is one of the highest radon contents globally and has excellent healing effects on the body and mind. People have loved it for a long time, including those who come to the hot spring for medical treatment.
“Radon,” which is a weak form of radiation, is produced when radium is decomposed. The body’s metabolism becomes more active when exposed to radon, and the immune system and natural healing power are enhanced. In addition, when inhaled or drunk radon, it increases the antioxidant function and helps prevent aging and lifestyle-related diseases.
Misasakan Hotel pool in Misasa Onsen Japan
Radiation killed nobody at Fukushima, but the tsunami killed about 20,000 people. Yet the press keeps describing it as the Fukushima nuclear disaster.
Germany has more radon baths than any other country. They are also particularly popular in Eastern Europe. There are an increasing number of scientific studies looking at doses and ailments treated. Pain relief from muscular skeletal diseases is well studied.
Despite all their spas which are being used more and more:
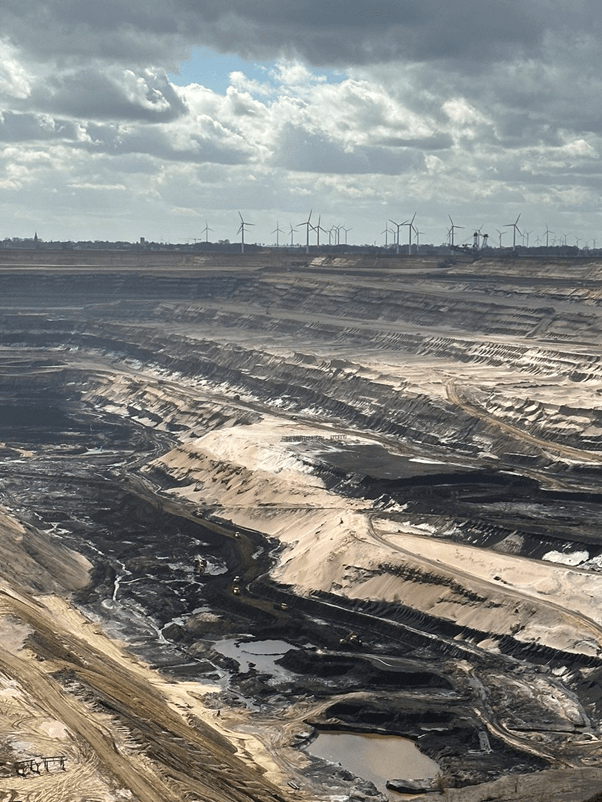
The German Solution – Close Nuclear Power Stations, Knock Down Ancient Forests to Mine Coal.
The figure below shows a proposed mechanism of action when radon is used to treat patients with chronic musculoskeletal diseases (mostly ankylosing spondylitis, osteoarthritis or rheumatoid arthritis).
If you are interested in digging deeper, try this German 2020 review paper about Radon Spas: Radon Exposure—Therapeutic Effect and Cancer Riskhttps://pubmed.ncbi.nlm.nih.gov/33396815/
I have been having so much trouble writing this blog. There are so many people out there who can communicate in a clearer fashion than I can. Why would my blog make any difference to a world that needs so much help? Both you dear reader, and I need to remember that if we even educate or influence one other person, we have helped to change the world for the better.
It is impossible to share with others everything that I have learnt on this nuclear journey of mine, but I must try. Without nuclear power, we will find ourselves going back to the dark ages which was such a cruel world.
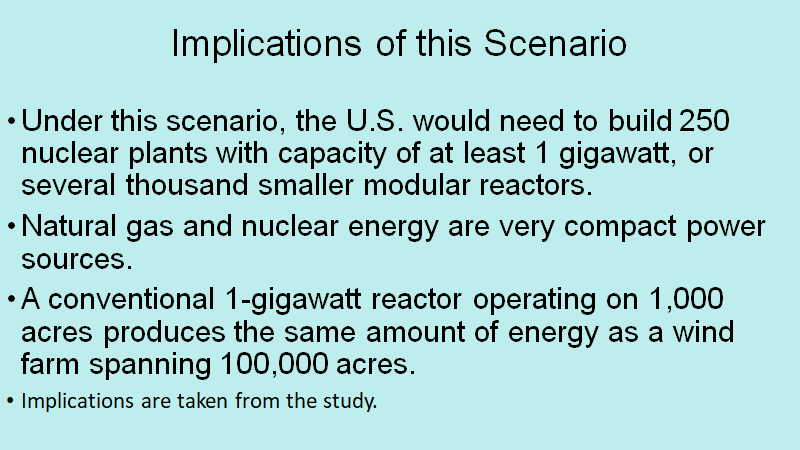
Renewable energy technologies can only take us so far. There are three major reasons for this. The first is energy density. Wind and solar power cannot provide enough energy to both manufacture themselves, mine the materials they require, recycle some of their components and still produce electricity for other purposes. Nuclear can. Secondly, the resources to make enough wind and solar for both the developed and the developing world don’t seem to exist. Basic physics ensures that the energy required to completely recycle components is enormous.
Finally, the land requirements for wind and solar are huge but not impossible. Unfortunately, to find enough land, we destroy or badly harm biodiversity of all types including forests, wetlands, mangroves and our precious and diminishing arable soils. Nuclear power requires less space despite the stupidity about radiation caused by fear.
Nuclear Now is a 2022 American documentary film, directed and co-written by Oliver Stone. It is a film that I would like everybody to watch. It is very long film and really has too much information for one sitting. I have provided a link to the film below. Do make use of the link while it still works.
There is also a book that I would love everybody to read. Jack Devaney makes some points that I believe should be considered by regulators in every country. The book is finally available as a paperback from a number of sources. It is a big book but even reading the beginning chapters and the final chapters is more than worthwhile.
The book is not as negative as the title “Why Nuclear Power has been a Flop”suggests. The book supplies many fascinating insights.
“Jack Devanney is the principal engineer and architect of the ThorCon molten salt reactor power plant. Since 2011 he has pursued his idea of using shipyard construction technology to mass-produce safe, inexpensive power plants that can bring the benefits of electricity to all the world, with no CO2 emissions. He married the advanced nuclear technology developed and demonstrated by Oak Ridge Laboratory with his own engineering experiences with ships, power plants, and energy.” – Amazon.com
Jack also speaks on Decouple and has lots of information and fascinating ideas on his Geordian Knot News. http://jackdevanney.substack.com
Low dose radiation has harmed few people, but the fear of radiation has killed thousands. I will back up this statement in future blogs.
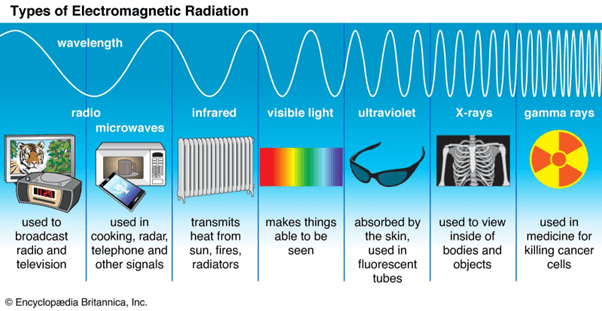
Why do we fear radiation? Is it because we can’t see it, we can’t smell it, we can’t hear it? Yet many types of radiation are all around us and have been since the beginning of life on earth.
There are most types of radiation form a spectrum, yet evolution has only provided a very narrow window for our senses. We often call this window the visible spectrum, the colours of the rainbow, the light our eyes can see. Yet, if it was so important for our health that we needed to avoid all forms of radiation, why hasn’t evolution given us the tools to measure its intensity?
Advances in man’s technology have now provided the tools to measure the smallest amounts of low dose ionising radiation, tools such as Geiger counters and scintillation counters. I used scintillation counting extensively when I worked in biochemical and medical research.
We now know that our planet is bombarded from space by cosmic rays every day. The core of our planet is radioactive, and this helped to make life on earth possible by making the planet a little warmer. No matter where we live, radiation comes from the rocks below us. It is in the food we eat and the water we drink. The background levels in some places on earth are much higher than those in Australia.
Potassium is very important for the health of our bodies. All of this potassium contains a proportion of the radioactive form of potassium, potassium 40. So, every time we eat a banana or a potato or indeed get enough veggies or protein in our diet, we take in potassium 40.
Uranium, a word that puts fear in many people’s hearts, is absolutely ubiquitous in our world. It is everywhere. At one stage of my career, I had a team of people and a laboratory truck that travelled all over the Northern Territory sampling streams and ground water. The lowest concentrations of uranium we ever saw were in waters downstream of Ranger and Jabiluka mine sites. Our radiological standards in Australia are pretty tough but even so the drinking water standards are tougher still. Uranium is far more dangerous as a heavy metal then as a source of radiation. Heavy metals do damage to our kidneys.
Instead of protecting us by making ionising radiation visible to us, evolution has protected us with biochemical mechanisms that prevent, and repair damage created by low dose radiation. When life began on earth, the radiation levels were at least four times greater than they are now and may have even been even 10 times greater.
We now know far more about the effects of low dose radiation on people and other forms of life than we do about most chemicals in our environment. I will share some of that information in future blogs.
And since March 2022, more reactors have been shut down prematurely and more countries have started considering or ordering more nuclear power.
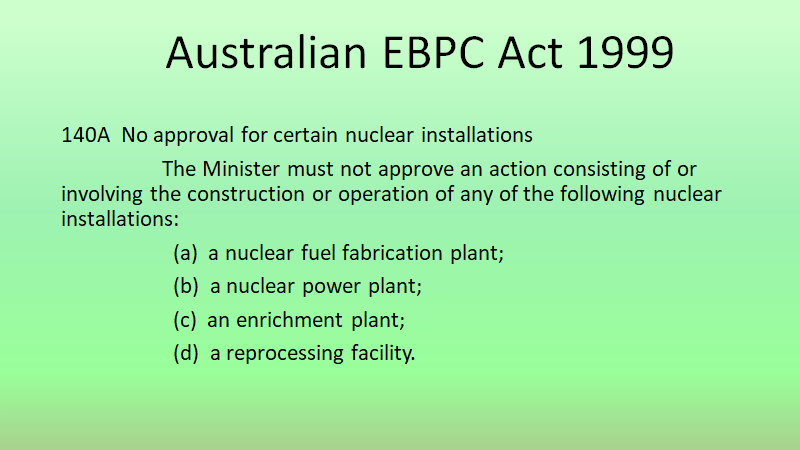
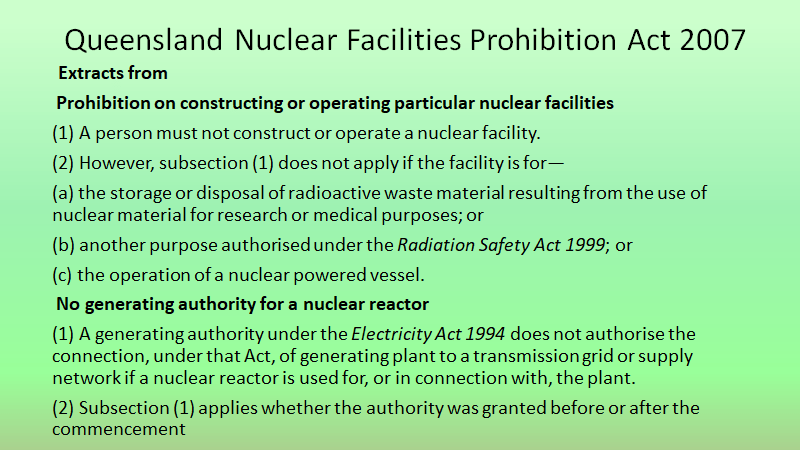
In Australia, it is not possible to have nuclear power without legislative changes. We do have a reactor at Lucas Heights in Sydney used to manufacture radioactive isotopes for medical purposes.
Some polls suggest there are more Australians that would consider or like nuclear power than are anti-nuclear. I have heard that some of the previous Government politicians considered putting nuclear power in their policies for the May 22 Federal elections but were told that the Coalition would lose if they did. I, for one, would have considered voting for them if they had done so. South Australia has recently enacted legislation that allows waste technologies.
Stephen Wilson of Queensland University has a very detailed report that can be downloaded from https://energy.uq.edu.au/research/social-economic-environmental-research under the nuclear subheading called What would be required for nuclear energy plants to be operating in Australia from the 2030s
This is only one of many pieces of legislation that would need to be changed. Several States have legislation also banning nuclear power. The Queensland Act evens tries to push its wishes on other states and the Commonwealth.
Even a small plug and play nuclear reactor would be banned in Qld even if the EBPC Act was changed.
Interestingly, The Commonwealth Parliament has a committee of MPs called “Friends of Nuclear”.
We export a lot of uranium and also have great stores of thorium. It all seems third world to me, we are happy to be a giant quarry for other countries. In some ways, we are making ourselves very energy vulnerable as we don’t have the facilities to manufacture the power plants needed for our own electricity needs. We have to import all the value added parts. I note that the US has decided to upgrade its manufacturing sector to make both nuclear requirements and renewable equipment and is even looking at more mining or at least forming commercial partnerships with other countries that don’t lessen their energy security.
We need MPs, both state and federal, prepared to champion nuclear power and work towards changing our legislation.
HOT OF THE PRESS: David Littleproud, has been elected as new leader of the National Party in Australia. The National Party kept all its seats at the recent election but is part of the coalition that just lost the election to the Labour Party.
David Littleproud has called on Prime Minister Anthony Albanese to “come with the National Party” to lead a conversation on nuclear power. The Prime Minister has vowed to rebuild Australian politics and focus on consensus and bipartisanship.
Later in this last week the new liberal leader, Peter Dutton said he’s ‘not afraid’ of nuclear debate.
In an April, the Institute of Public Affairs asked over 1,000 Australians whether they agree or disagree with the following statement: “Australia should build nuclear power plants to supply electricity and reduce carbon emissions”:it seems 53% agreed with 23% against.
The poll also identified widespread support across party lines for nuclear power:
70% of Coalition voters support building nuclear plants (13% oppose).
52% of Labor voters support building nuclear plants (27% oppose).
44% of Greens voters support building nuclear plants (30% oppose).
“Even more Greens voters support than oppose nuclear power in Australia.”
The poll also identified that more Australians across every age group support nuclear than oppose it:
52% of those aged 18-24 and under support building nuclear plants (19% oppose).
47% of those aged 25-54 support building nuclear plants (25% oppose).
62% of those aged 55 and over support building nuclear plants (23% oppose).
Support for nuclear power generation also crosses income groups:
71% of Australians earning $100,000 and over support building nuclear plants (16% oppose).
55% of Australians earning between $45,000 and $99,999 support building nuclear plants (22% oppose).
49% of Australians earning less than $45,000 support building nuclear plants (25% oppose).
Well after all this, it seems our politicians should be working hard to change our anti nuclear power legislation. Perhaps we need to give them a shove by writing to our local members.
This is the end of the nuclear talks on my blog. I will be writing about the desecration thoughtless implementation of wind power is doing to Australia’s precious biodiversity, agricultural lands and aboriginal heritage in future blogs.
Clearing forests on our Great Dividing Range will worsen climate change through a number of mechanisms, lead to more droughts and floods and destroy our special unique biodiversity.
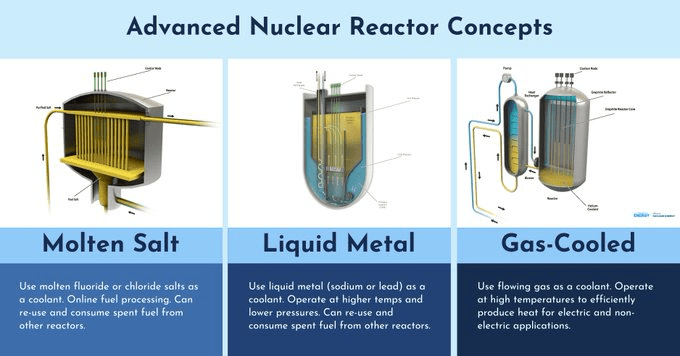
I have not been able to insert some of the videos I used in my talks but links are given. There are now dozens of new designs around the world and it will be a race to see who dominates the market in various categories. In my talks I just gave an overview to provide a picture of the range of technologies and sizes on the drawing board.
Nuscale SMR has been fully licensed in the US and can now start manufacturing its units. It is now listed on the US stock exchange. This is an advanced Gen 3 design. If you are interested in more detail, there is a lot of information on the web.
Some of the front running companies are multi nationals such as GE Hitachi. This is their video on the very small SMR or microreactor, Evinci.
The next slide shows another current product that is too big to be called an SMR. Most of the text in slides is taken from company literature as I am not qualified to make comments on the technology.
The next product is very innovative and known as PRISM
The next video is about the BWRX-300, a design that has been used in some of Nuclear for Climate Australia models.
Other interesting technologies include those of Terra Power.
I note that the first benefit listed above applies to many or perhaps most new designs.
Molten salt reactors
A number of companies are designing and about to build molten salt reactors such as Thorcon in Indonesia, (https://thorconpower.com/0, TerraPower, Natrium, Samsung in South Korea, and in India. Experimental testing of containment materials continues at Oak Ridge National Laboratory in the US and research even happens in Australia with ANSTO (https://www.ansto.gov.au/our-science/nuclear-technologies/reactor-systems/advanced-reactors/anstos-contribution-to). One of the issues experienced withe design of molten salt reactors related to chemical corrosion of the vessels containing the molten salt. I was not surprised that fluoride salts might be very corrosive nut the salt mixtures have evolved, chloride salts would be far less challenging. I get the impression that this issue has been resolved but of course it is under wraps now to preserve various companies’ competitive advantages.
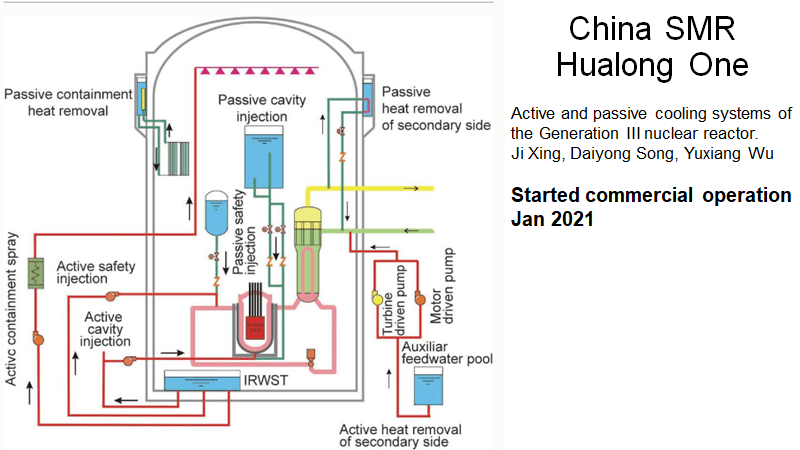
China is producing a number of designs of many types including molten salt reactors and plans a massive building program for nuclear power. Russia’s Rosatom was also interesting but has had a number of contracts cancelled second quarter of 2022. One of China’s designs is shown below. China is currently building a molten salt reactor.
The fuels for Gen 4 reactors can be very different to current fuel pellets. Some of the newer fuels are more like those that have been used in nuclear submarines for many years. Others are completely different like Triso balls or fuels dissolved in molten salt. TRISO particles cannot melt in a reactor and can withstand extreme temperatures that are well beyond the threshold of current nuclear fuels. For more see https://www.energy.gov/ne/articles/triso-particles-most-robust-nuclear-fuel-earth. New designs can make use of so called waste fuel or thorium or a mix.
Some Gen 4 designs use HALEU fuel which has been used by the US military for decades.
In May 2022, Norway-based marine group Ulstein has launched the Ulstein Thor, its concept design for a 149-m (489-ft) replenishment, research, and rescue (3R) ship that will feature a Thorium Molten Salt Reactor (MSR) to generate large amounts of clean and safe electricity. This allows the vessel to operate as a mobile power and charging station for a new generation of battery-powered cruise ships at sea.
These are all fission based reactors but research on fusion based reactors continues and will be viable eventually but not in this decade or two. Fusion happens at extreme temperatures.
Australian Ben Heard has produced a number of detailed videos describing SMRs in more technical detail than I can such as:
Suddenly, after a long hiatus, so much is happening.
It is very difficult to obtain reliable costings for either renewables or nuclear power. There have not been many nuclear power stations built in recent times. Finland’s new reactor is often given as an example of major cost over-runs and delays. However, even at a cost of over 11 billion Euros, it is starting to look like cheap, reliable energy at a time when Germany is paying Russia a billion Euros a day for Russian gas supplies that could be cut off at any time. It also looks cheap compared to Australia’s Snowy 2.0 pumped hydro scheme which looks like blowing out to a similar figure in AUD. The cost of construction for the new Finnish nuclear power plant, 1,650 megawatt Olkiluoto-3, could be 19 Euros/MWhr if the plant runs for 40 years or double that for 20 years.
Worldwide, with the possible exceptions in Asia such as China, very large infrastructure projects are costing much more than estimated. The large concrete pours have been blamed, together with falls in productivity. In the nuclear sector, much of the cost increases have arisen in the administrative sphere, court cases between contractors or even anti-nuclear lobbies, as well as increasing safety regulations during the construction phase which mean design changes and reconstruction. Anyone who has been involved with large construction projects, as I have, knows that the best way to blow out costs is to change designs in the middle which leads to contractor squabbles and works having to be redone.
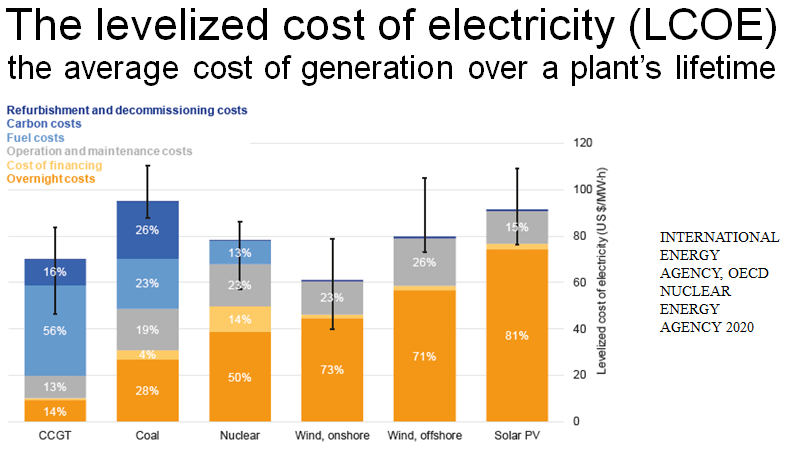
The companies pushing SMRs, which can be factory built, have worked hard to overcome some of these hurdles. By the time Australia changes its legislation, if we do so, we will know the situation. We may also be in a better situation to know the real, total costs of renewables so that costs can be compared on a true basis. There are many comparisons made of costs on the internet. I will include a few of these. Nuscale states that its 12-module VOYGR-12, 924 MWe plant design has a levelized cost estimate (LCOE) is in the range of approximately $40/MWh to $65/MWh in the southern states of the US. Levelized Cost of Electricity (LCOE) is an economic measure used to compare the lifetime costs of generating electricity across various generation technologies.
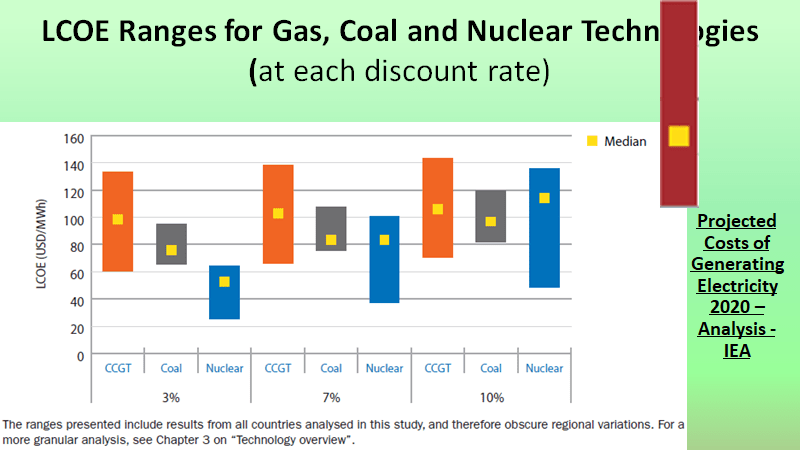
The Nuclear Energy Agency have a fascinating site listing LCOEs calculated on data from various forms of power generation already in operation around the world. (https://www.oecd-nea.org/lcoe/ ) The calculator enables the reader to change some parameters such as discount rate and gas price. At the central case for discount rate, nuclear power is cheaper than wind and solar. At low discount rates, hydro, wind and solar become cheaper. This raises lots of questions in my mind about comparative costs and all the various cost comparison tables I have seen.
The nuclear for climate group (www.nuclearforclimate.com.au) have a great website. Robert Parker and Dr Robert Barr have carefully worked out a scenario for Australia which on their modelling provides stable, reliable electricity for Australia based on the use of BWRX-300 nuclear power stations. These would replace retiring coal plants on the same locations and retain jobs for some of existing workers while creating lots of other highly paid jobs. https://www.youtube.com/watch?v=vQC5ijEieXE
James Fleay has produced a cartoon that illustrates some of the issues associated with balancing the grid. Australia has an enormous grid connecting all states bar Western Australia and the Northern Territory under AEMO. There is currently some discussion that suggests the grid should be split up again on a state by state basis.
The CSIRO has had a draft report out on costings of various sources of electricity production out for a while. The final is yet to be made public. Some of the costings are controversial and may be too conservative for some power sources and too lenient for others. A very difficult task. GenCost 2020-21 https://www.csiro.au › media › renewables-cheapest pdf
Robert Parker uses their data in his evaluation of costs. One of his graphs is shown below. The recent rises in wholesale power prices make all these Australian numbers out of date.
Numbers in red show the carbon dioxide ratings
It is often claimed that the more you build something, the more proficient you become and that this brings down costs. There were very few nuclear power stations built for a few decades, so as in Finland few contractors were experienced. Prices should come down – time will tell.
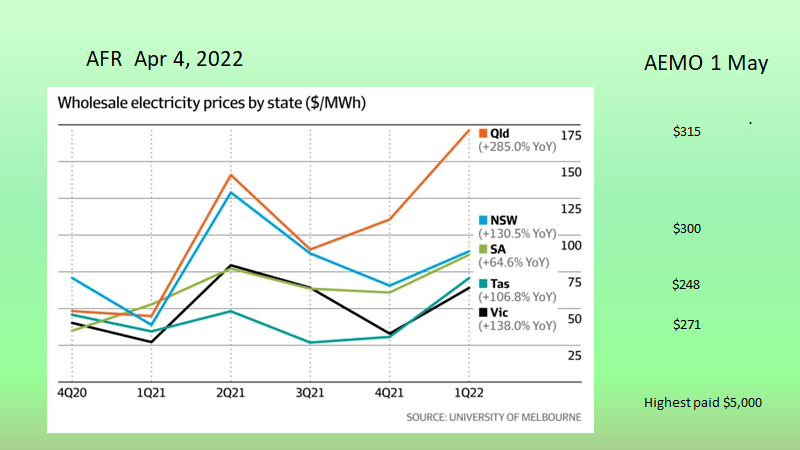
I read many claims that renewables have come way down in cost but are now leveling out. Unfortunately, the cost of using renewables does not include all the ancillary costs – the essential externals such as the extra grid infrastructure costs, battery storage and converters. The CSIRO has tried to take these into account but I found it confusing. The reality is that electricity prices in Australia are rapidly increasing. Wholesale prices rose almost 300% year on year in Queensland by the end of March 2022 as reported in the Australian Financial Review. Yet, by 1 May prices had skyrocketed as shown in the column on the right hand side of the slide below. Queensland had jumped from $175/MWh to $315.
According to an AEMO media release on 29 April 2022 :
“Wholesale electricity prices in the National Electricity Market (NEM) averaged $87 per megawatt-hour (MWh) for the first quarter of 2022, up 67% from Q4 2021 and 141% on Q1 2021, driven by increased demand, coal generator outages and higher electricity-generating fuel costs.” This information is now way out of date and prices in Australia are far too high.
AEMO’s Quarterly Energy Dynamics (QED) report shows that wind and grid-scale solar output increased 743 megawatts (MW) from Q1 2021 levels to a new quarterly record of 4,190 MW, along with increases in small-scale solar (460 MW), gas (271 MW) and hydro (42 MW). Declines were seen in brown coal (304 MW) and also black coal generation (374 MW), which hit its lowest Q1 average in two decades.”
“The average Balancing Price increased by 14% from Q4 2021 to $61/MWh, while the number of negatively priced intervals was down from Q1 2021 and the WEM saw no intervals with a Balancing Price lower than -$100/MWh.”
I have to admit I find the pricing of Australian electricity very complicated. The carbon credit system, RET, auctions, order of purchase etc. make it all very complicated. However there is no doubt that our electricity prices are going up, our coal fired power stations find it hard to mesh in with renewable energy as they are not designed to ramp up and down quickly. This wears out equipment and intermittent use causes the costs of generating power to rise. Coal fired power is base load power. The newest stations are in Queensland and their construction is still in the pay-back period and knowing they are likely to be shut down earlier than originally planned mean they have to increase their prices. Because they are not operating continuously as originally planned this also increases their costs and hence prices.
Gas fired power produces about half of the carbon dioxide produced by coal but because we have contracted our gas overseas, gas prices are high. Gas power stations can ramp up and down rapidly. Combined cycle gas plants are very efficient and score well as compared to most other forms of power generation apart from their green-house gas emissions.
Traditional nuclear power is also a form of base load power and better left operating continuously. It can be ramped up and down 10-20% without problems. The new SMRs are being designed to match with renewables by ramping up and down as required.
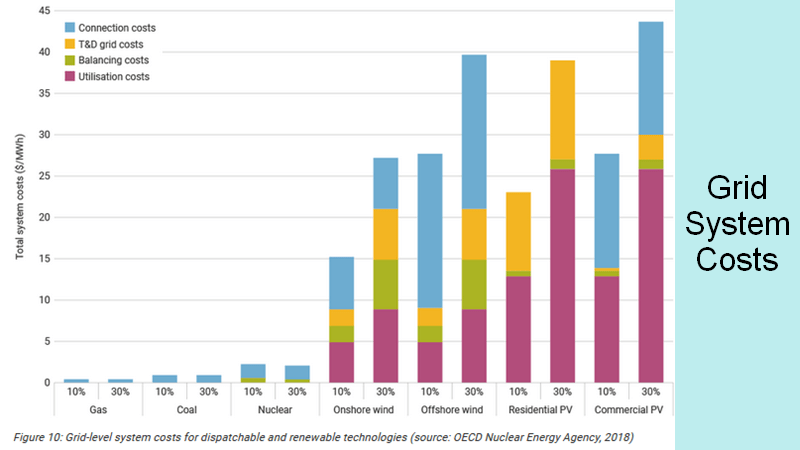
Let us not forget grid system costs. These are added after we build the transmission infrastructure itself. Our new Labour Government in Australia has a huge budget to upgrade our grid to match the needs of renewables.
The dark red bar on the right shows the LCOE for solar farms at a 10% discount rate from the slide showing renewables above this one.
The next slide is hard to read. Unfortunately costings for renewables rarely take into account the extras required to use them effectively. Lazards are known for their costings. The bottom graph shows the LCOEs of various storage systems. The top graph on the slide has been sized to match the bottom scale and shows LCOEs of the power sources themselves. Some of the costs in the bottom graph have to be added to the cost of renewables to make any comparisons valid.
Storage is expensive and requires lots of mining and manufacture. The green house gas production depends on the energy source used. There is already a supply chain issue for materials and this will worsen with the current situation with Russia.
It is often forgotten that we lose energy with each conversion. Battery storage technology is typically around 80% to more than 90% efficient for newer lithium-ion devices. Battery systems connected to large solid-state converters are being used to stabilize power distribution networks. These systems do not store power for use but are used to stop grid blackouts and brownouts. Converting electricity to hydrogen and then back to electricity again is very inefficient. 60% of the energy is lost. Hydrogen needs to be used to decarbonise other processes such as steel manufacture and fertilizer production not used to regenerate electricity.
It is of interest to note how long it takes to start up a mine or build a big coal-fired power station. China is managing to build nuclear power stations in three years. Nuscale Power claims they can do the same.
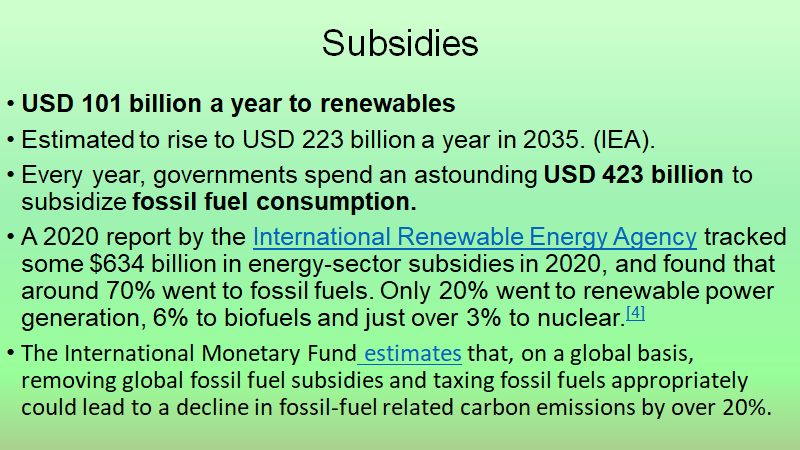
Another cost to energy production which is even harder to ascertain are subsidies.
On Sky News in 2020, Nationals MP Barnaby Joyce said it is important to remember each wind turbine costs the taxpayer $660,000 per year, per tower, due to the government subsidy scheme for renewable energy developments. He was commenting on a $600 million, 77-turbine wind farm proposed just outside of Tamworth.
One of the most confounding issues with wind and solar costings is how to include the intermittancy, seasonality etc. Data for wind suggests that most onshore wind farms only produce somewhere between 10% to 30% of their nameplate capacity each year. In very ideal locations, they may reach 40% as can some offshore wind farms. The latter are more expensive to build and maintain.
This means that the capacity needed to replace fossil fuels with renewables is many times their nameplate capacity and again there seems to be disagreement on just how many times. In every country there are days when the power generated from renewables dives to very little. This means some form of backup power or an enormous, currently not available, battery backup is needed. In reality, the amount of power stored in the big batteries only lasts for a short time, enough time for operators to turn on other sources of power to prevent blackouts or worse, brownouts which are exceedingly costly.
So for every MW of wind or solar there has to be a MW of coal or gas or nuclear or hydro ready, willing and able to pick up the slack, whenever the sun sets and/or calm weather sets in. This requires unnecessary duplication of capital costs.
In every place that has large reliance on so-called cheap renewable power, electricity prices have soared and destruction of the natural environment occurred. Germany is currently clear felling ancient forest to mine more coal. We are starting to do the same silliness in Queensland, clearing highly diverse forest with endangered flora and fauna to build wind farms – releasing carbon dioxide stored in trees and soil into the atmosphere and losing all the other climate change mitigation benefits that forests provide.
Just look at the power generated compared to name plate capacity! 22% for onshore wind, 34% for offshore wind wind, 11% for solar (Australia is a great place for solar but not Europe). This is only 18% for all renewables in Europe in 2021, yet so often all we hear about are the nameplate capacities. This means to really reach the capacity needed to replace fossil fuel power plants with 100% renewables , 5 times the capacity has to be built before taking into account seasonality or peak times and it still may not cover really bad weather
Imagine how many nuclear power stations could be build for 2038 billion Euros. Even at the same cost as Finland’s expensive new power station, nearly 200 Olkiluoto-3 plants could be built producing over 300 GW of reliable power for 40 to 60 years. That equates to over 2,600 TWhr each year or 10% of the world’s electricity while those renewables only produced 69 GW, a fifth of what nuclear would do and that doesn’t take into account the cost of building the renewables and extra transmission lines in the first place.
The Hornsdale battery in South Australia has a storage capacity of 194 MWhr. This provides just enough time for coal fired plants to ramp up if renewable power dips too much. It has paid for itself by charging enormous prices to the wholesale market such as A$14,000/MWhr in Jan 2018, 2 million AUD for a service nuclear does not need. South Australia now has more Big Batteries. South Australia produces about 13,ooo GWhr of electricity each year. Assuming this amount is averaged over the year and the day/night cycle, Hornsdale can provide the equivalent amount of power made in South Australia for about 7 minutes. Of course, this level of electricity would not normally be needed as only parts of the system would drop production suddenly in most instances giving the poor operators more balancing time.
Until recently, I had not questioned the mantra that renewables provided cheap, clean, green electricity. I am not so sure anymore.
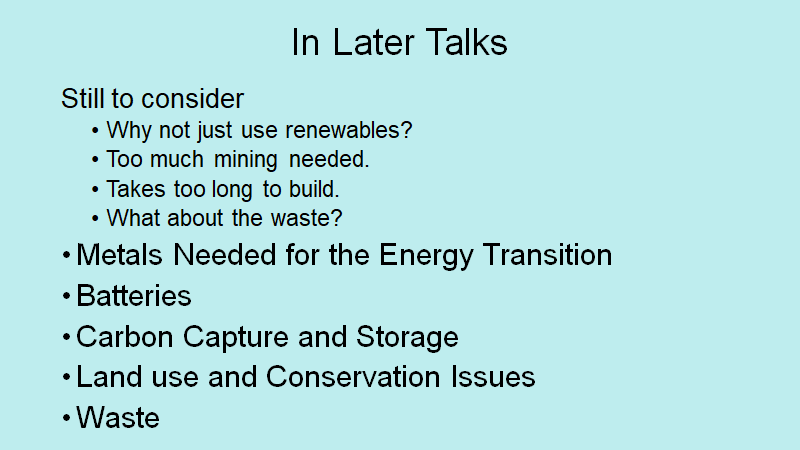
The next few slides summarise some of the benefits of nuclear power. Some of the downside points have already been addressed in earlier sections. More will be addressed within sections of this fourth presentation.
This next slide came from literature we collected during our visit to Sweden in 2009. Vattenfall built, operated and decommissioned many forms of electricity generation in Sweden and other European nations. They undertook lifecycle analyses of a number of “pollutants”. At the time I was particularly interested in their studies on sulfur dioxide. The next slide shows their results for carbon dioxide.
Nuclear power, by their calculations, produced less carbon dioxide than any other power source. I noticed a recent report by Vattenfall looking closely at the fuel part of the data for nuclear power including mining and all the processes to produce the fuel pellets and came up with an even lower life cycle data for nuclear power.
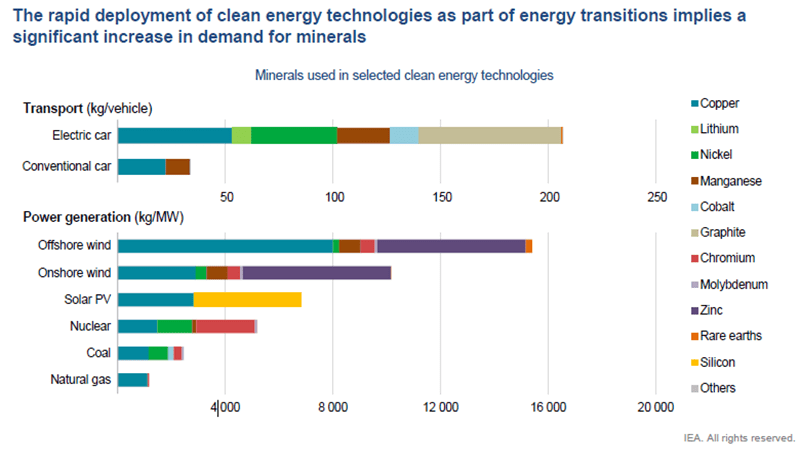
The world uses 25,000 TWh
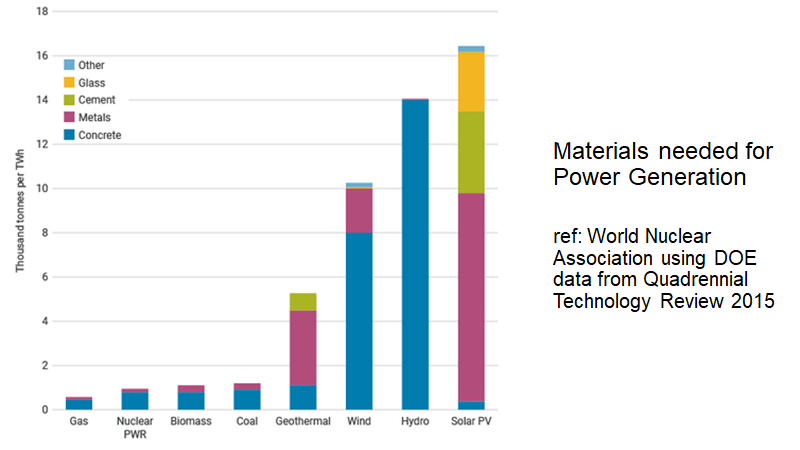
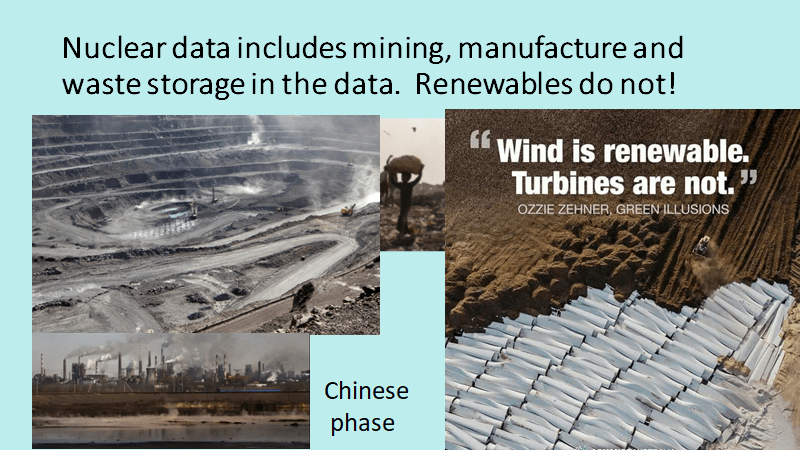
Wind and solar power require a much greater volume of metals and other materials to produce the same amount of power as nuclear energy. There is also all the battery storage and transmission infrastructure required. It is often argued that nuclear power stations take too long to build. What about the time it takes to set up new mines to provide the necessary materials? There are already supply chain shortages for a number of metals.
The new wave of nuclear power will include Small Modular Reactors (SMRs).
The International Energy Agency (IEA) has suggested that we need to speed up the construction of new nuclear power plants if we are to reach the Net Zero Scenario. The dark blue shows the existing nuclear power plants, the light blue area what is planned or should be planned in 2050, while the green shows the quantity that the IEA says we should be building. We need to accelerate our nuclear programs around the world.
Since January 2022, while some nations have been shutting down nuclear power plants, the number of new construction starts has accelerated and many nations are planning new nuclear power plants.
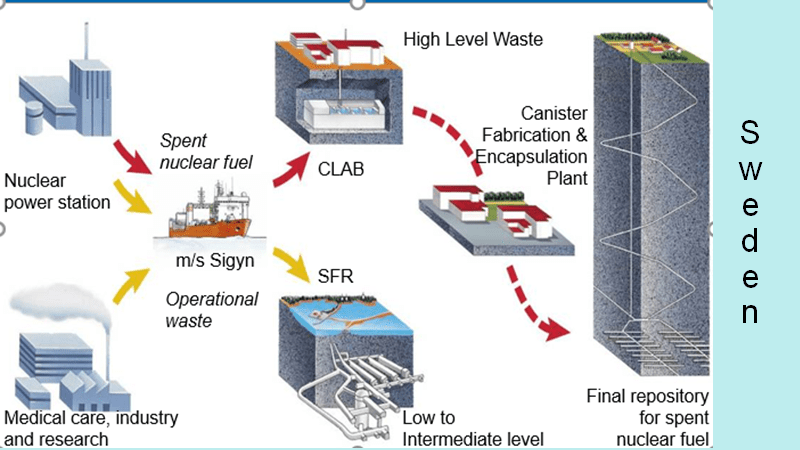
Most of the information in this post relates to high level waste such as used nuclear fuel.
About 2 billion years ago. there were 17 naturally occurring nuclear reactors in the Oklo region of Gabon. Discovered in 1972, these areas have provided a lot of information on the movement of nuclear by-products in various rocks over great periods of time. Sweden in particular has used this information to help design the canisters and long term storage surroundings for their nuclear waste.
The EU decided that deep repository storage should be the ultimate graveyard for high level waste. Once sealed these repositories can be entirely forgotten. They do not need further human intervention of any kind.
Most high level waste is still above ground as it is initially thermally hot and is either cooled in water or in air. These canisters are extremely robust and safe, one can stand beside them. There are many designs used by different countries. Some of the techniques are described below.
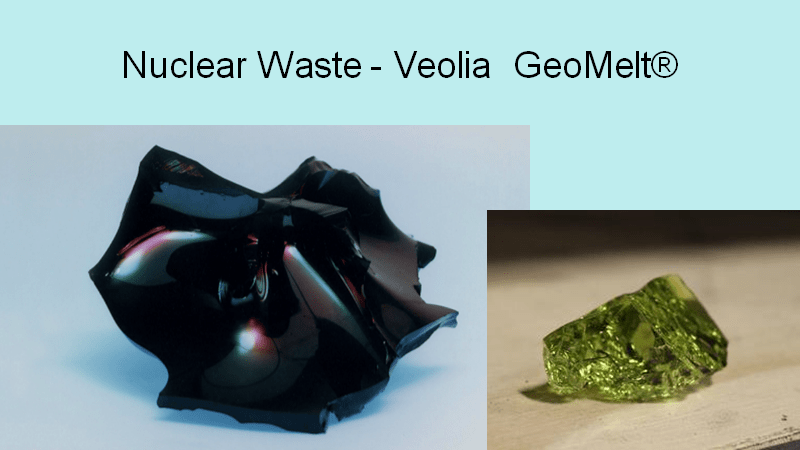
Australia’s ANSTO has produced a similar vitrification process and improved it over several decades. The technology is sold to others. One of the interesting uses of the Veolia process is to trap or destroy nasty, toxic organic wastes while entombing nuclear wastes.
The next few slides come from a talk I gave on Sweden’s nuclear industry a few years ago. I have recycled some of those slides.
Unfortunately, due to Germany’s influence condemning nuclear power after the tsunami that ravaged parts of Japan, even Sweden started to plan early closures of its nuclear facilities. As a result, the careful planning, including the economics were thrown into disarray. A large amount now has to be paid by the power plant owners in order to cover earlier disassembling of the plants and waste storage. As a result, the price of the power they can offer to the market is now much higher and not so attractive. This has resulted in less power being sold and an even higher tax being placed on the power plant operators. It seems to be the influence of the Green Party in Sweden that caused all the disruption even though they are not the majority party. Recent surveys suggest that most Swedes are still very pro-nuclear.
Copper has been shown to be particularly stable and trap any nucleotides. A gaseous nucleotide in extremely small quantities that can escape as illustrated in Gabon, is fully trapped by a centimetre or so of bentonite clay. In reality, this is a triple level safety concept. Each layer is probably enough to do the whole job on its own.
I was informed in Sweden in 2009, that Finland had decided to copy the Swedish model. It is ironic that Finland have beaten Sweden in finishing the construction of a final repository. Finland’s Green Party is pro-nuclear. I suspect that the long hold up in Sweden was political in nature. Sweden had to wait for years for the final permissions to be granted.
This video was given to me when David and I visited Sweden in 2009. The quality of the medium is not so good but the contents are great! A number of videos follow this one and the sound levels vary considerably. This video is quite loud.
This video has quite loud sound
My husband and I have stood looking at the interim high level waste pool shown in this video. We did not need any type of protective clothing.
Some Gen 4 designs for nuclear power reactors are based on the reuse of the so-called waste fuel. Indeed, there have been pleas to not make the waste too hard to access again by nuclear companies.
This video needs sound turned up louder. The sound level is low.
Sellafield waste reprocessing facility is closing down.
This next video is an excellent one explaining about Finland latest additions to their nuclear portfolio including their deep nuclear waste repository.
Delft University has examined the supply risks for the EU
The EU has set up some technologically advanced recycling centres. But if we look at where most of the waste is going, at this stage we have to assume that little recycling is actually undertaken. The most expensive part of recycling is the collection and segregation of waste.
This is a patch of water that you would not want to fall into, unless you had a death wish. Having worked in the environmental field in China, I know that China is doing as much as it can as quickly as it can to clean up the environment. As the population of China and Mongolia become more wealthy, they are not prepared to work under these conditions much longer either.
The recent happenings in Europe are letting us all know that we should not take any of our supplies for granted. Even the biggest cobalt mine in Africa is owned by China.
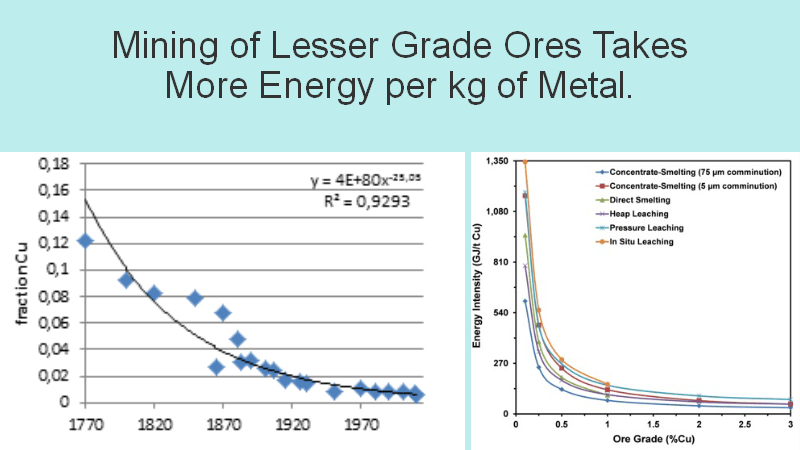
I often read that nuclear power stations take too long to build. Having worked in the mining industry, I also know how long it takes to open a new mine and start production even after the resource has been located and quantified. Over time we have gradually been mining lesser grade ores.
When looking at any of the graphs and data on these complex questions, the questions of what, what type, made where, when, complicate the matter further but the big picture is clear. We are likely to have supply issues if we plan to have massive amounts of renewables built in the next decade or so.
Since these slides were put together, Tesla has already stated that they have supply issues. The waiting period for the purchase and supply of electric cars in Australia is already long. Wind turbine manufacturers are fighting to retain profitability as prices of raw materials fluctuate. Mining companies are loathe to risk capital when the metal market fluctuates as much as it does.
What does this all mean? It has been estimated that hundreds of thousands of hectares of forest have already or will be soon destroyed to undertake the mining needed to provide even a portion of the metals and other materials needed for the renewable industry. This will result in massive loss of biodiversity, and all the benefits the forest provide mitigating climate change. If we’re not careful, this will be worse than a zero-sum game. I have yet to see any estimates of just how many materials will be needed for the amount of wind power and solar power that some countries are aiming to use. In the meantime, the US is closing nuclear power stations before they have replaced the power sources that these stations produce.
Some of the mining needed and much of the waste from renewables will impact heavily on the world’s poorest people. In some ways, this is even worse than slavery, because their lands become badly contaminated with toxic substances that don’t disintegrate in 100,000 years but there for ever. The cost of remediation will probably be too high to ever be undertaken.
Another cost and need for materials arises from all the new transmission infrastructure required, partly because power sources are scattered but also because much of the infrastructure was built many decades ago and needs replacing.
This next slide illustrates what a little ingenuity can solve. Instead of bare burned-out soil, solar farms could be very productive. Rain off the solar panels runs into gutters then storage tanks and used for irrigation. Sunlight and rain can directly pass to the soil. Some shading of the soil as temperatures climb could be very beneficial for some crops. However, it should be noted that more materials will be required for the same electricity production. I have also seen photos of solar panels being placed over irrigation channels in India. In this way, no extra space is needed and loss of water through evaporation reduced.
To to keep up the positive side, please enjoy the following cartoons.
When I first put these slides together, I didn’t fully understand just how insightful Brook and Bradshaw had been. I love the paper because it compared the areas needed for different electricity production technologies and because it suggested that nuclear might have real advantages. I now have a greater understanding of the conservation issues associated with the different forms of power generation and how the siting of the power facilities might not only have an impact on the land area impacted but that it could be critical in terms of the benefit to cost ratios. Biodiversity is important to the survival of this planet. Loss of biodiversity will lessen resilience to changes in climate and our ability to grow food.
The destruction of remnant forest areas in Australia has no excuse on this basis. The cost of building renewable energy sources in forest or on food producing land is enormous. Forests do so much to mitigate climate change. Not only do they store and sequester carbon in the trees, the roots and in the soil beneath, they have enormous influence on the climate itself through the hydrological cycle.
A review published in 2017 by the North East Forest Alliance called Clearing our Rainfall Away by Dailan Pugh can be accessed as a download at
We have known for centuries that clearing forests can reduce rainfall. Australia is a very dry continent. One thing we can all agree upon is that we do not want less rainfall on this continent. Unfortunately, removal of forest can also lead to increased flooding when it does rain.
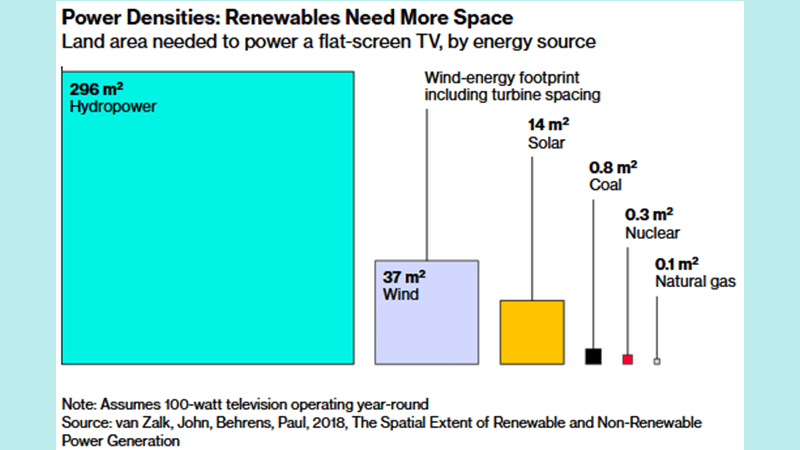
One area that is not agreed upon is the real footprint of land based wind turbines. Some assessments suggest that the only footprint is the size of the base of a turbine. This may be the case for a few isolated turbines on certain types of agricultural land. It is certainly not the case for turbines built in forests. The greatest area of land clearing can be the access roads which as turbines become bigger, become wider and wider. For example, the access roads for the Chalumbin project will be 70 m wide. The total area absolutely cleared to bare ground is about 1200 ha. Further disturbance and fragmentation of the surrounding forest with its critical biodiversity is much greater. Some estimates of wind energy footprints include turbine spacing as shown in the slide below.
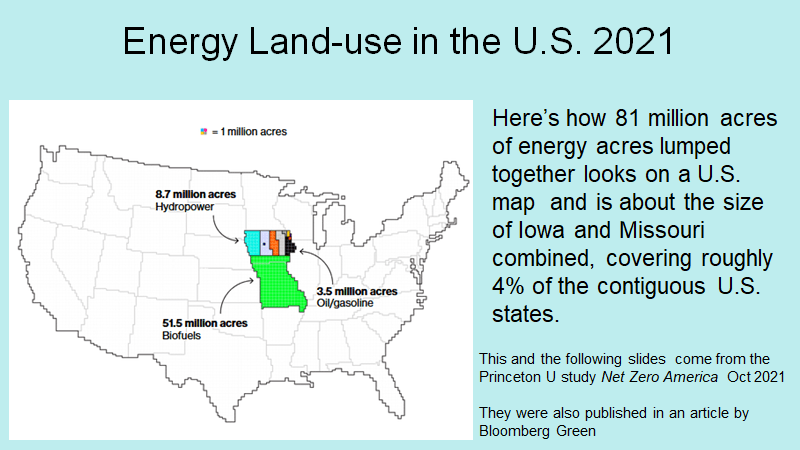
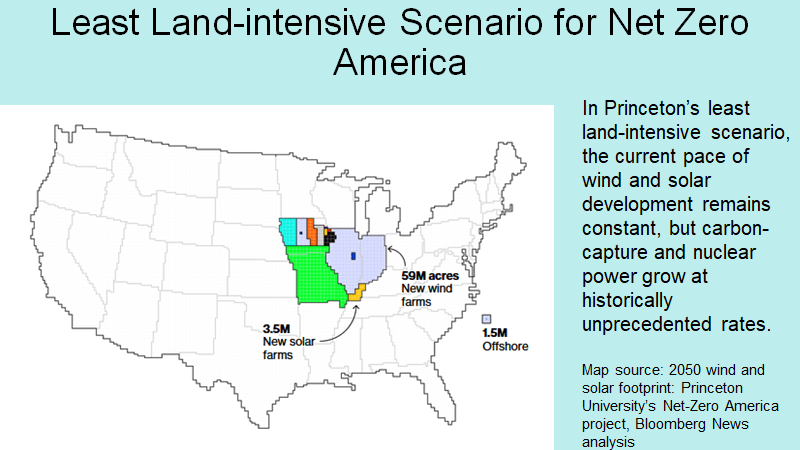
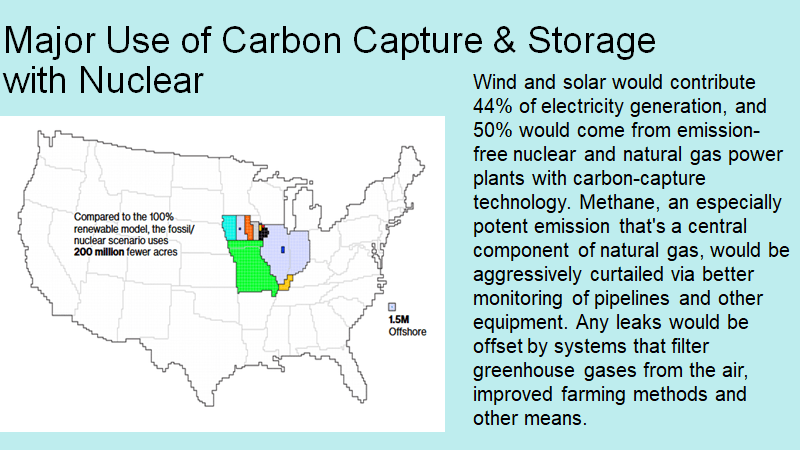
The next slides are based on a study undertaken by Princeton University. The first slide illustrates the area currently taken up by biofuels and other energy related land uses in the United States.
I am not sure whether the data above factors in all forms of energy that may need to replaced in a carbon neutral world. I doubt it.
This slide has been taken from another of my presentations but serves to illustrate some of the issues not taken into account when looking at the land-use areas required by different sorts of power generation. I have not seen estimates of the mining areas required to build wind turbines, nor is final waste requirements taken into account. I am not sure whether the estimates of wind power land requirements only take into account the nameplate estimates of power produced and not actual power produced. Certainly in Australia, it is very common to see nameplate figures for wind power used as if this was the amount of power that would be produced. In reality, throughout the world, wind farms tend to produce 10% to 30% of their nameplate power.
I will discuss some of the points in the slide above in later blogs.
Queensland has a plan to encourage the construction of many wind farms in Far North Queensland in the area where I live. These wind farms are in the water catchments for the World Heritage Great Barrier Reef and in some instances, the streams and rivers run through our World Heritage Rain Forest. Some are planned right next to our World Heritage Rain Forest. I will be writing a lot more about the dreadful loss of biodiversity, aboriginal heritage areas and sacred sites, and tourist jobs in future blogs. Our first wind farm, Mt Emerald, only provides 10-15% of its nameplate capacity. A reason given for siting wind farms up here was the likelihood that the wind will blow when it is not blowing down south. There is no evidence of this so far.
In order to speed up the process, Queensland has chosen to circumvent its environmental processes apart from those of the Federal EBPC Act. There is no requirement to consider the cumulative impacts of all of these projects. Quick calculations of the loss of carbon dioxide to the atmosphere by clearing dense forest compared to the gains of using wind power over conventional power indicate that a considerable proportion of the gains are lost through inappropriate placement. How inefficient and costly!
Renewables need to be sited on already disturbed land but not on precious agricultural land or forest.
Enormous areas of land are, or will be soon, having their planning status converted to heavy industrial use, making it easier for further land clearance to occur in the future. Bare soils are hotter and reflect more heat, they lose soil carbon not sequester it. They no longer retain water. Sounds like desertification.
I am currently trying to understand just how many Australian taxpayer dollars and electricity user dollars are being expended on renewables in my backyard.
Are we getting our money’s worth? All the talk about cheap power from renewables seems to be a myth. The wind farm proponents up in far north Queensland are companies based in other countries. Are we just easy, safe profits? Then there are the costs of battery storage and all the costs of upgrading our transmission system. We import the solar panels and the wind turbines.
On Sky News in 2020, Nationals MP Barnaby Joyce said it is important to remember each wind turbine costs the taxpayer $660,000 per year, per tower, due to the government subsidy scheme for renewable energy developments. He was commenting on a $600 million, 77-turbine wind farm proposed just outside of Tamworth.
Elon Musk is such fun. What a life he leads. I have to like him; he has been saying good things about nuclear power. In one talk he gave recently, he said that we shouldn’t be surprised because sometimes he can be wrong. In 2015, during what must have been his sales pitches for batteries, he supplied information which I have used to illustrate what an enormous task we have before us if we wish to only use low carbon sources of power.
In the last few weeks, the battery in my handheld vacuum cleaner has died after less than two years. In five years, we have replaced the battery in our lawnmower three times. Luckily, two of those occurred in the warranty period. I don’t know how long the giant battery facilities last but I’m sure they will not run as long as nuclear power stations. The capital cost of nuclear is very uncertain at this stage but even assuming the worst, the world could build a lot of nuclear power for US$23 trillion.
The latest nuclear power station to be built in Finland has been a source of ridicule for those against nuclear power. Yes, it wasn’t cheap but on the latest figures floating around, Snowy 2.0 will cost a similar amount of money and not produce or store anything like the power Finland has just added. Indeed, with all the money that Germany is paying to Russia for dirty fuel, Germany could have paid off that new power station in a month.
If every car in the US was an electric vehicle (EV) and they were all used to store electricity from solar power on every household with no other use, only a fraction of the storage needed would result.
In order to produce hydrogen (with zero emissions) a process called, electrolysis. 20 – 30% of energy is lost in the process of creating hydrogen. The hydrogen must then be compressed and stored, losing another 10%. Finally, another 30% is lost when converting the hydrogen into electricity. This leaves you with 30 – 40% of the original energy used.Andrew Lerma of Flux Power (https://www.fluxpower.com/blog/hydrogen-fuel-cell-efficiency-how-does-it-compare-to-lithium-ion)
Hydrogen is very flammable and needs very careful storage techniques. There are very good reasons for producing hydrogen such as helping to decarbonise steel manufacture and for the production of fertiliser. However, it seems to be a very inefficient, wasteful and potentially dangerous method for the storage of electricity.
This presentation was put together last February and in some form or another has been given to various groups a few times now. Between feeling my age and being busy answering questions and giving yet more talks, my blog has been totally neglected. It is definitely time that I finished publishing my first series of talks.
Australia is in the middle of voting for our Federal Parliament and few of the policy speeches from the main parties have mentioned energy policy other than to say we need lots of clean, green, cheap renewable energy. My early talks did not set out to question the use of renewable energy, only to show that nuclear power should be part of the mix. After I finish this series, I will be discussing in more detail just how clean, green or cheap renewable energy is in the form it is being implemented in Australia. The electricity system is very complex and obtaining complete costing data isn’t easy.
With time, it has become abundantly clear to me that many of the graphs used to compare energy sources do not take all the relevant issues into account. Energy storage is an important element in the renewable economy. This next slide shows with an additional bright red box, the extra greenhouse gases associated with one of the renewable electricity sources.
I have included this graph again, as it shows the levels of greenhouse gas emissions from various power sources.
These sorts of graphs take an enormous amount of work particularly when they attempt to fully consider the life cycle of an energy source.
I could not access a full copy of the paper illustrated above and so could not check what all the sources of indirect emissions were. It takes into account all greenhouse gases. The indirect emissions from hydro arise from the production of methane and the breakdown of vegetable matter covered by the water. I would like to see an analysis for the CO2 produced when forests are chopped down to build wind farms.
Despite any variations in the numbers, the message is clear, nuclear power is a very low carbon source.
Another complication that arises when looking at emission levels arising from manufactured products is geographical and technical. For example, what were the sources of energy used during the mining, and manufacturing processes? The graph below shows how different assessments can be.
For example, when assessing CO2 emissions from electric cars, it really matters where the car was manufactured and what source of energy was used during all the stages of mining and manufacture as well as the energy used to run the cars.
You may like to view the video below by Michael Shellenberger: Why I changed my mind about nuclear power.
One of the greatest fears about nuclear power, is that radiation causes cancer. I am currently trying to get a copy of the book “Low Dose Radiation” by Antone Brooks. Dr Antone Brooks served as Chief Scientist for the U.S. Department of Energy’s (DOE’s) new Low Dose Radiation Research Program from 1999 to 2008. The slide below is taken from a presentation he gave in 2014 in Las Vegas. I have many references from other authorities that agree with his group’s research.
LNTH stands for Low-No-Threshold Hypothesis which is still used to set many radiation safety standards but is out of date. It was first proposed using high dose data when nuclear bombs were dropped on Japan at the end of the Second World War over 70 years ago. Dr Antone Brooks has also stated in another recent lecture that fear and excessive radiation protection kills people and is very expensive.
There have been over a dozen studies in Germany, trying to prove that nuclear power plants cause leukemia in children. I did not find the papers I could read very convincing. Then I came upon the study below published in 2007. The study tried to take into account confounding issues.
Something inside me said, this is Germany, and it manufactures many chemicals and plastics. A GP had noticed that a much higher level of leukemia was occurring in his young patients. With the help of Google, I discovered that a new chemical plant had been set up in the area the year before. Again, with the help of Google I found that most of the leukemia cases were much closer to this new chemical plant than to the nuclear power plant. This does not prove anything, but it is suggestive that much more work would need to be done to determine the cause of the leukemia cluster. It certainly left many unanswered questions.
This is not the first time that I have noted that blame is often quickly and incorrectly placed on radiation as the cause of illness. During my time as a regulator for Ranger Uranium Mine, Aboriginals that used a billabong downstream of the mine for food gathering and recreation became ill. The mine was blamed. Careful investigations measured almost non-existent levels of uranium or other contaminants in the water, except for very high levels of bacteria. The source, untreated sewage, was traced and treated and the illness disappeared.
I like the graph above as I can be sure it includes Chernobyl in its data.
The message is clear, nuclear is a very healthy way to generate power.
I tried to answer the arguments against nuclear power in the talks I gave to my local U3A group. I will continue to provide the same material in this series of blogs. I continue to learn more and more about the issues each day and will present some of this information when I have finally finished posting the talks.
The numbers I have seen on the cost of electricity generated by nuclear power plants vary considerably. Conservative estimates are based on the last few nuclear power stations built in Europe and the U.S. Few had been built for nearly 30 years and the costs blew out for several reasons. Firstly, nobody had built one before and it was a learning curve for the engineers. Secondly, regulatory authorities often required small changes in design which held up the works. Lastly, expensive court cases created by antinuclear groups held up the works. These days, every material used in the main parts of the power plants are tested by regulators in special facilities to ensure they won’t break down under extreme conditions. Some of the engineers in the industry believe that the pendulum has swung too far. Every safety element, pump, backup generator et cetera must be triplicated and must work by a different principle. Finland’s latest nuclear reactor which has just come into operation took a long time to build and the cost blew out to $10 billion dollars. It is often used to claim nuclear power is too costly and takes too long to build.
I note that Snowy 2.0 has also blown out to 10 billion dollars and will probably only provide far less electricity than the originally estimated 2000 MW.
France had some of the cheapest power in Europe for a long time. They built the same design of nuclear power plant repeatedly and the price came down as might be expected. It is always more expensive to build a prototype.
In China, however, nuclear power stations are now being built in 36 months or less. They are building several different designs but as each type of station is built again both the cost and the building time has reduced.
I may be wrong, but I note that comparisons between nuclear, renewables and fossil fuel electricity costs rarely take all associated costs into consideration. Extras such as battery or other backup storage, disposal costs, recycling costs, grid costs, loss of arable land and forest, government subsidies, and tax breaks don’t seem to be considered. Lifespan of a facility is usually included but I note that assumptions like nuclear power plants only operate for 40 years is a gross underestimate.
Items mostly left out of the cost comparisons are related to grid system costs.
There are many claims that 100% renewable energy is possible for all countries. The only countries to reach this target have a high percentage of hydro or easy to obtain geothermal power such as Iceland, Norway, and Uruguay.
It may be that modern IT and special algorithms can solve the problems of grid instability, but I see many practical challenges that will need to be solved.
If you are not technically inclined, this blog may not be of interest to you. Some of the first schematics have been presented in earlier blogs but are repeated here for ease of comparison
Canadian nuclear power reactors are CANDU reactors – heavy water reactors developed by Canadian scientists and engineers. CANDU stands for Canada deuterium uranium, because it uses deuterium oxide (heavy water) as a moderator and coolant and uses natural (not enriched) uranium as a fuel. There are 19 in operation in Canada and another 11 elsewhere in the world. India also has 16 nuclear reactors that are based on the CANDU model.
I have included this schematic because it shows other important elements of a nuclear power plant. When used fuel rods are first taken from a reactor, they are both thermally and radioactively hot and must be cooled down. They are placed in a special cooling pool close to the reactor, shown as “used fuel management.”
About a decade ago, my husband Dr David Jones was invited as a guest speaker on uranium mining at a conference in Sweden. We took the opportunity to visit every nuclear facility we could and included all stages of nuclear waste management. I talked them into giving me a copy of the video below which shows some of the aspects of waste handling in Sweden. It is worth watching.
Ultimately, all the energy we use arises from some form of nuclear energy. The Sun’s energy reaches our planet as a result of nuclear reactions in the Sun itself. This energy is critical to our survival on Earth. The sun provides the energy for photosynthesis and hence all our food, wood, and dung. All the fossil fuels were created many millions of years ago from plants that derived their energy from the Sun. Differences in the heat from the Sun hitting Earth at different latitudes drives our climate engine. These differences in heat around the globe creates the wind that drives our wind turbines. Going back in time, it was nuclear reactions out in space that created the elements we find on Earth.
This video introduces the concepts of nuclear fission and can be found on https://www.youtube.com/watch?v=D91T-B-PVE0 if you have challenges making the embedded video work.
All the commercial nuclear power plants (NPP) operating today use nuclear fission as their source of heat energy. Optimism suggests we may be able to use nuclear fusion at some time in the future as an alternative to nuclear fission.
A great deal of energy holds the protons and neutrons of an element’s nucleus together. The heavier elements tend to degrade into lighter elements. Elements close to iron (Fe) in the periodic table are very stable. When elements come apart for whatever reason we call this nuclear fission. Because it takes less energy to hold the resulting smaller nuclei together, a lot of energy is released. Uranium and plutonium have excessively big nuclei and fall apart relatively easily depending on the number of neutrons present. Looking at the periodic table below, the heaviest elements are shaded in yellow, and they are all radioactive. The heaviest elements may only exist for minutes or seconds as they are so unstable. Some of the elements with smaller nuclei have minor isotopes that are radioactive, depending on the number of neutrons in their nuclei.
This schematic works for most types of electricity generation power plants operating today. In the case of nuclear power stations, the heat source is a nuclear fission reactor which creates hot, pressurised steam which turns a turbine. The fossil fuel power plants work in a similar manner. After use, the steam condenses back to water and recycles past the heat source again.
Cooling water is kept separate from the recycling water for many reasons. For example, condenser water, which is cooling water, can be sea water and taken directly from the ocean and returned to it at a slightly higher temperature. Marine life, close to a variety of power stations, is slightly different to that a little further away. In most cases, the slight increase in temperature leads to a greater density of some marine species. Detrimental effects are not found. The boiler water is usually exceptionally clean water with special additives to keep pipes and pumps from eroding or clogging up.
The giant cooling stacks are part of many diverse types of power stations and only emit steam from cooling water.
Even hydroelectric and wind power work in an analogous manner to that shown on the top part of the diagram above. There is no heat source, the power to drive the turbines comes from rushing water or air. There is no need for a cooling system. However, even hydroelectric schemes can have a small impact on water temperatures both upstream and downstream of the power plants.
The energy of the spinning turbines becomes electrical energy by moving magnets within the electrical generator. This short video was cut in my talks and was used just to remind us about electrical units. It has taken from MW vs. MWh: Do You Know Your Electric Units? https://www.enerdynamics.com
Since the beginning of 2022, many countries in Europe are doing a U-turn away from closing down their nuclear power stations to planning new nuclear power plants.
The BWR type reactors work in exactly the same way as shown in the general schematic for a power plant.
Light-water reactors use ordinary water, also called light water, to produce steam to drive their turbines. Water also acts as a neutron moderator that slows neutrons down so more reactions can occur. Water absorbs too many neutrons to be used with unenriched natural uranium as fuel. So, the fuel used is enriched to 3-5% U238. Canada’s CANDU reactors can use natural uranium as fuel, but they are not light-water nuclear reactors. Instead, the reactor water used is heavy water.
PWRs have one more system that circulates water. Water passing through the reactors is separate to that in the circuit that drives the turbines. In order to generate steam efficiently, the “reactor water” is maintained at a high pressure and thus higher temperatures can be reached.
Many people visualise nuclear waste from reactors as a liquid. All highly radioactive waste is solid and contained in fuel rods within a fuel assembly and then kept within further layers of protective containment More details about waste handling is presented in later blogs.
Man has used his brains to make his tasks more efficient for thousands of years. We even invented slavery and it certainly paid off to the instigators with wealth and power. It was the use of coal with the invention of steam driven equipment that finally led to the end of slavery in parts of the world. The invention and the expansion of the uses for electricity have led to a lifestyle envied by those without it. Over the last two centuries, we have moved away from the old-fashioned uses of wind and waterpower. Now we are in a phase of reintroducing the use of wind and Sun power via the generation of electricity. Waterpower has generated electricity for over a century.
We had been moving from low-density fuels such as wood and dung to coal, oil, and gas then nuclear fission. Should we continue to do so?
If we are to decarbonise our energy sources, we need to remember that electricity, as we currently use it, is only a portion of our total energy usage. So, we will need to do much more than simply replace fossil fuel generated electricity with low carbon electricity generation. There is also a second factor, population growth. A third consideration relates to increasing urbanisation and the desire by virtually all the people on earth wanting access to electricity. I have yet to see reliable estimations of just how much more generating capacity will be necessary by 2050. It will be more than double or triple and probably five times more. Five times may still be an underestimate.
As people are drifting into cities all over the world, they are demanding electricity even when living in slum areas. Commentators have stated that these people will steal electricity if it is not made available to them. This is already happening in South America. We have two choices: do the right planning now or face a world of increasing friction and violence.
Why are we planning on decarbonising our world? Well, there are lots of reasons including the chance for some entities to make lots of money. The main reason is illustrated below:
How are we doing? Well, I am sure that I saw graphs for Australia showing that our methane and nitrous oxide levels were coming down and I put the methane reduction down to the reduction in our cattle and sheep numbers over the last decade or so. I cannot find my reference to those graphs despite my attempts at filing the information I have read in the last few months. The recent data for methane emissions show that our levels are rising (IEA Methane Tracker). I assume that this is probably due to fugitive emissions from the Queensland newly developed gas fields.
I must apologise, as I gave the wrong impression at the first presentation of this information at U3A in Atherton. I did not put this information up on the screen, it was only verbal but some of the attendees will remember my statement about Australia’s methane and nitrous oxide levels coming down.
One of the difficulties I have found when preparing my talks is a disparity in numbers between one source and another. However, it is clear that on a per capita basis, Australia emits some of the highest levels of CO2 and methane. Methane is emitted from wetlands and in quite substantial amounts. Worldwide, the fossil fuel industry seems to be working hard to control fugitive emissions and flaring as shown on the slide below. A few more years of data will clarify the level of methane emission as the flattening of the curve may be due in part to restricted travel during the COVID epidemic. Methane is emitted from wetlands and in quite substantial amounts.
The next few graphs come from the International Energy Agency (IEA) website https://www.iea.org/data-and-statistics. It is obvious that the bulk of worldwide CO2 emissions arise from the use of the fossil fuels coal, gas and oil. Gas produces about half the CO2 compared to coal for the generation of the same amount of energy. All the fossil fuels are valuable commodities in their own right for the manufacture of many goods we take for granted in our modern lives. They form the feedstock for so many chemicals, and they are a finite resource. It is such a waste when we just burn them to produce energy. Coal is still needed for the production of steel and a substantial proportion of Australia’s coal exports are used for this purpose. Recent technologies such as the use of hydrogen for steelmaking offer hope for the future.
Nuclear power plants have been producing a steady supply of electricity for over 30 years, but nuclear power has not been used to supply energy for other purposes. Despite the rapidly increasing construction of solar and wind power, again these energy sources are only used for the production of electricity. One of the obvious ways to decarbonise our energy, is to use electricity as a replacement for the production of heat and for transportation. Some public transportation systems around the world have always been electric. Electric trucks have been used in some transport sectors for nearly a century. China has been remarkably busy building high-speed, electric train networks this century.
Unfortunately, some of the EU countries such as France, Sweden and Germany have been closing down some of their nuclear power plants earlier than needed. France has had some of the cleanest electricity in the world at cheap prices, but the push for replacement by wind energy has taken them in the wrong direction. In the last few months, a number of EU countries have taken a U-turn and are planning more nuclear power plants. There has also been a real push to improve efficiency of electricity use within the EU. As can assumed from the graph below, even France produces significant levels of CO2 due to the use of oil for heating and transportation.
Despite the billions of dollars and euros spent on erection of new wind farms, the percentage of electricity produced through wind power has not increased in the OECD countries. Indeed, the use of coal has increased while gas which produces half the CO2 compared to coal has gone down.
The first nuclear power plants were built during a period when safety was not considered as it is now.
When I did my undergraduate degree in chemistry in the 1960s, most of the organic chemistry department personnel were missing an eye. We were not considered true organic chemists until we had at least one labelled mark on the ceiling from an accidental explosion. We used Bunsen burners, naked gas flames, to distill off flammable and often carcinogenic solvents. I knew just what to do when my hair, lab coat and books erupted in flame from burning ether. Big drums were used for the storage of solvents and when the lab finally burnt down, the explosions from each of the solvent drums sent up spectacular columns of black smoke. The Research Laboratory of ICIANZ where I had a holiday job burnt down a year or so after I was there despite the training we received to prevent and extinguish solvent fires.
When I went to the dentist as a child, the dentist gave me mercury to take home for play. I first held a big bar of uranium metal in my bare hands in 1962.
The first safety features for nuclear power plants were just tacked on as an afterthought. I will describe current safety features for nuclear power plants later in my series of blogs. Safety is now designed and built in, made triply redundant and checked and cross-checked by regulators.
Three nuclear power plant accidents are well known. Using some of my slides from my presentations, the basic facts as best I can ascertain them are given below.
Fear caused all the health effects.
Chernobyl was a terrible happening. So many things were wrong including dreadful design with just a thin concrete cover and international coverup following the explosion. Documents are still being written about the details.
Recorded interviews with Babushkas are enlightening. “My friends who stayed away are all dead now and we are still alive.”
Ukraine, the site of the Chernobyl disaster obtained almost half of its electricity from nuclear power plants in 2021. It was planning to build more. I have been presenting detailed updates about the happenings and safety of nuclear facilities in Ukraine during each presentation I do.
In 2008, My husband and I attended an International Mining Water Association conference in Karlovy Vary within the Czech Republic. The U.S.S.R. had pillaged its surrounding countries leaving massive legacies. One of the remediation projects we visited was a uranium mine with contaminated ground water. The rehabilitation scientists presented the chemical data and then took us out to view the works which were in their last stages. In one area there were beautiful, ripe, wild strawberries. I picked a strawberry and illogical fear erupted around me. I said, “You have seen the data, these are perfectly healthy to eat, and I am not worried.” Suddenly, the men around me were trying the strawberries too and they were wonderful.
A friend who worked at the UN International Atomic Energy Agency (IAEA) in Vienna, told me in 2005 that the IAEA had learnt many lessons about how to manage a disaster at Chernobyl. A whole generation of rural farming children grew up without sufficient protein in their diets, eggs and milk being their traditional sources. Fear caused a lot of unnecessary damage. However, these lessons were forgotten or not learnt by Government authorities when a tsunami hit Japan.
Many studies have been published about the incidence of thyroid cancer in children following Chernobyl. A very large collection of thyroid tissue samples was collected from thyroid cancer sufferers. A very recent genetic study has shown that children receiving high doses of Iodine 131 soon after the disaster do have quite distinct genetic damage from that of children diagnosed with thyroid cancer since that time. (References:
Yeager M, Machiela MJ, Kothiyal P, et al. Lack of transgenerational effects of ionizing radiation exposure from the Chernobyl accident. April 22, 2021. Science. DOI: 10.1126/science.abg2365.
Morton LM, Karyadi DM, Stewart C, et al. Radiation-related genomic profile of papillary thyroid cancer after the Chernobyl accident. April 22, 2021. Science. DOI: 10.1126/science.abg2538.)
Iodine 131 breaks down very quickly. The following graph shows its decay curve. Half of it has decayed in 8 days and 99.9% in 80days.
Japan shut down many of its nuclear power plants. After very extensive safety testing and refurbishment, many of these power plants are now back in operation.
Antinuclear campaigners used the following picture with the heading shown on it to frighten people around the world. Yes, it is a graph produced by the National Oceanic and Atmospheric Association of the US (NOAA), but it is not a graph of radiation but of wave heights. It had no relation to radiation levels in sea water.
There is a tendency when people become sick, particularly with cancer, to blame nuclear radiation as the culprit. When I was head of the technical division for environmental regulation in mining in the Northern Territory the outcome of an investigation near Ranger Uranium Mine illustrated this point. Members of the Jawoyn people were becoming sick. They gathered food in a billabong downstream of the mine. The Jawoyn blamed the mine. Extensive monitoring of the food and water showed only very low background levels of radioactivity. The investigations detected dangerous levels of raw sewage contamination. Bacteria were causing the sickness and the situation was soon rectified.
There are other concerns voiced about nuclear energy, and these will be discussed in later blogs.
The decision to end the war quickly by dropping nuclear bombs on Hiroshima and Nagasaki was justified to the world as it was estimated to save up to a million lives. Was it? Probably. About 100,000 Japanese had been killed shortly beforehand from more conventional bombing of Tokyo. It certainly saved the lives of ten thousand Australians close to starvation in Japanese prisoner of war camps.
I was conceived just before the atomic bombs were dropped on Japan and grew up during the Cold War. Nobody was sure what would happen next.
Nobody can argue that nuclear weapons or nuclear weapon testing or indeed any form of war does not harm us all. The United States believes in deterrents. Are they right? Perhaps so. There has not been a nuclear bomb used in 75 years. William Perry believes we must still do all we can to remove nuclear weapons from our world and I agree.
How easy is it to make a nuclear bomb?
It is extremely difficult technically and extremely expensive both in money and energy terms.
In today’s dollars the cost to make enough fissile material runs into tens even hundreds of billions.
What about “dirty bombs”, bombs containing radioactive material. I read a comment from those responsible for clean-up and decontamination that it would be a simple, straightforward process.
Some of the information above came from my notes when I undertook courses from Stanford University online: “Living at the Nuclear Brink” by Dr. William J. Perry and “The Threat of Nuclear Terrorism”. These courses delved into these issues very intensively, but my notes are sparser. Dr. Perry and his associates did not underplay the threats of misuse of nuclear weapons.
Cosmic rays are extremely high-energy subatomic particles – mostly protons and atomic nuclei accompanied by many forms of electromagnetic emissions – that move through space, eventually bombarding the Earth’s surface. They travel at nearly the speed of light.
Cosmic rays are of two kinds: galactic and solar. Galactic cosmic radiation comes from the remnants of supernovas, which are powerful explosions during the last stages of existence of massive stars.
Solar cosmic radiation is composed of charged particles emitted by the Sun, predominantly electrons, protons and helium nuclei. Some of this radiation is continuously emitted from the Sun’s corona and known as ‘solar wind.’ The remainder comes from solar particle events – sudden and sporadic outbursts of electrically charged particles accompanied by electromagnetic emissions that occur when magnetic fields on the Sun’s surface stretch and twist. Like a rubber band, the Sun’s fields can snap, suddenly releasing enormous energy and presenting potential health concerns to astronauts in space. Although rare, strong solar flares can create radio blackouts and impact modern communication and navigation technology on ground.
The Earth is shielded by a magnetic field that makes the charged particles bounce from pole to pole, creating two gigantic donut-shaped belts populated by energetic electrons and protons. This field protects us from most of the cosmic rays. Passengers on aeroplane flights do receive higher doses of cosmic rays particularly at high altitude over the poles.
The background radiation levels originating from rocks in the earth’s crust, vary considerably. There is increasing evidence that people who live on granite areas have evolved stronger repair mechanisms to cope with the higher radiation levels.
Radon gas is the most insidious of background radiation sources. The gas is breathed into the lungs. Radon concentrations can build up to elevated levels in basements and tunnels or even houses built of granite. Ventilation goes a long way to solving the problem.
Potassium 40 levels can be surprisingly high in many foodstuffs such as bananas and potatoes. No harm has been measured from these sources.
There are quite a few different units used when describing nuclear radiation/radioactivity. The table above shows many of these units. Throughout this series, I have chosen to use millisieverts. This unit has both weighting factors for the type of radiation and also uses weighting factors for the tissue affected when appropriate. This standardisation makes comparisons easier.
Most of Australia has low natural background levels at 1.5 mSv per year. Surprisingly high background levels occur in some parts of the world. Many can be as high as 20 mSv per year. Recent studies are showing little evidence of increased cancer levels in these zones. Our cells divide and divide at enormous rates every day of our lives. Errors can occur. These errors are detected during the process of mitosis at several points in the cell division process and corrected by our wonderful biochemistry. It has been estimated that over 10,000 cancer cells are generated in our bodies every day. Our immune systems detect these cells and destroy them with incredible efficiency.
Australians double their exposure to radioactivity using medical diagnostics. A CT scan of the chest or abdomen delivers about 10 mSv. The levels of radioactivity used during radiation therapy for cancer are extremely high but are carefully aimed at the troubled tissue. Methods of delivering radiation therapy are becoming more sophisticated and more targeted.
Much of our knowledge about high doses of radiation and its effects, come from detailed studies of the impact of the nuclear bombs on Hiroshima and Nagasaki. Standards set for acceptable levels of radiation are extremely conservative and evidence is building up that these standards are far too low. Instead of protecting the general public, the standards have caused unnecessary fear and inappropriate actions that led to mental health issues and other health issues.
Statistics from the US show a lifetime risk of having some form of medically diagnosed cancer as 1 in 3 (33%) and death from cancer as 1 in 5 (20%). An acute dose of 100mSv has a cancer risk of only 0.4%. An accumulated dose at this level would be lower still as the body has a chance to repair itself.
I have noted that radiation doses and their effects vary from source to source but they are not dissimilar and the slides shown above provide a reasonable concept.
Recently, five ex-Prime Ministers of Japan sent a letter to the EU claiming children in Fukushima province were still suffering from thyroid cancer because of contamination from the nuclear power plant following the 2011 tsunami. The Governor of Fukushima Province was irate over this and said the information was not based on science. The inflammatory letter was probably based on two viewpoints. Many children had all, or part of their thyroid glands removed because of a large screening exercise for thyroid abnormalities following the impact of the tsunami and now some will need thyroid hormone substitution all their lives. Six of these children are currently suing Tokyo Electric Power Company, the Daiichi Power station operators for damages.
The first signatory to the letter, Koizumi Junichiro, is an advisor to a private organization that promotes zero nuclear power and renewable energy.
The large screening exercise was undertaken on hundreds of thousands of children using a new advanced ultrasound technology capable of picking up a range of abnormalities not usually seen and panic set in. When control screening was undertaken on children in 3 prefectures far from any possible contamination, the same extent and types of abnormalities were found. They did not lead to thyroid cancer. It is sad that so many children were overtreated. A wait and see approach would have been better and not led to further illness.
There is an optimum amount for most substances in biological beings. Too much is toxic, too little can often be harmful too. The optimum range is not the same from organism to organism and can be different at various times. For minerals, the optimum level ranges are often like those in the environment where the species evolved. Does this same concept apply to radiation?
The source of all our energy production is nuclear in nature. The energy of the sun comes from nuclear reactions. Earth heats itself through nuclear reactions which occur deep underground but not enough to sustain life, we need the heat of the sun too.
Every element has a unique atomic number, and this number corresponds to the number of protons in its nucleus. Protons are positively charged entities and would push away from each other very quickly if they were not buffered by neutrons. The mass number of an element is simply the sum of its protons and neutrons. Most of the carbon on earth has six protons and six neutrons to a total of twelve.
Carbon 12 is the common isotope of carbon. Carbon-14 still has an atomic number of six, six protons in its nucleus but eight neutrons for a total of 14. Carbon-14 is a radioactive isotope of carbon.
Hydrogen (H) is the lightest element and only has one proton. Deuterium and tritium are isotopes of hydrogen and contain one proton and either one or two neutrons. Thus, tritium has a mass number of three, one proton and two neutrons. The next element with 2 protons is Helium (He).
If, when an atom emits nuclear radiation, the number of protons in the nucleus changes, the atom changes to another element – the element that has the new number of protons.
Uranium is a metal and one of the heaviest, naturally occurring elements on earth. It is ubiquitous in our environment. It is in our drinking water, in our food, in our soils and in ourselves. When any element is much more concentrated in rocks than normal, we refer to it as an ore.
Uranium has 92 protons. Uranium 238 is the most common isotope and makes up 99.3% with 146 neutrons. It is very mildly radioactive with a half-life similar to the age of the earth itself. Uranium 235 only makes up about 0.7% and is much more radioactive. Even rarer, is the uranium 234 isotope with 142 neutrons.
The slide above shows a version of all the known elements. It is hard to see, but hydrogen (H) is right up in the left-hand corner. Uranium (U) is fourth from the left in the bottom row. All the elements on a yellow background are radioactive. Some of the minor isotopes of the elements on the white background are also radioactive such as iodine 131, potassium 40, and carbon-14.
The video below is an excellent presentation on radioactivity. Please watch it! It leads into the next blog. If you have trouble from this site watch it on YouTube:
Fear is one of the most basic human emotions. It is programmed into the nervous system and works like an instinct. From the time we’re infants, we are equipped with the survival instincts necessary to respond with fear when we sense danger or feel unsafe….
People fear things or situations that make them feel unsafe or unsure. For instance, someone who isn’t a strong swimmer might have a fear of deep water. In this case, the fear is helpful because it cautions the person to stay safe. Someone could overcome this fear by learning how to swim safely.
A fear can be healthy if it cautions a person to stay safe around something that could be dangerous. But sometimes a fear is unnecessary and causes more caution than the situation calls for. (Words quoted from https://kidshealth.org/en/teens/phobias.html.)
We also fear for those we love. A mother’s fear for her children can be particularly strong. This latter instinct has been utilised by anti-nuclear power campaigners very effectively. Anti-nuclear campaigners are very genuine in their fears which I believe is based on emotional thinking. Historically, there were good reasons for their fears, and I will address some of these reasons in future blogs.
A look at the early days of nuclear power show little regard for safety. Indeed, safety played only a small part of life just after WW2 and into the 50s. Nuclear bombs were tested. Nuclear proliferation was rife during the Cold War. Nuclear power and nuclear bombs were linked in our minds. This does not apply now. The technologies are very different, the fuel used is very different. Nuclear power fuel uses slightly enriched uranium or is not enriched at all. Nuclear weapons are very, very highly enriched and the fuel is technically difficult and horrendously expensive to produce.
In the 60s and 70s, our car broke down frequently, there were not even seat belts. We cannot pretend those cars compare with our cars now. New generation nuclear power plants are very different too. Indeed, safety was not considered in most areas of life in Australia. As a young chemist, I remember many practices that would not be allowed today.
The recent floods in Australia illustrate this point. Anything can beneficial or harmful. For example, we all know arsenic can kill but a couple of enzymes require arsenic as part of their structure. This probably even applies to nuclear radiation. It is rarely beneficial to have too much of a good thing.
The rest of this presentation introduces some essential concepts of nuclear physics and chemistry – Nuclear 101 – and looks more deeply at fears we may have.
With this background you will be in a better position to make rational decisions about nuclear power.
When nuclear reactions occur, two main forms of energy are released: heat and radiation. Radiation is used in nuclear power plants to cause more nuclear reactions to occur to keep the power plant operating. The heat is collected by a “cooling system” and makes steam which then drives turbines and generates electricity. Most of a nuclear power plant runs in a very similar way to electricity generation by a coal -fired or gas power plant. They all have turbines and cooling systems. When we burn coal, gas or wood, the energy is released in two main forms: heat and radiation. In this case, the radiation is in the form of infra-red radiation and light which is not so useful except perhaps psychologically sitting in front of an open fire.
There are about 440 nuclear power plants in operation in 33 countries. Australia is not one of these. Australia is the only G20 country where nuclear power is banned by Federal law. Nuclear power production is currently not permitted under two main pieces of Commonwealth legislation—the Australian Radiation Protection and Nuclear Safety Act 1998 (the ARPANS Act), and the Environment Protection and Biodiversity Conservation Act 1999 (the EPBC Act).
Nuclear power plants provide 10% of the world’s electricity. It is one of the safest sources of power generation. It produces no CO2 or other pollutants during operation and is the only source of power where every stage of the entire life cycle is securely contained.
Civil nuclear power has more than 18,000 reactor years of experience. The first commercial power plants were built over 50 years ago in the 1960s. Many of the world’s current nuclear power plants were built decades ago and for many years, few new reactors were built due to the campaigns by antinuclear groups and community concerns following Chernobyl. This was concerning as the new technology with greatly improved safety and efficiency was not being implemented. Safety features were no longer just added on as the technology advanced but were an integral part of the designs.
A year ago, the USA and major countries in Europe were setting dates to rid themselves of nuclear. Even France that had 70% of its electricity produced by nuclear power plants was winding down the industry. Sweden was replacing nuclear with wind power and Germany was determined to close all its nuclear power plants. However, other parts of the world, particularly Asia, had a different view and saw nuclear as an important part of the energy mix. About 55 power reactors are currently being planned or constructed in 19 countries.
In 2022, attitudes seem to be changing. France’s president Emmanuel Macron has announced plans to relaunch the country’s commercial nuclear programme with the construction of at least six new nuclear power reactors – and the possibility of eight more for a total of 14 – if he is re-elected. He also announced he wants to extend the lifespan of older nuclear plants to 50 years or more from 40 years currently, provided it was safe to do so. Japan shut down most of its nuclear power plants following the Fukushima event but has then gradually reopened each plant following extensive safety assessment and refurbishment.
Over recent weeks, several Eastern European countries have stated they need nuclear power if they are to reach their 2050 climate goals.
The first set of blogs accompanying my PowerPoint slides provide some basic material on radioactivity and uranium, fact checks issues that worry most of us and asks the question “Why are we afraid of nuclear power?”.
Early next month I will finally give a series of talks to our local University of the Third Age (U3A). It is my way of sharing some of what I have learnt. The omicron variant of COVID-19 postponed many of my activities including these lectures.
The act of putting the presentations together, taught me how little I knew about these issues. I have learnt so much in the process. I have finally decided to present the contents of these lectures in my blog with encouragement from friends.
During the preparation of the talks, I spent many days being thrown from one viewpoint to another but did not stop until I had satisfied myself as to the basic facts. I have tried to take into account the biases and background of each source.
Luckily, I have been able to access many online university courses through EdX on topics ranging from batteries, electric cars, critical raw materials, energy economics, carbon capture and storage, hydrogen, nuclear terrorism and “Living at the Nuclear Brink” plus “Nuclear Energy Science.” (https://www.edx.org)
I have collected and read scientific papers, books, reports and articles, videos and films. Many of the graphs in these presentations have been taken directly from sources such the International Energy Agency (IEA). The one below has been modified to make the labelling more visible.
Despite all the rhetoric about solar and wind power and all the gains made so far, Australia faces enormous challenges. Reducing our use of CO2 emitting energy sources will be a hard road as can be seen from the graph above from the International Energy Agency (IEA) of which Australia is a member.
Unfortunately, we often equate energy with electricity which can give a very false picture despite our massive uptake of residential solar. Are we counting the CO2 emitted during the manufacture of green technologies: battery storage, electric cars, wind turbines or solar panels? Energy use is only part of our emissions of greenhouse gases and electricity is only part of energy production/consumption. Many positive changes sit on the horizon. For example, hydrogen could reduce the use of coal used in steel manufacture, but hydrogen still requires a lot of energy as electricity for its generation.
Australia’s energy production almost doubled between 1990 and 2020. Until a decade ago, our CO2 emissions were also rapidly rising. This rise has now flattened, principally due to greater use of gas over coal but gas prices could threaten this improvement. At best gas can only be a transition measure. Our CO2 emissions rose by 45% between 1990 and 2020. (ref: https://www.iea.org/countries/australia)
Australia is the world’s 14th highest emitter, contributing just over 1 per cent of global emissions. The Australian Government tracks the nation’s greenhouse gases emissions through the National Greenhouse Gas Inventory. According to the December 2020 update, Australia emitted 499 million tonnes of carbon dioxide equivalent. (ref CSIRO) This a lot for a country with 0.3% of the world’s population.
We are one of the world’s highest green-house gas emitters per capita in lots of categories. We have reduced methane and nitrous oxide emissions substantially but are still very high in world terms. These gases are partly produced in the agricultural sector but changes in farming practices have already helped to halve these emissions. (ref: https://ourworldindata.org)
Data varies from source to source and data is often grouped in different categories making comparisons very difficult, but the big pictures are clear.
Tasmania produces clean, green electricity according to a fascinating live site on electricity production around the world (https://app.electricitymap.org/zone/AUS-TAS Approximately 60 % of Queensland electricity comes from coal and roughly 40 % from solar. The data I found on wind was sketchy.
The carbon intensity information below cleverly illustrates the differences energy source makes to carbon intensity of electricity generation. Grant Chalmers created the video using data from http:/docs.co2signal.com. Countries with lots of nuclear power and/or hydro have low carbon intensity per MW.
One of the issues not discussed enough relates to the materials needed for the green transition. I have heard very little discussion of the lead-in time for all the new mines needed for essential materials.
Does nuclear power have a place? Looking at world-wide statistics, it plays a huge role in those countries with low carbon intensities.
Until recently, my stance was that countries like Sweden could safely use nuclear power because they developed and implemented long term policies. When Australia could not even manage low level waste sensibly, I doubted we could safely use nuclear power.
Recently, many countries are changing their views about nuclear power. Currently, Australia has a ban on nuclear power but has a research reactor at Lucas Heights near Sydney producing medical isotopes.
Good background knowledge is essential for meaningful discussions about Australia’s energy future. By sharing my journey, I hope to put others on a pathway to learning more about low carbon technologies and the challenges we face.
The first of the series of talks is called Why Do We Fear Nuclear Power?
It is presented as a series of 6 blogs which are labelled a to f so that they can be accessed in a logical order.
The second and third lectures examine the question
Does Nuclear Power have a Place in the Era of Decarbonisation?
The final lecture in the series is called Nuclear Power for Today and Tomorrow