The Great Continental Drying

The Earth is losing over 300 billion cubic metres of freshwater annually.

“The world is using and losing more freshwater every year as people, farms, and cities all demand more.

Drawing on satellite measurements and global economic data, a new report from the World Bank finds that Earth is losing roughly 324 billion cubic meters of freshwater annually. (This is equivalent to over 500 Sydney Harbours in volume.)

That volume could meet the yearly water needs of around 280 million people, so each year of loss locks in more risk for communities that already live close to the edge.” –https://www.earth.com/news/how-earth-loses-324-billion-cubic-meters-of-freshwater-yearly/

For a wonderful summary of the World Bank report, watch this video https://www.youtube.com/watch?v=Liw96w05LkY&t=320s

The Y -axis above is in billions of cubic metres.

Our continents are drying. Why?

It is all to do with groundwater which makes up 99% of all liquid fresh water. Most of the time, all the water that flows in streams and rivers is groundwater. It’s called base flow. All wetlands are fed by groundwater, and most ecology that’s water-related has a groundwater feed.

Our continents are drying because we are changing the land surface so that groundwater recharge is reduced while we use more and more groundwater. We build our cities and towns so that instead of seeping into the ground, water speeds over concrete and bitumen into the sea. We build giant reservoirs and millions of little dams designed to stop water seeping into the ground and water is wasted to evaporation. We chop down forests and fill in wetlands. We bare the soil and water rushes across the landscape. Water from irrigation is lost to the atmosphere.

” About half the people in the world drink groundwater to some degree or another. And 40% of the food these days is produced by irrigation, but 70% of the irrigation water is groundwater.”- John Cherry in an interview with Alpha Lo of the Climate Water Project: https://climatewaterproject.substack.com/p/the-big-groundwater-crisis-food-water

There is a global water crisis caused by the depletion of aquifers around the world. We forget that water is an important greenhouse gas helping to make our world hotter. Low soil moisture leads to a greater need for irrigation and so the cycle further leads to more aquifer depletion. More and more water ends up in the oceans. Depleting water levels and increasing temperature work together to reduce agricultural yields and lead to famine.

Social consequences

Around the world, large parts of northern India, Central America, Eastern Europe, and the Middle East are already in drying basins where both demand and aquifer depletion are climbing together.

In Sub Saharan Africa, the World Bank report links drought driven water shortages to job losses for roughly 600,000 to 900,000 people each year, especially in rural farming communities and among women and older workers.

The mass migration to the cities in Syria because of water shortages, caused civil unrest and worse.

Iran is in severe trouble. In the past year, the country’s average annual rainfall has dropped to 45 percent below normal, and nineteen of its thirty-one provinces are in a severe drought. The dams and reservoirs that supply the capital have dried up and are operating at minimal capacity, with some at only 5 percent of reserve capacity. (Google AI summary from carnegieendowment.org/emissary/2025/11/iran-water-crisis-warning-climate?)

Faced with a perfect storm of weather woes and decades of mismanagement, Iranian president Masoud Pezeshkian issued a warning to his country that the situation could deteriorate even further.

“We’ve run short of water. If it doesn’t rain, we in Tehran … must start rationing,” he said.

“Even if we do ration and it still does not rain, then we will have no water at all.

“They [citizens] must evacuate Tehran.” There are 15 million people living in Tehran: https://www.abc.net.au/news/2025-11-24/iran-facing-worst-drought-in-60-years/106035210

Wildfires, Biodiversity

Continental drying also fuels more frequent and severe wildfires, especially in forests and grasslands that used to stay moist for most of the year.

The World Bank report estimates that a modest increase in the rate of freshwater depletion can raise the likelihood of wildfires by more than a quarter, and by about half in biodiversity hotspots where species are already under pressure.

As water tables fall and rivers shrink, ecosystems lose the steady flows they need to keep species alive.

Wetlands can turn into dry plains, fish populations can crash, and soils can degrade, which makes recovery harder even if rain eventually returns.

Land Use Decisions are a Key Driver of Continental Drying

The figure below shows effect of land use change on ground water resources, defined as TWS (terrestrial water storage).

Note: This figure illustrates the estimated impact of a 1 percent change in the respective land use type in 2002 (equivalent to approximately 25 km2 on average) on the grid cell’s TWS trend from 2003 to 2024, with barren land serving as the baseline. “Other natural vegetation” includes grasslands, savannas, and shrublands. Error bars show 95% confidence intervals. TWS = terrestrial water storage.

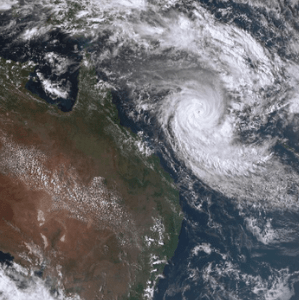
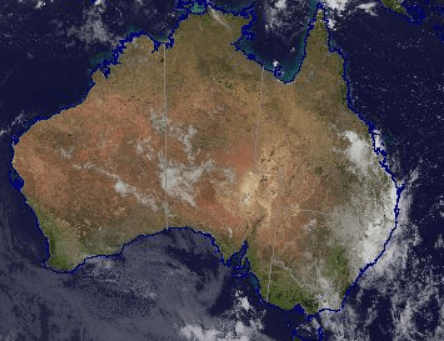
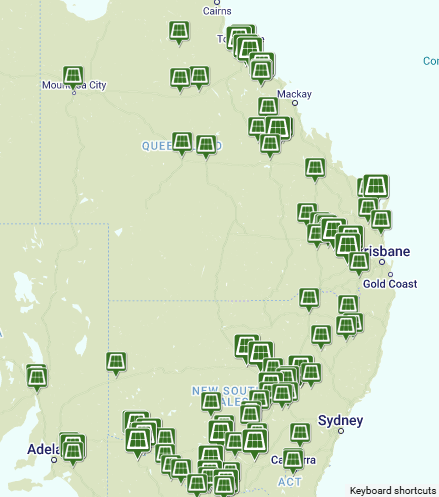
What About Australia?

We are already a dry land but so far, the Great Dividing Range has kept our main population centres watered and fed. However, our current obsession with removing forest, particularly on the mountain ridges, may become a step too far. This could result in a drier continent but when it rains flooding will increase. Our major cities are placed next the Pacific Ocean. As we build further and further west, the remaining patches of forest that attract rain inland may no longer so effective. This may result in rainfall reduction further inland as theorized by the Biotic Pump concept – perhaps a discussion for a future blog?

Australian Forests Are Not Getting the Attention They Deserve in the Battle Against Climate Change.

“Here is the uncomfortable truth: Even if we zeroed out carbon emissions tomorrow—a goal certainly worth pursuing—without massive ecological restoration the climate emergency would persist. Forests aren’t just carbon sinks. They are the planet’s primary climate regulators, its freshwater generators, and the very foundation of continental habitability.” Antonio Donato Nobre
We must not degrade native biodiverse forest in Australia for any reason no matter how persuasive the argument seems. We must do all we can to restore and preserve it!

This blog is an adaptation of a short talk I gave at the Cairns & Far North Environment Centre (CAFNEC) Round Table in November 2025.

Picture by Stephen Nowakowski of the Barron River Falls and the surrounding forest.

Forests do a lot of heavy lifting. But what is happening to tropical forests around the world?

Looking at the 3 most important tropical forests around the world, the Amazon Basin is now at a tipping point as a carbon sink. It is barely sequestering more carbon than it produces. The Congo River Basin is still functioning as a net sink despite high levels of clearing. Sadly, South East Asia is now a net carbon producer.  A reminder that the carbon emissions from these areas would be much greater without the intact biodiverse forest that still remains.

What about Australia? Recent studies indicate that our tropical forests may reach a tipping point due to various types of disturbance and damage. Unfortunately, the land of south eastern Queensland has already become a net carbon source. Friedlingstein et al 2024; Global Carbon Project 2024

Net Zero Protocols and Targets

Australia, as did over 100 countries around the world, took on the protocols and targets set by the UN. Each country has been reporting its carbon emissions to the UN according to this plan. This year, only half of these same countries are going to COP30 with the same promises to meet Net Zero Targets. This UN approach to fighting climate change and adopted by Australia is summarized in the diagram below. It is copied from https://www.netzero.gov.au/net-zero. It is my emphasis that has been placed on the word we.

Just how effective is this anthropogenic approach? Well, the world adds a net 5.2 Gt of C to the atmosphere each year.

This diagram illustrates just what is being rewarded under the Net Zero protocol approach. Yet the land with its forests removes 3.2 GtC each year. Millions and millions of dollars have been pumped into the second two technologies for years now and maybe, just maybe, they may eventually have a real effect on carbon emissions. But, in the meantime, we destroy the very thing that it actually working hard for us.

Under the Net Zero protocols, biodiverse forest is not really counted or rewarded.  

An example, after a bushfire, if the fire was not too hot, the forest will regenerate and even would benefit from a little help – no reward. But, if the area is cleared and a plantation is developed, the developer can get lots of saleable carbon credits. The former may continue to sequester carbon for little or no cost and keep doing so for thousands or even millions of years. The latter costs more money, sequesters carbon really well for a generation or so but may end up as a zero-sum game.

If good quality biodiverse forest is knocked down, the carbon accounting systems only records a small penalty for change of land use, but little or no accounting is made for the loss of sequestration that would have continued for hundreds of years.

Why are our Forested Areas becoming Net Carbon Sources Instead of Net Carbon Sinks?

This classic diagram provides a hint.

A biodiverse forested area is a living ecosystem. When too much disturbance happens, the tipping point can occur well before 50% disturbance occurs. In Australia, wind turbines are being built by destroying mountain top forest. The impacted area is far greater than the area cleared. The clearing changes micro weather patterns. Uncovered soil is hotter and the surrounding soil and forest also dries. The mists that used to form on the mountain tops become less frequent and the vegetation changes, becomes more fire-prone, invasive species seize the opening, the biodiversity changes and bats no longer pollinate the trees and spread seeds.

Basically, we are rewarding anthropogenic activities that only last for a generation or two. We must start thinking long term. The following diagram shows the sorts of activities that are rewarded. We ignore the “natural” and even give little weight to the less intensively managed forest.   

ref: Source: Friedlingstein et al 2024; Global Carbon Project 2024,

Biodiverse Forests are More than Simply Carbon Sinks

I found some wonderful words by a retired Brazilian scientist who has summarised the issues so eloquently. I presented some of his words in my presentation in 2 slides as shown below.

Are Forests Becoming Carbon Sources Rather Than Carbon Sinks?

Currently, our land with its forests and other vegetation removes a massive 30% of our carbon emissions every year. Unless natural carbon removal processes are maintained, we have no chance of ever restoring carbon dioxide levels in our atmosphere to tolerable levels.

The classic diagram below is misleading in that it is too simple. The “young growing forest” in the third panel is shown as sequestering more CO2 than the “standing forest” or natural forest. This is initially true but depending on its origin and future, the young growing  forests can end up as a net carbon sources or at best carbon neutral.

There are two main groups of “young growing forests”: plantations and regrowth forest. If regrowth forest survives long enough and is ecologically diverse enough, it can take on the characteristics of older forests when it reaches an equilibrium between death and decay and natural tree replacement.

Old-Growth Forests Store Carbon Differently

When it comes to fighting climate change with forests, it’s easy to think all trees are equal. This thinking has led to simple approaches that focus on tree numbers rather than the complexity of the forest. However, science tells a different story: old-growth forests and tree plantations store carbon in distinct ways, and this matters significantly for climate action.

https://www.ecomatcher.com/why-old-growth-forests-store-carbon-differently/

Old-growth forests are sophisticated carbon storage systems that have been built over hundreds or even thousands of years. There are trees of different ages, sizes, and species, creating a complex living structure. This diversity is crucial for storing carbon. Trees do die but they are replaced, and the system reaches a wonderful equilibrium which continually sequestered carbon. The massive tree trunks in old-growth forests represent centuries of carbon buildup. A single large tree can capture as much carbon in one year as an entire medium-sized tree contains in its whole body. In some forests, large trees make up just 6% of all trees but account for 33% of the forest’s yearly growth. This shows why size matters when it comes to carbon storage.

Most importantly, old-growth forests continue to store carbon in many different ways and places. Above ground, carbon is locked in living trees, dead standing trees, and fallen logs that take decades to break down. Below ground, massive root systems and centuries of built-up soil create huge underground carbon vaults. This multi-layered storage system provides both capacity and strength.

Many of Australia’s native forests are younger remnant forests but these forests are also living ecosystems and actually work nearly as hard for us, not just by sequestering carbon and preserving our biodiversity but by helping to cool our land through evapotranspiration and shading and forming a critical part of the water cycle. Forests can store a lot of water, helping to mitigate floods, seed clouds and clean water.

Do Plantations Mitigate Climate Change?

Plantations are typically planted with a single species all at the same time. Plantation forests can remove between 4.5 and 40.7 tons of CO2 per hectare per year during their first 20 years of growth. However, they all reach maturity together and die together, throwing all that carbon back into the atmosphere if they are not logged first. Depending on the use of those forestry products a little of the carbon may be stored for a few decades. Thus, plantations end up carbon neutral at best having achieved no long-term benefits.

Unfortunately, the carbon accounting and reward systems in Australia encourage the use of plantation type forests after bush fires rather than assisting the natural but slower reforestation processes. Some of these decisions are influenced by the severity of the fires. This again emphasises the importance of doing everything we can to fight all wildfires as quickly and efficiently as possible.

What Happens If Forests Stop Absorbing Carbon? Ask Finland

Natural sinks of forests and peat were key to Finland’s ambitious target to be carbon neutral by 2035. But now, the land has started emitting more greenhouse gases than it stores. (https://www.theguardian.com/environment/2024/oct/15/finland-emissions-target-forests-peatlands-sinks-abs)

In a country of 5.6 million people with nearly 70% covered by forests and peatlands, many assumed the plan would not be a problem.

For decades, the country’s forests and peatlands had reliably removed more carbon from the atmosphere than they released. But from about 2010, the amount the land absorbed started to decline, slowly at first, then rapidly. By 2018, Finland’s land sink – the phrase scientists use to describe something that absorbs more carbon than it releases – had vanished.

Finland’s forests were mostly planted after WW2. In other words, they are mainly plantation forests. Commercial logging of forests – including rare primeval ecosystems formed since the last ice age – has increased from an already relentless pace, now making up the majority of emissions from Finland’s land sector.

Higher temperatures are causing the peat to break down and release CO2.

It has been suggested that by reducing the amount of logging and better management of their forests, the situation could be turned around. However, Finland’s Finance Ministry estimates that harvesting a third less would reduce GDP by 2.1%.

Finland is now forced to reduce its emissions by other means and won’t reach its Net Zero Target any time soon.

Are Australia’s Tropical Forests Becoming Net Carbon Sources?

An October 2025 paper published in Nature looking at Australian moist tropical forests used half a centuries’ data on above ground biomass as a measure of carbon sequestration. The above ground biomass was determined by measuring the girth and the height of every tree in each plot.

The study reported that a transition from carbon sink (0.62 ± 0.04 tonnes C /ha/ yr: 1971–2000) to carbon source (−0.93 ± 0.11 tonnes C /ha/ yr: 2010–2019) had occurred. https://doi.org/10.1038/s41586-025-09497-8

Standing carbon stored in the trees dropped almost 30% to about 200 tonnes of carbon/ha yet these Australian forests continue to be among the most carbon-dense terrestrial ecosystems on the planet as well as harbouring a very high proportion of Australia’s remaining biodiversity.

The trees are only living half as long. Death rates have doubled. Degradation has been caused by cyclones and high winds, invasive species, higher temperatures and loss of soil moisture. Canopy leaves die in hot dry weather. There has also been a change in fire regimes. Loss of pollinating species such as the spectacled flying fox means that there are less seeds to regenerate the forests. Clearing and fragmentation of the forest in earlier years left the forest more vulnerable.

Importantly, in this particular study other vegetation was excluded as was carbon stored below ground in the soil and plant roots. However, luckily this forest is still a net sink when biomass underground is considered. Could that change?

The World’s Land Sinks and Sources in 2024

Ref: Global Carbon Project Carbon Budget 2024 slides

Note that the land of southern Queensland, despite its remaining forest, is now a carbon source.

Many areas around the world are close to a tipping point.

The Amazon basin is showing many areas of stress, the most important natural forest areas of the world.  The upper Amazon River and tributaries dried out for the first time in recent years.

A wrecked canoe lies in the dry bed of the Amazon River near San Augusto, Peru. IMAGE CREDIT: Plinio Pizango Hualinga/Rainforest Foundation US

How Much Degradation Can a Forest Take Before Becoming a Net Carbon Source?

An intact native forest will be a carbon sink.

A disturbed forest may be a carbon sink or a carbon source depending on the nature and amount of disturbance. A forest can become a net carbon source long before being totally degraded. For example, in 2025 the Amazon Basin has now been degraded to the extent that it has become a net source rather than a net sink.

A badly degraded forest is a carbon source.

As temperatures climb, and land dries out, is there a tipping point? Of course there is!

It is not necessary to clear large areas within a forest to start it along the path to its tipping point. Studies in the Amazon basin have shown that clearing a little land in the middle of forest can dry out the soil for up to 3 km away. This has an effect on the water cycle and over time the damage gradually extends further and further into the forest.

Despite man’s disruption of some of our most important forests and increasing CO2 levels, nature has continued to remove 30 % of the carbon emissions we produce. Signs of strain are now showing. The oceans are not taking up quite the same amount that they were. The major tropical forests have sink areas but increasing source areas and the balance between sink and source is changing.

However, these forests still store hundreds of billions of tonnes of carbon.  

Unfortunately, the current Net Zero protocols reward the creation of plantation forests at the expense of ecologically diverse established native forests. There is little reward for maintaining and looking after real forests. It is seen as beneficial to degrade forest to build short term mitigation structures, not considering the long term effects. We are neglecting the natural world by concentrating too much on economic drivers. Even less-intensively managed land has been made a poorer cousin.

Adapted from Earth Syst. Sci. Data, 15, 1093–1114, 2023

What Will Happen to the World if Nature Stops Being a Net Carbon Sink?

We do need to cut emissions. It is not the basic concept of Net Zero that is the problem. It is how it is being implemented. We need a new way forward!

As temperatures climb, and land dries out, is there a tipping point? Of course there is!

Unfortunately, the current Net Zero protocols give the biggest rewards for the least effective behaviour.

How much more can we threaten our Australian forests before they crash and the eastern states become drier and drier and even hotter than necessary?

Please UN, COP and Australian Government find a way to reverse these trends. It is not too late!

A Big Hole in Net Zero Thinking

As described by the UN, Land “plays a key role in the climate system” as an essential carbon sink because its surfaces, such as forests, regulate the planet’s temperature and help to store carbon. In the last decade alone, land-based ecosystems absorbed around 30 per cent of the carbon emissions generated by human activities, such as the burning of fossil fuel. https://www.un.org/en/climatechange/science/climate-issues/land

This approach does not match the UN Net Zero approach as only direct anthropogenic activities to ease Climate Change can be counted.

Checking the Meaning of Net Zero

A deeper look at the wording of Net Zero statements puts little emphasis on Nature’s role in lowering GHG. For example, note the following Australian wording, with emphasis on “we”.

Net zero means balancing the amount of emissions WE produce with those WE remove from the atmosphere.

The UN says:

Put simply, net zero means cutting carbon emissions to a small amount of residual emissions that can be absorbed and durably stored by nature and other carbon dioxide removal measures, leaving zero in the atmosphere.

However, the UN reports use the following explanations:

Carbon dioxide removal (CDR): Refers to anthropogenic activities removing CO2 from the atmosphere and durably storing it in geological, terrestrial or ocean reservoirs, or in products. It includes existing and potential anthropogenic enhancement of biological or geochemical sinks and direct air capture and storage but EXCLUDES natural CO2 uptake NOT directly caused by HUMAN activities.

Land use, land-use change and forestry (LULUCF): A GHG inventory sector that covers emissions and removals of GHGs resulting from direct human-induced land use, land use change and forestry activities.

Ref: https://www.unep.org/resources/emissions-gap-report-2024#:~:text=As%20climate%20impacts%20intensify

What is the Effect of Using this Anthropocentric Approach?

Only 3% of the world’s budget for climate change mitigation is spent on forest protection, even though vegetated land surface is removing 30% of the emissions we produce.  As CO2 levels have risen, nature has kept taking CO2 out of the atmosphere, but the system is starting to show real strain for 2 reasons.

  1. We have undervalued natural ecosystems already in existence by not giving their conservation and protection a strong enough voice and role in the definitions of Net Zero. Thus, it becomes OK to knock down parts of a forest to build wind turbines or palm plantations or build a 4- lane highway for COP 30. Net Zero accounting only measures the actual land area cleared but forgets the edge effects that can dry out forest and soil lessening the ability of far greater areas of forest to continue sequestering carbon. Disturbed forest is more susceptible to wildfire and damage from storms leading to yet further degradation.
  • As temperatures climb, the ability to photosynthesise can become weaker in a wide range of plants. Unfortunately, almost all tree species have a C3 type metabolism that is not well adapted to hotter and drier conditions. Australia is lucky to have many C4 plants such as saltbush, spinifex and indeed almost all  of our Australian grasses. C4 crops include sugarcane, pearl millet, corn and sorghum. In some wetter years our savannah lands do a lot of sequestration. They need protection too.

C4 photosynthesis was an adaptation to less water and lower CO2. It is far more efficient in drought and high sunlight and dominates in tropical savanna areas. When grown in the same environment, at 30°C, C3 grasses evaporate approximately 833 molecules of water per CO2 molecule that is fixed, whereas C4 grasses lose only 277. This means that soil moisture is conserved, allowing them to grow for longer in arid environments.

It is possible that if we keep on our current pathway, Australia will turn our forests from net sinks for CO2 to net sources and then we could progress to losing them completely. What a tragedy that would be!  Imagine losing our moist Eastern Australia lands. Forests are a very important part of the water cycle and do a massive job of cooling the Earth and keeping it from drying out. Forests bring rain. Loss of biodiversity within forests degrades and ultimately kills forests. They are complex ecosystems where every living thing plays a role. I will expand the topic of forests as net sinks or sources in a future blog.

Reaching net zero is impossible without nature. In the absence of proven technology that can remove atmospheric carbon on a large scale, the Earth’s vast forests, grasslands, peat bogs and oceans are the only option for absorbing human carbon pollution, which reached  37.4 bn tonnes in 2023. https://www.iea.org/reports/co2-emissions-in-2023/executive-summary)

So far Nature has been doing much more to lower CO2 levels than all our anthropogenic efforts.

Why are we wasting money and other resources to build temporary structures by destroying the resource we already have that is busily working to moderate our climate ? How about we save our land from further degradation by using nuclear power in the longer term and gas now as part of a meticulously planned energy transition that includes carefully sited renewables?

The use of nuclear power and gas would help to preserve the land. Gas is a much lower carbon emitter than coal. By using more gas for industrial purposes for tasks that require high heat, a job that renewables cannot do, carbon emissions can be reduced without losing strategic industries we need to build our homes, produce food and export mining products. The Australian Government recognises a role for gas but seems to have done little to ensure a reasonably priced, adequate supply to industry. https://www.industry.gov.au/publications/industry-sector-plan/pathway-2050

Watch Mark Vassella, BlueScope Managing Director and CEO, address The National Press Club of Australia on “Australian gas prices are costing us our manufacturing, jobs, energy transition, and a future made in Australia.” https://youtu.be/HJoVbF1rtGI?si=LdTxvpatAGY-PDjO

We have already done so much damage, because Net Zero policies just don’t address the issues. Theoretically, Australia now has the Nature Repair Scheme which officially began with the Nature Repair Act 2023 which came into effect on December 15, 2023. Implementation finally started in 2025 with the first project improving land by replanting. The scheme is designed to” restore and protect” our natural environment, and participants can earn carbon credits. This scheme does not protect forests. It demands similar actions to Net Zero and still leaves our best remaining forests vulnerable. Our Environmental laws need strengthening not weakening to prevent building renewables in the wrong places and destroy the existing carbon sequestration capacity.

Next time – Are Our Forests Becoming Net Carbon Emitters or Sinks?

What Is Net Zero?

The Official statement by the Australian Government Net Zero Economy Authority means the same as the COP statements:

“Net zero means balancing the emissions we produce with those we remove from the atmosphere. It doesn’t mean eliminating all emissions, but making sure we don’t add more than we take away.”

Reference for the statement above and the diagrams below: https://www.netzero.gov.au/net-zero

Net Zero does not mean that all Green House Gas emissions are zero. Unfortunately, plans in Australia to reach Net Zero are very unbalanced and too simplistic. These plans put weight on emission reduction and sequestration technologies while neglecting the biosphere’s role.

The great diagrams shown below illustrate this more clearly. https://netzeroclimate.org/what-is-net-zero-2/

Is Australia The Lucky Country?

We are lucky in Australia as our land and its biota, our biodiversity, is assisting us to sequester and store a lot of carbon in our forests and savannah lands, both above and below ground level. I will go into this issue and other related issues in greater detail in future blogs.

Meanwhile, we continue to remove trees from our forests, drying out the soil, reducing nature’s ability to help, throwing more carbon into the atmosphere. The new approach to environmental protection currently under Murray Watt encourages destruction of natural systems to build renewables. What a waste! This means all the money spent is not achieving as much as it could be. Let’s put solar on car parks instead of good agricultural land. Let’s build windfarms on brown field sites. Let’s preserve forests rather than find we need to rehabilitate and replace those same forests.

We only have finite resources, money, and materials. We must rigorously evaluate the true cost of various strategies and policies while looking at the whole picture not just isolated pieces of the transition challenge.

What Cyclone Alfred taught us about Rooftop Solar Power Generation – by Dr David Jones

Cyclone Alfred was a 1 in 50y event that brought low grade cyclonic winds to southeast Queensland and northern NSW over a period of a week between March 4-11. However, it was the rain and associated flooding after the cyclone crossed the coast that caused the most widespread damage. The multi-day duration of cloud cover that the system brought is the basis of this blog.

Rooftop solar refers to solar panel on roofs, and this is dominated by residential (domestic) installations.

Currently more than 1-in-3 Queensland homes have rooftop solar, the highest rate of any Australian state or territory, with 6 GW having been installed by early 2024. Three quarters of the population of Queensland lives in the southeast corner of the state. Thus, three quarters of the dwellings with rooftop solar are located in this geographic region and account for the great majority of rooftop solar being fed into the grid during the day.

The table below shows the contributions of small (rooftop) and large scale (solar farms) inputs in MW to the Queensland grid in the middle of a typical bright sunny day. The electricity coming from coal and gas, and from wind are included for reference.

These figures were taken from the NemWatch site on February 27 when the cyclone and associated cloud was well off the coast (satellite image below) and the east coast was largely cloud free. I have also included the comparable figures from NSW for reasons that will soon become apparent.

For both states, solar was making by far the largest contribution to electricity generation.

Satellite Image (source: BOM) on February 27 showing cyclone Alfred and associated cloud well off the east coast.

The table below compares the data from February 27 with that at a similar time during the day on March 10 when there was extensive cloud cover over southeastern Qld and northern to central coastal NSW (see satellite image below).

What is immediately apparent from this table is the huge 60% drop (1800MW) in rooftop solar output seen on March 10. There is also an almost 20% drop in the output of large solar, but this is small in comparison. The 2200 MW loss from solar had to be made up by coal and gas generators.

The question is why rooftop solar was impacted so much whereas large solar only suffered a modest decline. The reason is location! The locations of large-scale solar plants down the east coast of Australia are mapped below. What is immediately apparent is that in Queensland most of these are located further inland and north of the cloud covered area.

In New South Wales there was 45% drop in rooftop solar, and a similar 20% drop in large solar. Once again for similar reasons to Queensland where the cloud cover extended down the coast to the Sydney area which hosts the majority of rooftop solar in New South Wales. However, the drop wasn’t as big in Sydney because there was less cloud cover.

Satellite Image (source: BOM) on March 10 showing extent of cloud cover in southeastern Queensland and northern New South Wales.

Locations of large solar farms in Qld and NSW https://reneweconomy.com.au/large-scale-solar-farm-map-of-australia/

This rooftop solar drought lasted for several days after Alfred, with coal and gas power continuing to make up the shortfall. Given that there is very little storage for the renewables component of the grid, this highlights the vulnerability of having the bulk of the rooftop solar generating capacity in the one geographic area. Even for those fortunate enough to have battery storage for their rooftop solar, this backup would not have been sufficient to last for the days of cloud cover.

This situation occurred again in March when a broad band of cloud blanketed much of southeastern Queensland for much of the month, extending across eastern New South Wales in the last week of March (satellite image for March 28 below). The solar output figures for Queensland and New South Wales at mid-day on March 28 are compared with the “reference” February 27 outputs below. The almost complete “collapse” of large-scale solar outputs in both Queensland and New South Wales was caused by the cloud extending much further inland in both states, and further north in Queensland than was the case on March 10. In both states, but particularly in NSW, the loss of solar was partly offset by an increase in wind generation.

What this shows is that the concentration of rooftop solar in the large coastal cities of Brisbane and Sydney exposes the vulnerability of the state’s solar generating capacity to cloud cover, especially during the summer season. This situation is likely to be worse in the coming years when it is likely that there will be increased southerly excursions of warm moist air from the tropics. These periods can last for days at a time and highlight the critical need for much more medium and long duration storage to firm even the current penetration of renewable generation.

Cognitive Dissonance and Low-Dose Radiation

Germany has more radon baths than any other country. Yet they fear nuclear power plants. They closed them down and opened up coal mines knocking down ancient forests in the process. Medical benefit payments are paid out to people who attend the radon spas for relief of muscular-skeletal ailments. The medical fraternity warns of the dangers of radon yet people in pain still seek relief.

People have been using radon baths for thousands of years.  Low dose radiation seems to lessen the pain and immobility of osteoarthritis. But not every patient benefits.

https://www.fau.eu/2019/01/17/news/research/the-healing-effect-of-radon/#:~:text=Thermal%20water%20that%20contains%20radon,Steben%20Health%20Spa%20Research%20Association).

https://pmc.ncbi.nlm.nih.gov/articles/PMC2477705/#:~:text=Radon%20Via%20Bath%20or%20Steam,for%20three%20or%20more%20weeks.

Many studies have shown that the more low dose radiation a population receives, the less cancer there is in the population. This effect is known as hormesis. I can also find studies that state that low dose radiation causes cancer.

 Is anything black or white or just shades of grey? Is anybody totally truthful? We all have our biases. To get a message across about cognitive dissonance I wrote “Low Dose Radiation is not Harmful and May Even Be Good for Us! Nobody Died from Radiation at Fukushima”

But panic and fear of radiation caused the unnecessary deaths of over a thousand Japanese people following the evacuation.

Every decision we make in life rests on our perception of the risk involved versus the benefits. That balancing act changes with circumstances. For example, the amount of radiation used for cancer treatment is huge. None of us would want to receive that much in ordinary circumstances. A medical specialist tells us it is our best chance of beating deadly cancer and we accept the treatment for 2 reasons. Firstly, the radiation will be applied under very controlled conditions to a limited area. Secondly, the whole balance of the situation has changed.

A few years ago, I didn’t agree that Australia should have a nuclear power industry. Did we plan long term enough? Did we plan carefully? Were we just too Gung-ho?

I am now watching the destruction of Australia’s wonderful unique biodiversity as we lose forest and mountain ridges to wind turbine projects in Queensland in the “fight against climate change”. Is the balance, right? Do we have to destroy nature to save the planet?

Ecologists, Barry W. Brook and Corey J. A. Bradshaw ranked 7 major electricity-generation sources (coal, gas, nuclear, biomass, hydro, wind, and solar) based on costs and benefits. They published a paper in 2014 called:  Key role for nuclear energy in global biodiversity conservation. https://conbio.onlinelibrary.wiley.com/doi/full/10.1111/cobi.12433.

This study still stands out. It used multicriteria decision-making analysis and ranked 7 major electricity-generation sources based on costs and benefits. It then tested the sensitivity of the rankings to biases stemming from contrasting philosophical ideals. Irrespective of weightings, nuclear and wind energy had the highest benefit-to-cost ratio.

The Integrated Life-cycle Assessment of Electricity Sources undertaken by the United Nations Economic Commission for Europe which concentrated on Carbon Neutrality in the UNECE Region has been extensively quoted by Oscar Martin on LinkedIn. https://digitallibrary.un.org/record/4020227?ln=en&v=pdf

Nuclear scored far better than wind power (and all other electricity generation types) on nearly all rankings with the exception of water use and of course radiation. Public and occupational exposures to radiation from electricity generation was far higher from coal and even geothermal systems than from conventional nuclear power plants. Likewise, every other of 22 assessed electricity generation types were more carcinogenic than conventional nuclear power.

Potential impacts such as specific biodiversity-related impacts, noise or aesthetic disturbance were not assessed under the land use analysis. Nuclear had the lowest lifecycle impacts on ecosystems, followed by various forms of wind and solar power. Under the land use assessment, renewable technologies were assumed to be readily built on various land types without heavy modifications such as land sealing, mountaintop removal, and flooding.

The assessment of land use which was used in the assessment of ecological impact for wind projects only considered the directly disturbed land (turbine pads, access roads) and assumed the surrounding land could be used for other purposes such as agriculture. For disturbed forests this leads to massive underestimation of the impact. Research in far northern Queensland is finding that impacts from wind turbines on some species in forests can extend 3 km or more from a turbine.

Nature is doing over half the work of reducing carbon dioxide levels worldwide. We can save nature and the planet. With a carefully planned mix of nuclear and other energy sources, we can preserve our biodiversity.

Yes, nuclear power is not 100% safe and clean. Nothing ever is. The benefits to humanity and nature are too great to ignore and far greater than the risk.

Australians for Nature and Nuclear!

What Does It Take to Close a Coal Mine and a Coal-fired Power Station?

Burning coal to produce electricity is a terrible waste when coal has so many other important uses. At this time, the energy from it is still essential for the manufacture of wind turbines, transmission lines and solar panels.

It is not always realised that coal is needed:

as a source of essential ingredients for the manufacture of many dyes, pharmaceuticals, explosives, perfumes, plastics, paints and photographic materials; and

to produce the very high temperatures needed to manufacture steel, cement, aluminium, bricks, glass and some metals and chemicals.

Latrobe Valley, Victoria, Australia

A few weeks ago, David and I attended a conference in the Latrobe Valley held by CRC TiME called “Bridging Diverse Interests”.  https://crctime.com.au/ When a coal mine or any mine is closed down, a complex rehabilitation process follows. Delegates at the conference had the opportunity to visit both Hazelwood and Yallourn brown coal mine  and power station sites.

The Latrobe Valley mines are large, close together, close to local communities and infrastructure. The power stations have a small footprint on each mine site. Mine Land Rehabilitation Authority

Hazelwood Power Station and its associated coal mine stopped operating in 2017. The owner, French company Engie plans to spend a billion dollars rehabilitating the mine site by filling the giant mining pit with water. The volume needed will be greater than that of Sydney Harbour. The plan is still under discussion by many stakeholders. We heard from some of the community groups about their hopes for the site. The closure has already had a big impact on local townships and the staff who lost their jobs. Three years after the closure, a survey found these highly skilled workers were still only earning an average of 50 % of the income received prior to the closure. Questions remain about the feasibility of the rehabilitation plan. Enough water may not be available and contaminant levels in the ash have been highlighted by a green group as a possible long-term issue.

Yallourn Power Station – photo by David Jones

Yallourn is scheduled to close in 2028. River water, currently used by the power station for cooling, will be used to fill the pit.  It will take decades.  The ground is soft, like the brown coal itself, and collapse of the sides of the pit must be carefully avoided. The ash is low in contaminants and should not pose a problem with water quality. Often there is disparity between the requirements of the regulators, the local community, the First Nations People and the technical and economic considerations of the miners. Just because the community desires a certain outcome, it may not be technically possible and safe.

Yallourn Coal Mine: the coal seam is 80 metres thick and can be seen in the background. Lines of trees have been planted in the bottom of the pit. Photo by David Jones

The third power station, Loy Yang, and its associated mine is also scheduled for closure in 2035 bu.

What is the future of the Latrobe Valley? Will it be left with lots of orphaned transmission lines and closed businesses, medical facilities and schools? This will happen unless viable solutions developed in consultation with regional communities are identified and implemented. It has been suggested in other forums that coal-fired power stations could be replaced by nuclear power stations thus making use of these industrial sites and transmission infrastructure, while providing similar jobs for the already skilled workforce. Participants I spoke to from other places in Australia were pro-nuclear but locals were wary. The social licence was not there because of a historical distrust of Government processes. Technically the sites would need to be evaluated for ground stability.

A central theme of the conference was that First Nations People should be properly and fully involved early in the process of planning mine closure.

Mining Rehabilitation

The NT Government is working in partnership with the Australian Government and Traditional Owners to rehabilitate the former Rum Jungle Uranium Mine Site. Early rehabilitation work was undertaken in the 80s and the traditional owner groups were not involved in the process. The site does not meet today’s standards. The current project will remove a major impediment to the site’s return in good order to the Kungarakan and Warai people.

The inspirational project leader, Jackie Hartnett of NT Government, gave an insightful presentation on the project. She has worked hard to find solutions acceptable to all the traditional owners with the tremendous assistance of Gowan Bush, the community manager. Jackie is undertaking the rehabilitation work by training and employing the local people. As a mother myself, I noted that a female birthing site will be restored by sending a stream back to its original path. Nobody knows whether this will be fully successful but the women are delighted.

My husband Dr. David Jones gave a technical presentation on the Rum Jungle Rehabilitation Project on behalf of NT Government as an Industry Fellow of UQ Sustainable Minerals Institute. https://smi.uq.edu.au/ It is noteworthy that the main source of environmental problems on the site is acid mine drainage with copper levels causing the issues rather than uranium or radioactivity.

The presentations were praised by the head of INAP as a new paradigm for mine rehabilitation. INAP stands for International Network for Acid Prevention and is an organisation set up by the mining industry itself to find, promulgate, and use the best methods of preventing and coping with acid and metalliferous drainage (AMD). AMD can occur with any type of mine depending on the geology of the area.

AMD is one of the most serious and potentially enduring environmental problems for the mining industry. Left unchecked, it can result in such long-term water quality impacts that could well be this industry’s most harmful legacy.”  https://www.inap.com.au/

How do we use coal apart from making electricity?

China uses the most coal in the world with the U.S and India in  a distant second place. The U.S. has 2/3 of the world’s known supply. Australia only mines 4% of the world’s coal but we export 80% of it, making Australia the second largest coal exporter in the world. We export low sulfur bituminous coal for energy production used to manufacture “renewable energy infrastructure” and the highly valued and rarer metallurgical coal, also known as coking coal, to produce steel and cement and critical metals and other ingredients.

There are 4 main types of coal and the world still has 400 years’ supply at our current rate of use.

Peat is the youngest form of coal. It is low quality and is burnt for fuel and heating on a small scale or even used as a soil conditioner by gardeners.

Lignite or Brown Coal is about 150 million years old. It has about 50% carbon and low sulfur content. It is used to produce electricity but is relatively inefficient because it has a high water content and must be dried first. This results in the highest amount of carbon dioxide per unit of electricity produced. The Latrobe Valley Coal mines produce brown coal.

Bituminous Coal has a high carbon content ( 50-80%) but often has a high sulfur content. It is the most plentiful type of coal in the U.S. and is about 300 million years old. Sub-bituminous coal has a lower sulfur content and carbon content and is a little younger.  Sub-bituminous coal is the preferred form for power plants.

Anthracite, often known as Metallurgical Coal. is the highest quality of coal with a high carbon  (95%) but low sulfur content and is about 500 million years old. Australia has large supplies of this form of coal which is valued for all its uses apart from electricity production. There is limited supply worldwide and it almost a sin to burn it up to produce electricity. It is the hardest and cleanest burning coal.

Anthracite is valuable

·        as a source of essential ingredients for the manufacture of many dyes, pharmaceuticals, explosives, perfumes, plastics, paints and photographic materials; and

·        to produce the very high temperatures needed to produce steel, cement, aluminium, bricks, glass and some metals and chemicals. The carbon in anthracite forms part of the matrix of steel.

·        It is used in smelting operations to release metals such as lithium from their ores – a very energy intensive process.

Coal pyrolysis, or destructive distillation, is an old technology that started on a commercial scale during the industrial revolution. When coal is burnt without the presence of oxygen, three main products result: coal gas; coal tar; and coke.

Coal tar is the actual source of the essential ingredients to make many products such as some dyes, pharmaceuticals, explosives, perfumes, plastics, paints and photographic materials.

Various forms of gas can substitute for some of coal’s uses. It can act to stabilise the electricity grid much more efficiently and produces far less carbon dioxide per unit of electricity produced.

Hydrogen and some types of nuclear power may be able replace the high temperatures produced by coal and gas as the technologies mature. The production and use of hydrogen is a very energy inefficient.  

What about Oil? Why Can’t We Stop It’s Use Tomorrow?

Nearly half of a barrel of oil is separated as gasoline/petrol. Slightly more than half is used as feedstock in the manufacture of more than 6000 products.  I found a list of 144 of them.  Just taking one item, combs. Can you imagine making combs the old way from turtle shell or bone? The world’s population has grown so much it is hard to imagine doing without many of the items listed below.  And what do we plan to do with all the waste stream of petrol in the future?

Can we face a world without antibiotics and anaesthetics or hospitals? Imagine there are no building materials except wood or mud or straw, no fertilizers or pillows or candles or ink and no forests or wildlife. We still need coal and oil to produce electric cars.

We have a lot of thinking and planning to do. Imagine a world without any:

SolventsDiesel fuelMotor OilBearing Grease
InkFloor WaxBallpoint PensFootball Cleats
UpholsterySweatersBoatsInsecticides
Bicycle TiresSports Car BodiesNail PolishFishing lures
DressesTyresGolf BagsPerfumes
CassettesDishwasher partsTool BoxesShoe Polish
Motorcycle HelmetCaulkingPetroleum JellyTransparent Tape
CD PlayerFaucet WashersAntisepticsClothesline
CurtainsFood PreservativesBasketballsSoap
Vitamin CapsulesAntihistaminesPursesShoes
DashboardsCortisoneDeodorantShoelace Aglets
PuttyDyesPanty HoseRefrigerant
PercolatorsLife JacketsRubbing AlcoholLinings
SkisTV CabinetsShag RugsElectrician’s Tape
Tool RacksCar Battery CasesEpoxyPaint
MopsSlacksInsect RepellentOil Filters
UmbrellasYarnFertilizersHair Colouring
RoofingToilet SeatsFishing RodsLipstick
Denture AdhesiveLinoleumIce Cube TraysSynthetic Rubber
SpeakersPlastic WoodElectric BlanketsGlycerine
Tennis RacketsRubber CementFishing BootsDice
Nylon RopeCandlesTrash BagsHouse Paint
Water PipesHand LotionRoller SkatesSurf Boards
ShampooWheelsPaint RollersShower Curtains
Guitar StringsLuggageAspirinSafety Glasses
AntifreezeFootball HelmetsAwningsEyeglasses
ClothesToothbrushesIce ChestsFootballs
CombsCD’s & DVD’sPaint BrushesDetergents
VaporizersBalloonsSun GlassesTents
Heart ValvesCrayonsParachutesTelephones
EnamelPillowsDishesCameras
AnaestheticsArtificial TurfArtificial limbsBandages
DenturesModel CarsFolding DoorsHair Curlers
Cold creamMovie filmContact lensesDrinking Cups
Fan BeltsCar EnamelShaving CreamAmmonia
RefrigeratorsGolf BallsToothpasteGasoline
https://www.ranken-energy.com/index.php/products-made-from-petroleum/