Cyclone Alfred was a 1 in 50y event that brought low grade cyclonic winds to southeast Queensland and northern NSW over a period of a week between March 4-11. However, it was the rain and associated flooding after the cyclone crossed the coast that caused the most widespread damage. The multi-day duration of cloud cover that the system brought is the basis of this blog.
Rooftop solar refers to solar panel on roofs, and this is dominated by residential (domestic) installations.
Currently more than 1-in-3 Queensland homes have rooftop solar, the highest rate of any Australian state or territory, with 6 GW having been installed by early 2024. Three quarters of the population of Queensland lives in the southeast corner of the state. Thus, three quarters of the dwellings with rooftop solar are located in this geographic region and account for the great majority of rooftop solar being fed into the grid during the day.
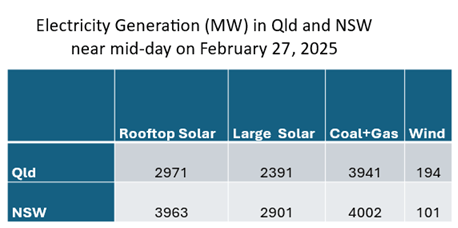
The table below shows the contributions of small (rooftop) and large scale (solar farms) inputs in MW to the Queensland grid in the middle of a typical bright sunny day. The electricity coming from coal and gas, and from wind are included for reference.
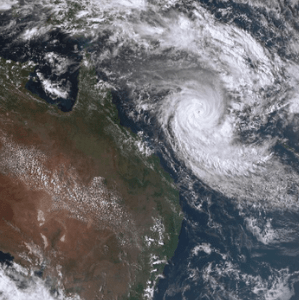
These figures were taken from the NemWatch site on February 27 when the cyclone and associated cloud was well off the coast (satellite image below) and the east coast was largely cloud free. I have also included the comparable figures from NSW for reasons that will soon become apparent.
For both states, solar was making by far the largest contribution to electricity generation.
Satellite Image (source: BOM) on February 27 showing cyclone Alfred and associated cloud well off the east coast.
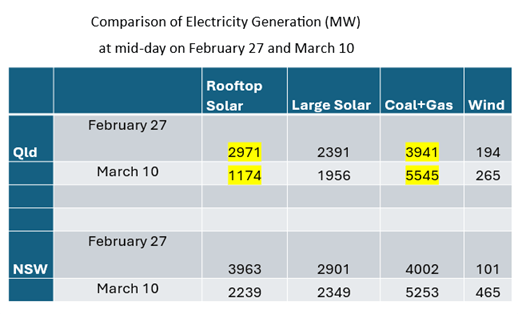
The table below compares the data from February 27 with that at a similar time during the day on March 10 when there was extensive cloud cover over southeastern Qld and northern to central coastal NSW (see satellite image below).
What is immediately apparent from this table is the huge 60% drop (1800MW) in rooftop solar output seen on March 10. There is also an almost 20% drop in the output of large solar, but this is small in comparison. The 2200 MW loss from solar had to be made up by coal and gas generators.
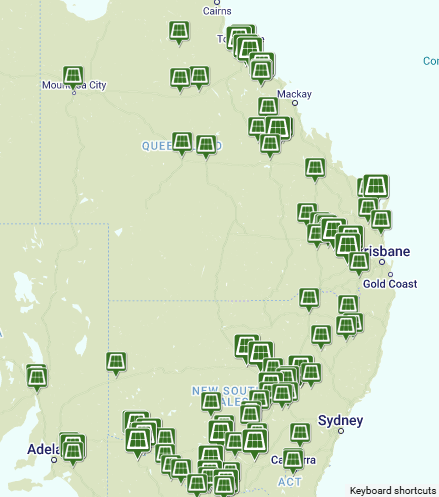
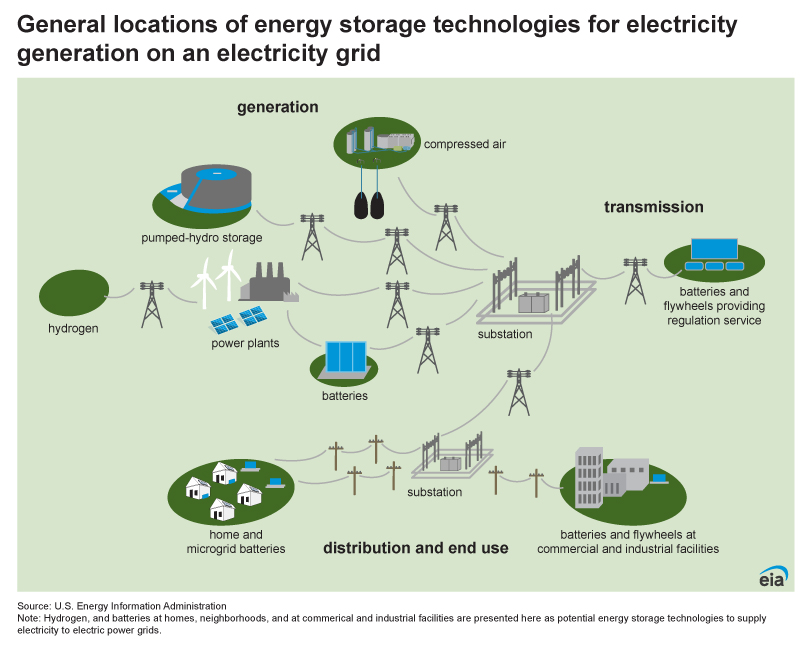
The question is why rooftop solar was impacted so much whereas large solar only suffered a modest decline. The reason is location! The locations of large-scale solar plants down the east coast of Australia are mapped below. What is immediately apparent is that in Queensland most of these are located further inland and north of the cloud covered area.
In New South Wales there was 45% drop in rooftop solar, and a similar 20% drop in large solar. Once again for similar reasons to Queensland where the cloud cover extended down the coast to the Sydney area which hosts the majority of rooftop solar in New South Wales. However, the drop wasn’t as big in Sydney because there was less cloud cover.
Satellite Image (source: BOM) on March 10 showing extent of cloud cover in southeastern Queensland and northern New South Wales.
This rooftop solar drought lasted for several days after Alfred, with coal and gas power continuing to make up the shortfall. Given that there is very little storage for the renewables component of the grid, this highlights the vulnerability of having the bulk of the rooftop solar generating capacity in the one geographic area. Even for those fortunate enough to have battery storage for their rooftop solar, this backup would not have been sufficient to last for the days of cloud cover.
This situation occurred again in March when a broad band of cloud blanketed much of southeastern Queensland for much of the month, extending across eastern New South Wales in the last week of March (satellite image for March 28 below). The solar output figures for Queensland and New South Wales at mid-day on March 28 are compared with the “reference” February 27 outputs below. The almost complete “collapse” of large-scale solar outputs in both Queensland and New South Wales was caused by the cloud extending much further inland in both states, and further north in Queensland than was the case on March 10. In both states, but particularly in NSW, the loss of solar was partly offset by an increase in wind generation.
What this shows is that the concentration of rooftop solar in the large coastal cities of Brisbane and Sydney exposes the vulnerability of the state’s solar generating capacity to cloud cover, especially during the summer season. This situation is likely to be worse in the coming years when it is likely that there will be increased southerly excursions of warm moist air from the tropics. These periods can last for days at a time and highlight the critical need for much more medium and long duration storage to firm even the current penetration of renewable generation.
This is a copy of a Substack article by Robert Hargraves on April 6. The full essay will be posted in several parts. https://substack.com/@roberthargraves1
Abstract
The root cause of nuclear power cost and opposition is excessive fear of radiation. This essay explores true observed radiation, effects, harm, and benefits, summarized here, proven later.
Doesn’t radiation from nuclear power plants causes cancer?
No, its radiation damage rates are slower than biological repair rates.
Isn’t the nuclear waste harmful to future generations?
No, we can store used fuel in ground-level casks as penetrating radiation decays away. You’d then have to eat the waste to get sick.
Don’t nuclear power plants cost too much?
Yes, because regulators’ rules were written using the precautionary principle, not today’s scientific observations.
Full Essay
Radiation is a weak carcinogen. After the WW II atomic bombings of Japan we all feared globally destructive nuclear war. To intensify that fear NGOs and nations exaggerated geneticists’ idea that even trivial amounts of radiation constantly degraded human genes through generations, even to birthing three-eyed monsters. When that fiction was disproven, the radiation fear of choice became cancer.
Governments and regulators strove to protect voters from the vague harm of invisible radiation, creating rules and procedures to keep people away from any radiation from nuclear power. These rules constantly became more strict and cumbersome.
These radiation exposure rules from worldwide regulators such as the US Environmental Protection Agency and Nuclear Regulatory Commission created the problem of high cost and long build times, making new nuclear power too expensive. In reality, nuclear power can be the least expensive reliable energy source, at $0.03/kWh, if we educate the public, politicians, and regulators.
Fear can kill. Radiation from the triple Fukushima nuclear reactor meltdown killed no one, but Japan’s fearful government killed over 1,600 people with hasty, unnecessary evacuations.
Nuclear power optimism is on the rise. Will people return to nuclear fear after the next failure leaks some radioactive material out? Perfection is impossible. Radiation releases will happen. Airplanes do crash. People still fly. They understand authentic risks and benefits.
Two Westinghouse AP1000 nuclear power reactors has been powered up in Georgia. Will these be the last commercial US nuclear power plants?
Radiation fear
Wisdom of a woman awarded two Nobel prizes.
Ionizing radiation harms by displacing electrons, breaking molecular bonds in cells. Radiation dose is measured in Sieverts (Sv) or Grays, which are watt-seconds (joules) of energy absorbed, per kilogram of tissue. These are the effects of intensive, brief absorbed doses of radiation.
10 Sv is deadly,
1 Sv risks non-fatal acute radiation sickness,
0.1 Sv slightly increases future cancer risk.
Regulators mistakenly claim any radiation exposure is potentially harmful, so set unreasonably low limits, hoping to calm fearful people. Media headlines frighten people about any radiation leaks, no matter how small, in order to gain attention with headlines.
Nuclear power growth, now in vogue, will end with the next radiation release unless we replace today’s regulators with institutions that balance benefits against quantified radiation doses and observed effects.
The near century of concessions lowering 1934 radiation limits from 0.002 Sv per day to 0.001 Sv per year has not reduced harm. Lowered limits have increased public fear, along with evidence-free rulings that all radiation is potentially fatal.
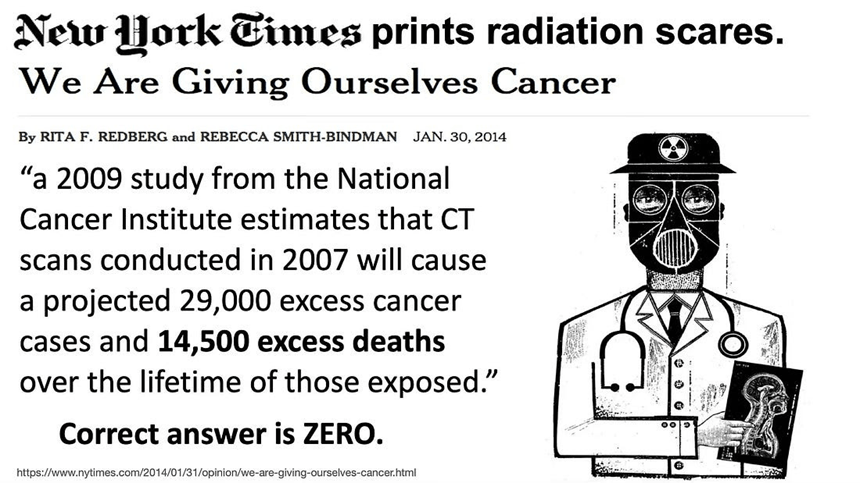
Newspapers often highlight unsubstantiated claims of radiation harm, such as this New York Times fright about CT scans, “a 2009 study from the National Cancer Institute estimates that CT scans conducted in 2007 will cause a projected 29,000 excess cancer cases and 14,500 excess deaths over the lifetime of those exposed.” The correct number is likely zero.
Atomic bomb survivors
After the 1945 atomic bombing of Hiroshima and Nagasaki, people and nations became concerned about the destruction of possible world-wide nuclear war. In 1950 began a studies of the health of the atom bomb survivors. The work was undertaken to make people more aware of the possible long term effects of radiation on genetics, and to increase fear of nuclear warfare. The Radiation Effects Research Foundation (RERF) maintains the data and publishes papers that explore linkages between cancer and radiation exposure. Radiation doses, by individual, were estimated after asking people where they were at the time of the bomb explosions, five years before.
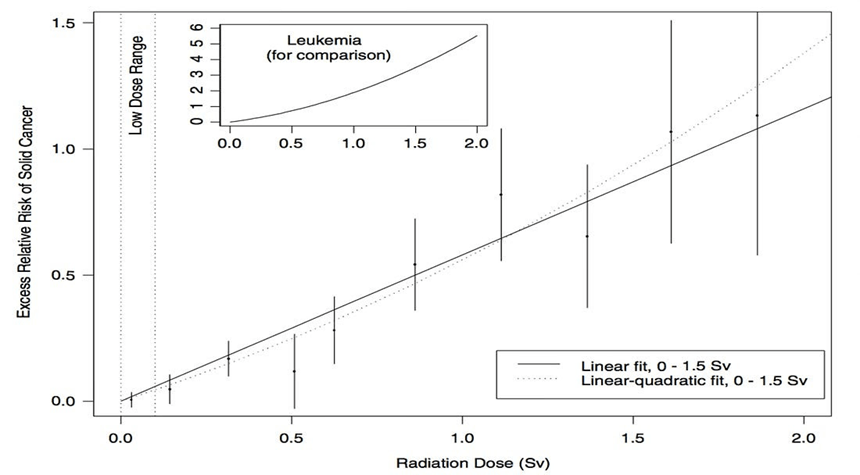
The US National Academies used REFR data to claim that the risk of solid cancer is directly proportional to absorbed radiation dose. They promote the LNT (linear no threshold) model of health effects of radiation, which maintains the chance of cancer is directly proportionate to radiation exposure, and thus there is no safe dose of radiation. They published this following chart of cancer risk for bomb survivors.
Excess cancer risk for people irradiated by the atomic bomb
However, the data point in the low dose range of exposures less than 0.1 Sv does not show evidence that such low doses case cancer. Few in the radiation science community endorse this LNT model of low dose radiation effects, but LNT remains the official policy of the US EPA, NRC, and many other organizations in the radiation protection industry.
National Council on Radiation Protection hides data refuting LNT.
A 2001 article by Jaworowski and Waligorski illustrated how many scientists were misinforming governments with information tailored to continue the simplistic LNT model. They misled people into fearing that even low level radiation was potentially deadly. The right side of their graphic shows the NCRP’s (National Council on Radiation Protection) seemingly linear relationship between leukemia mortality and radiation exposure for survivors of the atomic bombing, evidencing their support for LNT.
The left hand side shows the UNSCEAR (United Nations Scientific Committee on the Effects of Atomic Radiation) with much more detailed information about the effects of low dose radiation. There is clearly no evidence of increased leukemia mortality from radiation doses under 0.1 Sv (100 mSv). Clearly the LNT model is wrong.
A-bomb survivors’ exposures < 0.1 Sv caused no excess cancers.
The chart above uses bomb survivor cancer data to display that cancer rate increases from radiation, if any, are unobservable at doses < 0 .1 Sv. The leftmost, blue bar represents residents who happened not to be in the cities when the two atomic bombs exploded.
Part 2 will discuss regulation of nuclear facilities
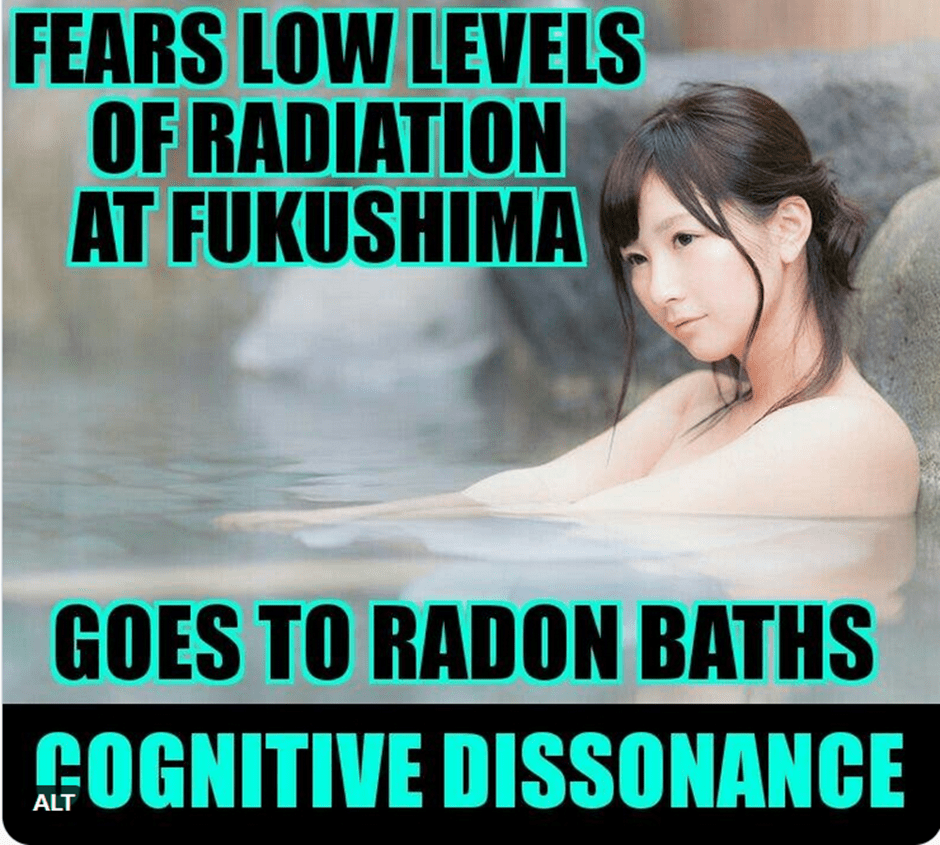
Germany has more radon baths than any other country. Yet they fear nuclear power plants. They closed them down and opened up coal mines knocking down ancient forests in the process. Medical benefit payments are paid out to people who attend the radon spas for relief of muscular-skeletal ailments. The medical fraternity warns of the dangers of radon yet people in pain still seek relief.
People have been using radon baths for thousands of years. Low dose radiation seems to lessen the pain and immobility of osteoarthritis. But not every patient benefits.
Many studies have shown that the more low dose radiation a population receives, the less cancer there is in the population. This effect is known as hormesis. I can also find studies that state that low dose radiation causes cancer.
Is anything black or white or just shades of grey? Is anybody totally truthful? We all have our biases. To get a message across about cognitive dissonance I wrote “Low Dose Radiation is not Harmful and May Even Be Good for Us!Nobody Died from Radiation at Fukushima”
But panic and fear of radiation caused the unnecessary deaths of over a thousand Japanese people following the evacuation.
Every decision we make in life rests on our perception of the risk involved versus the benefits. That balancing act changes with circumstances. For example, the amount of radiation used for cancer treatment is huge. None of us would want to receive that much in ordinary circumstances. A medical specialist tells us it is our best chance of beating deadly cancer and we accept the treatment for 2 reasons. Firstly, the radiation will be applied under very controlled conditions to a limited area. Secondly, the whole balance of the situation has changed.
A few years ago, I didn’t agree that Australia should have a nuclear power industry. Did we plan long term enough? Did we plan carefully? Were we just too Gung-ho?
I am now watching the destruction of Australia’s wonderful unique biodiversity as we lose forest and mountain ridges to wind turbine projects in Queensland in the “fight against climate change”. Is the balance, right? Do we have to destroy nature to save the planet?
Ecologists, Barry W. Brook and Corey J. A. Bradshaw ranked 7 major electricity-generation sources (coal, gas, nuclear, biomass, hydro, wind, and solar) based on costs and benefits. They published a paper in 2014 called: Key role for nuclear energy in global biodiversity conservation. https://conbio.onlinelibrary.wiley.com/doi/full/10.1111/cobi.12433.
This study still stands out. It used multicriteria decision-making analysis and ranked 7 major electricity-generation sources based on costs and benefits. It then tested the sensitivity of the rankings to biases stemming from contrasting philosophical ideals. Irrespective of weightings, nuclear and wind energy had the highest benefit-to-cost ratio.
The Integrated Life-cycle Assessment of Electricity Sources undertaken by the United Nations Economic Commission for Europe which concentrated on Carbon Neutrality in the UNECE Region has been extensively quoted by Oscar Martin on LinkedIn. https://digitallibrary.un.org/record/4020227?ln=en&v=pdf
Nuclear scored far better than wind power (and all other electricity generation types) on nearly all rankings with the exception of water use and of course radiation. Public and occupational exposures to radiation from electricity generation was far higher from coal and even geothermal systems than from conventional nuclear power plants. Likewise, every other of 22 assessed electricity generation types were more carcinogenic than conventional nuclear power.
Potential impacts such as specific biodiversity-related impacts, noise or aesthetic disturbance were not assessed under the land use analysis. Nuclear had the lowest lifecycle impacts on ecosystems, followed by various forms of wind and solar power. Under the land use assessment, renewable technologies were assumed to be readily built on various land types without heavy modifications such as land sealing, mountaintop removal, and flooding.
The assessment of land use which was used in the assessment of ecological impact for wind projects only considered the directly disturbed land (turbine pads, access roads) and assumed the surrounding land could be used for other purposes such as agriculture. For disturbed forests this leads to massive underestimation of the impact. Research in far northern Queensland is finding that impacts from wind turbines on some species in forests can extend 3 km or more from a turbine.
Nature is doing over half the work of reducing carbon dioxide levels worldwide. We can save nature and the planet. With a carefully planned mix of nuclear and other energy sources, we can preserve our biodiversity.
Yes, nuclear power is not 100% safe and clean. Nothing ever is. The benefits to humanity and nature are too great to ignore and far greater than the risk.
This is the fourth in a basic series about electricity written by Dr David Jones.
The 80% renewable electricity target by 2030 cannot be achieved unless there is sufficient storage in place for the output of variable renewables.
When you think about it, storage has always been a primary issue for electricity generation. In the case of coal there has always needed to be sufficient coal in bunker storage at a power station to feed the furnaces. Coal is a concentrated form of “solar energy” that was captured by plant photosynthesis many millions of years ago – so it is a form of energy storage. Likewise with gas.
As Australia transitions towards a planned renewables-based electricity generating system it will be critical to have sufficient storage to maintain power supply during periods when intermittent primary generation sources are not producing power. Shutting down existing dispatchable, fossil-fuelled generation before the required storage is in place will likely lead to frequent, unpredictable, widespread blackouts.
As discussed in a previous instalment, solar PV (especially rooftop solar) has a low capacity factor since electricity is only produced when the sun is shining. Let’s assume for simplicity that large scale solar PV with a capacity factor of 30% is the only source of generation. Electricity is produced during an 8h daytime window. What about the rest of the 24h period?
To ensure that sufficient electricity is produced for a 24h period, “surplus” electricity needs to be produced and stored during the day, for use during the dawn and dusk periods and through the night. This means that more than 3 times, over and above the daytime requirement, needs to be produced and stored. Thus, a 300MW nameplate capacity solar farm would be needed to produce 100MW, averaged over the 24h period, with sufficient storage.
The situation is more complicated with wind because of its intermittent nature, noting that the average capacity factor of an onshore windfarm in Australia is about 35%. However, in contrast to the regular and predictable day/night cycle for solar, wind is typically quite variable. So even with overbuilding x3 to allow for the capacity factor, if there is no wind (be it day or night) there will be no power produced.
So, we are going to need storage and LOTS of it, if our current electricity system is going to function with 80% renewables by 2030. What are we looking at for 2030 and how much more is going to be needed between now and then, and beyond?
Australia’s total current storage capacity is only 3GW. Current forecasts by the Australian Energy Market Operator (AEMO) show Australia will need at least 22GW by 2030 – a more than 7 fold (700%) increase in capacity in the next six years.
In my next instalment I will be taking a closer look at the main options that are being proposed for large scale storage – pumped hydro and batteries – and the challenges associated with them.
Burning coal to produce electricity is a terrible waste when coal has so many other important uses. At this time, the energy from it is still essential for the manufacture of wind turbines, transmission lines and solar panels.
It is not always realised that coal is needed:
as a source of essential ingredients for the manufacture of many dyes, pharmaceuticals, explosives, perfumes, plastics, paints and photographic materials; and
to produce the very high temperatures needed to manufacture steel, cement, aluminium, bricks, glass and some metals and chemicals.
Latrobe Valley, Victoria, Australia
A few weeks ago, David and I attended a conference in the Latrobe Valley held by CRC TiME called “Bridging Diverse Interests”. https://crctime.com.au/ When a coal mine or any mine is closed down, a complex rehabilitation process follows. Delegates at the conference had the opportunity to visit both Hazelwood and Yallourn brown coal mine and power station sites.
The Latrobe Valley mines are large, close together, close to local communities and infrastructure. The power stations have a small footprint on each mine site. Mine Land Rehabilitation Authority
Hazelwood Power Station and its associated coal mine stopped operating in 2017. The owner, French company Engie plans to spend a billion dollars rehabilitating the mine site by filling the giant mining pit with water. The volume needed will be greater than that of Sydney Harbour. The plan is still under discussion by many stakeholders. We heard from some of the community groups about their hopes for the site. The closure has already had a big impact on local townships and the staff who lost their jobs. Three years after the closure, a survey found these highly skilled workers were still only earning an average of 50 % of the income received prior to the closure. Questions remain about the feasibility of the rehabilitation plan. Enough water may not be available and contaminant levels in the ash have been highlighted by a green group as a possible long-term issue.
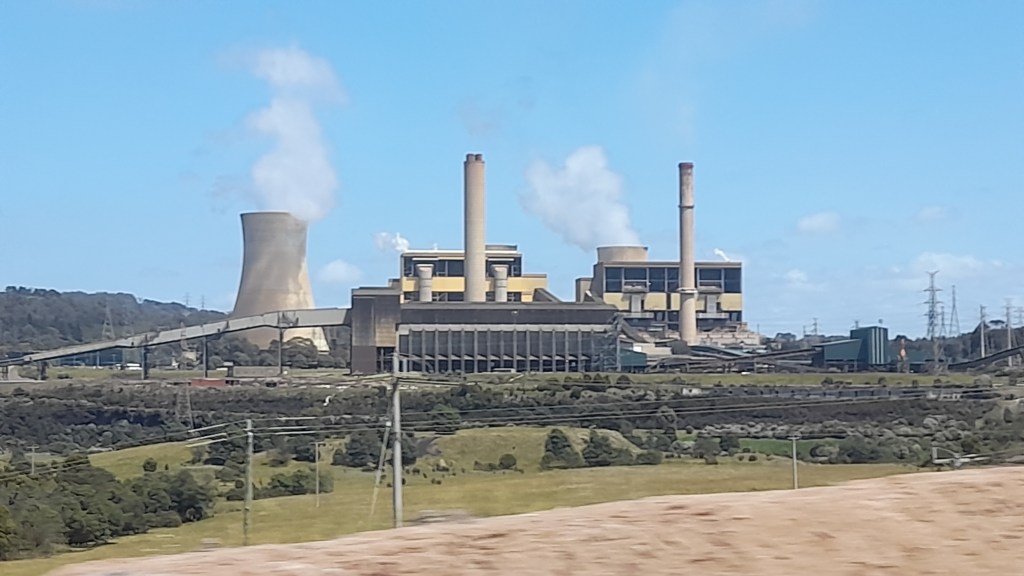
Yallourn Power Station – photo by David Jones
Yallourn is scheduled to close in 2028. River water, currently used by the power station for cooling, will be used to fill the pit. It will take decades. The ground is soft, like the brown coal itself, and collapse of the sides of the pit must be carefully avoided. The ash is low in contaminants and should not pose a problem with water quality. Often there is disparity between the requirements of the regulators, the local community, the First Nations People and the technical and economic considerations of the miners. Just because the community desires a certain outcome, it may not be technically possible and safe.
Yallourn Coal Mine: the coal seam is 80 metres thick and can be seen in the background. Lines of trees have been planted in the bottom of the pit. Photo by David Jones
The third power station, Loy Yang, and its associated mine is also scheduled for closure in 2035 bu.
What is the future of the Latrobe Valley? Will it be left with lots of orphaned transmission lines and closed businesses, medical facilities and schools? This will happen unless viable solutions developed in consultation with regional communities are identified and implemented. It has been suggested in other forums that coal-fired power stations could be replaced by nuclear power stations thus making use of these industrial sites and transmission infrastructure, while providing similar jobs for the already skilled workforce. Participants I spoke to from other places in Australia were pro-nuclear but locals were wary. The social licence was not there because of a historical distrust of Government processes. Technically the sites would need to be evaluated for ground stability.
A central theme of the conference was that First Nations People should be properly and fully involved early in the process of planning mine closure.
Mining Rehabilitation
The NT Government is working in partnership with the Australian Government and Traditional Owners to rehabilitate the former Rum Jungle Uranium Mine Site. Early rehabilitation work was undertaken in the 80s and the traditional owner groups were not involved in the process. The site does not meet today’s standards. The current project will remove a major impediment to the site’s return in good order to the Kungarakan and Warai people.
The inspirational project leader, Jackie Hartnett of NT Government, gave an insightful presentation on the project. She has worked hard to find solutions acceptable to all the traditional owners with the tremendous assistance of Gowan Bush, the community manager. Jackie is undertaking the rehabilitation work by training and employing the local people. As a mother myself, I noted that a female birthing site will be restored by sending a stream back to its original path. Nobody knows whether this will be fully successful but the women are delighted.
My husband Dr. David Jones gave a technical presentation on the Rum Jungle Rehabilitation Project on behalf of NT Government as an Industry Fellow of UQ Sustainable Minerals Institute. https://smi.uq.edu.au/ It is noteworthy that the main source of environmental problems on the site is acid mine drainage with copper levels causing the issues rather than uranium or radioactivity.
The presentations were praised by the head of INAP as a new paradigm for mine rehabilitation. INAP stands for International Network for Acid Prevention and is an organisation set up by the mining industry itself to find, promulgate, and use the best methods of preventing and coping with acid and metalliferous drainage (AMD). AMD can occur with any type of mine depending on the geology of the area.
“AMD is one of the most serious and potentially enduring environmental problems for the mining industry. Left unchecked, it can result in such long-term water quality impacts that could well be this industry’s most harmful legacy.” https://www.inap.com.au/
How do we use coal apart from making electricity?
China uses the most coal in the world with the U.S and India in a distant second place. The U.S. has 2/3 of the world’s known supply. Australia only mines 4% of the world’s coal but we export 80% of it, making Australia the second largest coal exporter in the world. We export low sulfur bituminous coal for energy production used to manufacture “renewable energy infrastructure” and the highly valued and rarer metallurgical coal, also known as coking coal, to produce steel and cement and critical metals and other ingredients.
There are 4 main types of coal and the world still has 400 years’ supply at our current rate of use.
Peat is the youngest form of coal. It is low quality and is burnt for fuel and heating on a small scale or even used as a soil conditioner by gardeners.
Lignite or Brown Coal is about 150 million years old. It has about 50% carbon and low sulfur content. It is used to produce electricity but is relatively inefficient because it has a high water content and must be dried first. This results in the highest amount of carbon dioxide per unit of electricity produced. The Latrobe Valley Coal mines produce brown coal.
Bituminous Coal has a high carbon content ( 50-80%) but often has a high sulfur content. It is the most plentiful type of coal in the U.S. and is about 300 million years old. Sub-bituminous coal has a lower sulfur content and carbon content and is a little younger. Sub-bituminous coal is the preferred form for power plants.
Anthracite, often known as Metallurgical Coal. is the highest quality of coal with a high carbon (95%) but low sulfur content and is about 500 million years old. Australia has large supplies of this form of coal which is valued for all its uses apart from electricity production. There is limited supply worldwide and it almost a sin to burn it up to produce electricity. It is the hardest and cleanest burning coal.
Anthracite is valuable
· as a source of essential ingredients for the manufacture of many dyes, pharmaceuticals, explosives, perfumes, plastics, paints and photographic materials; and
· to produce the very high temperatures needed to produce steel, cement, aluminium, bricks, glass and some metals and chemicals. The carbon in anthracite forms part of the matrix of steel.
· It is used in smelting operations to release metals such as lithium from their ores – a very energy intensive process.
Coal pyrolysis, or destructive distillation, is an old technology that started on a commercial scale during the industrial revolution. When coal is burnt without the presence of oxygen, three main products result: coal gas; coal tar; and coke.
Coal tar is the actual source of the essential ingredients to make many products such as some dyes, pharmaceuticals, explosives, perfumes, plastics, paints and photographic materials.
Various forms of gas can substitute for some of coal’s uses. It can act to stabilise the electricity grid much more efficiently and produces far less carbon dioxide per unit of electricity produced.
Hydrogen and some types of nuclear power may be able replace the high temperatures produced by coal and gas as the technologies mature. The production and use of hydrogen is a very energy inefficient.
What about Oil? Why Can’t We Stop It’s Use Tomorrow?
Nearly half of a barrel of oil is separated as gasoline/petrol. Slightly more than half is used as feedstock in the manufacture of more than 6000 products. I found a list of 144 of them. Just taking one item, combs. Can you imagine making combs the old way from turtle shell or bone? The world’s population has grown so much it is hard to imagine doing without many of the items listed below. And what do we plan to do with all the waste stream of petrol in the future?
Can we face a world without antibiotics and anaesthetics or hospitals? Imagine there are no building materials except wood or mud or straw, no fertilizers or pillows or candles or ink and no forests or wildlife. We still need coal and oil to produce electric cars.
We have a lot of thinking and planning to do. Imagine a world without any: