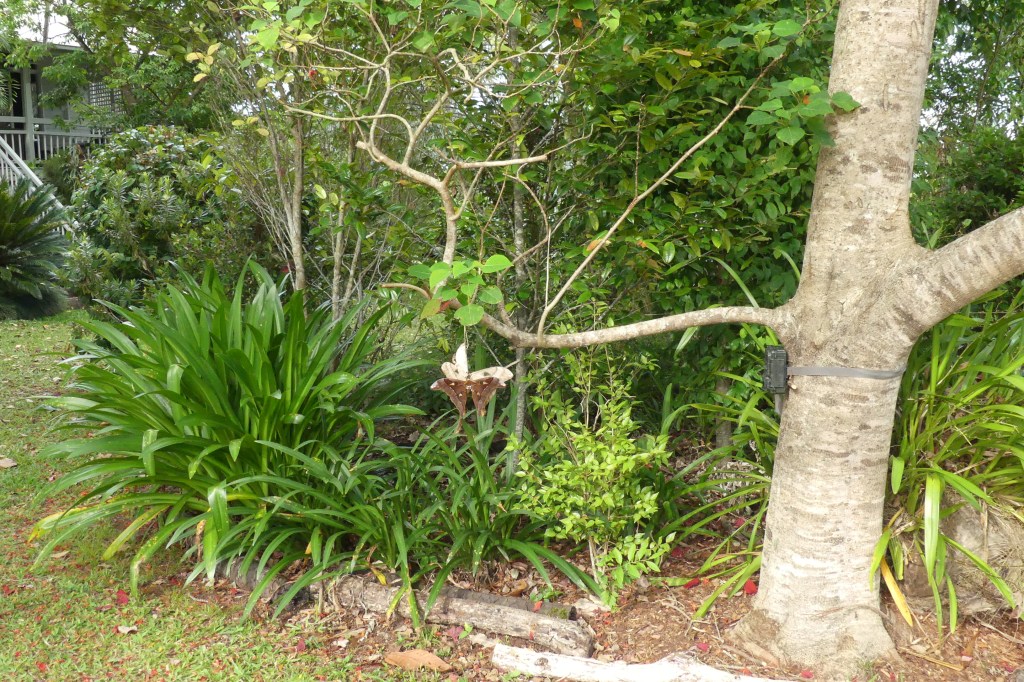
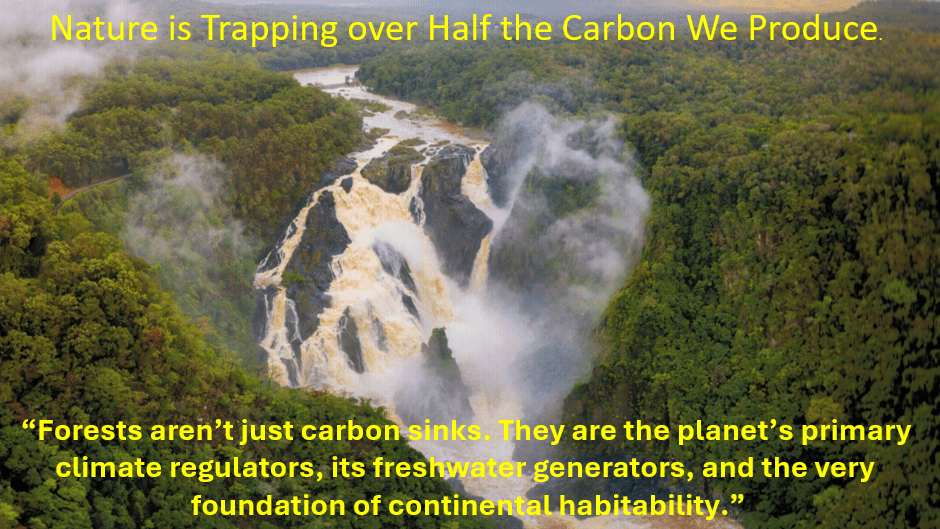
“Here is the uncomfortable truth: Even if we zeroed out carbon emissions tomorrow—a goal certainly worth pursuing—without massive ecological restoration the climate emergency would persist. Forests aren’t just carbon sinks. They are the planet’s primary climate regulators, its freshwater generators, and the very foundation of continental habitability.” Antonio Donato Nobre
We must not degrade native biodiverse forest in Australia for any reason no matter how persuasive the argument seems. We must do all we can to restore and preserve it!
This blog is an adaptation of a short talk I gave at the Cairns & Far North Environment Centre (CAFNEC) Round Table in November 2025.
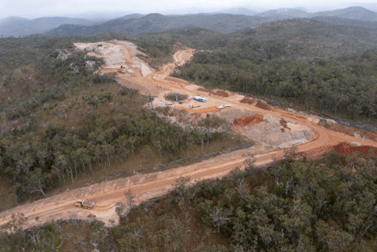
Picture by Stephen Nowakowski of the Barron River Falls and the surrounding forest.
Forests do a lot of heavy lifting. But what is happening to tropical forests around the world?
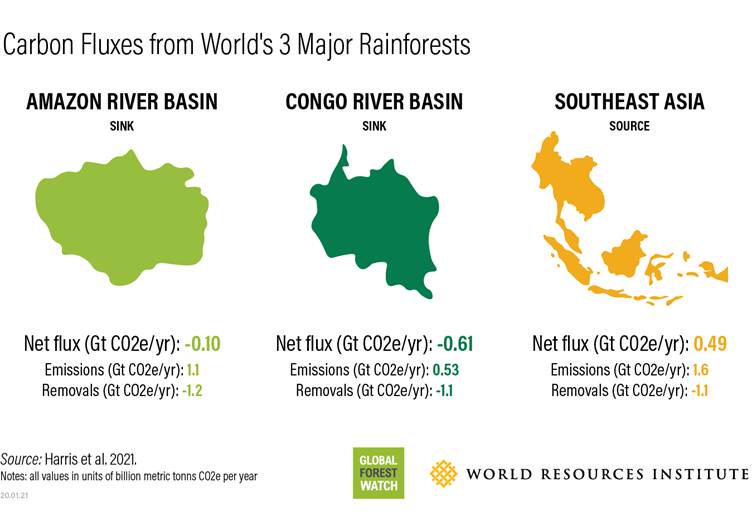
Looking at the 3 most important tropical forests around the world, the Amazon Basin is now at a tipping point as a carbon sink. It is barely sequestering more carbon than it produces. The Congo River Basin is still functioning as a net sink despite high levels of clearing. Sadly, South East Asia is now a net carbon producer. A reminder that the carbon emissions from these areas would be much greater without the intact biodiverse forest that still remains.
What about Australia? Recent studies indicate that our tropical forests may reach a tipping point due to various types of disturbance and damage. Unfortunately, the land of south eastern Queensland has already become a net carbon source. Friedlingstein et al 2024; Global Carbon Project 2024
Net Zero Protocols and Targets
Australia, as did over 100 countries around the world, took on the protocols and targets set by the UN. Each country has been reporting its carbon emissions to the UN according to this plan. This year, only half of these same countries are going to COP30 with the same promises to meet Net Zero Targets. This UN approach to fighting climate change and adopted by Australia is summarized in the diagram below. It is copied from https://www.netzero.gov.au/net-zero. It is my emphasis that has been placed on the word we.
Just how effective is this anthropogenic approach? Well, the world adds a net 5.2 Gt of C to the atmosphere each year.
This diagram illustrates just what is being rewarded under the Net Zero protocol approach. Yet the land with its forests removes 3.2 GtC each year. Millions and millions of dollars have been pumped into the second two technologies for years now and maybe, just maybe, they may eventually have a real effect on carbon emissions. But, in the meantime, we destroy the very thing that it actually working hard for us.
Under the Net Zero protocols, biodiverse forest is not really counted or rewarded.
An example, after a bushfire, if the fire was not too hot, the forest will regenerate and even would benefit from a little help – no reward. But, if the area is cleared and a plantation is developed, the developer can get lots of saleable carbon credits. The former may continue to sequester carbon for little or no cost and keep doing so for thousands or even millions of years. The latter costs more money, sequesters carbon really well for a generation or so but may end up as a zero-sum game.
If good quality biodiverse forest is knocked down, the carbon accounting systems only records a small penalty for change of land use, but little or no accounting is made for the loss of sequestration that would have continued for hundreds of years.
Why are our Forested Areas becoming Net Carbon Sources Instead of Net Carbon Sinks?
This classic diagram provides a hint.
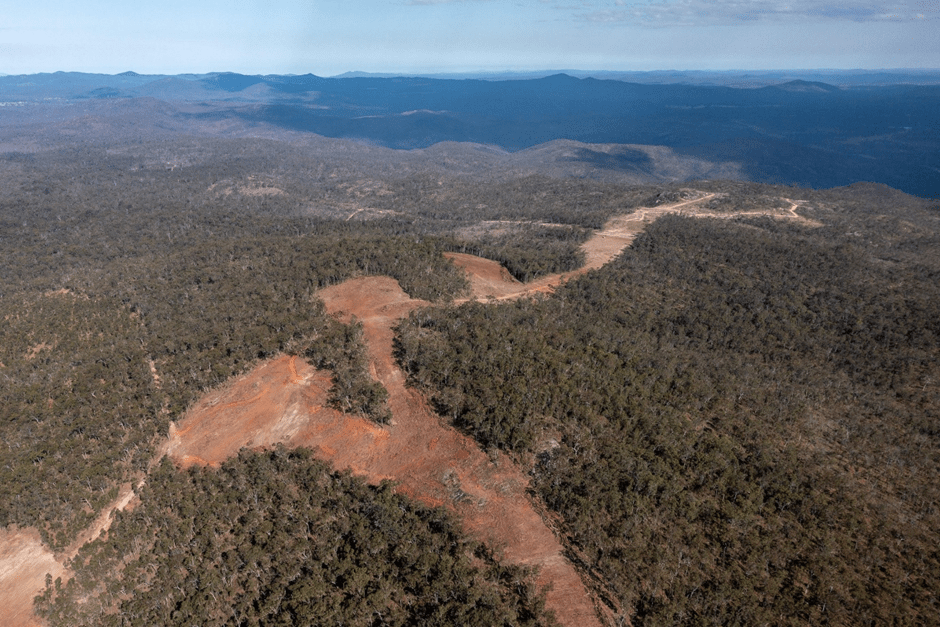
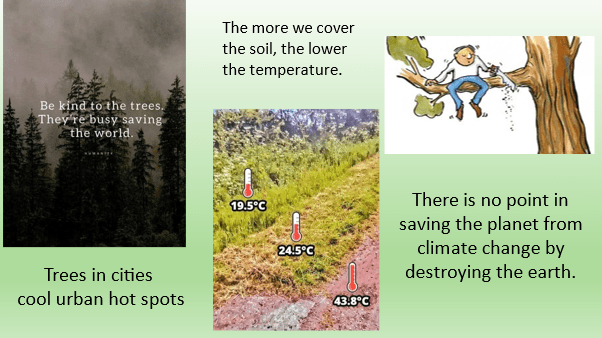
A biodiverse forested area is a living ecosystem. When too much disturbance happens, the tipping point can occur well before 50% disturbance occurs. In Australia, wind turbines are being built by destroying mountain top forest. The impacted area is far greater than the area cleared. The clearing changes micro weather patterns. Uncovered soil is hotter and the surrounding soil and forest also dries. The mists that used to form on the mountain tops become less frequent and the vegetation changes, becomes more fire-prone, invasive species seize the opening, the biodiversity changes and bats no longer pollinate the trees and spread seeds.
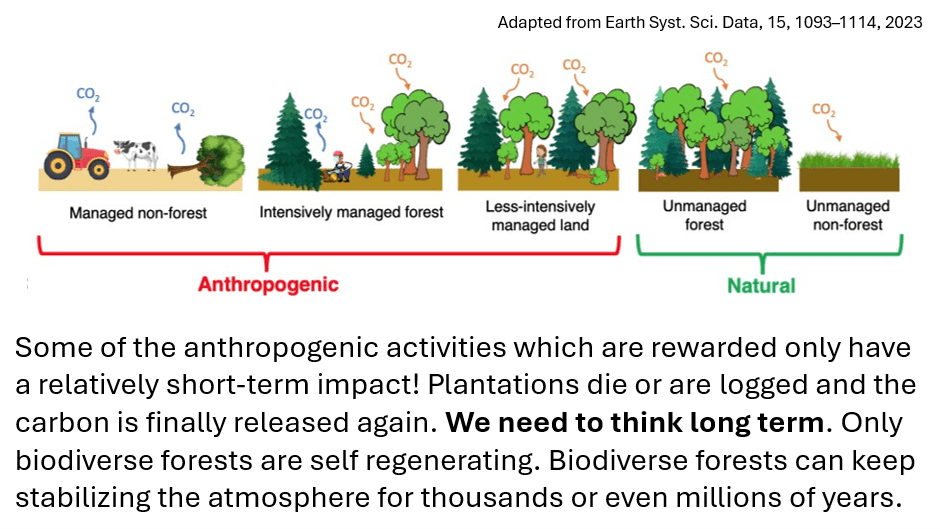
Basically, we are rewarding anthropogenic activities that only last for a generation or two. We must start thinking long term. The following diagram shows the sorts of activities that are rewarded. We ignore the “natural” and even give little weight to the less intensively managed forest.
Biodiverse Forests are More than Simply Carbon Sinks
I found some wonderful words by a retired Brazilian scientist who has summarised the issues so eloquently. I presented some of his words in my presentation in 2 slides as shown below.
Currently, our land with its forests and other vegetation removes a massive 30% of our carbon emissions every year. Unless natural carbon removal processes are maintained, we have no chance of ever restoring carbon dioxide levels in our atmosphere to tolerable levels.
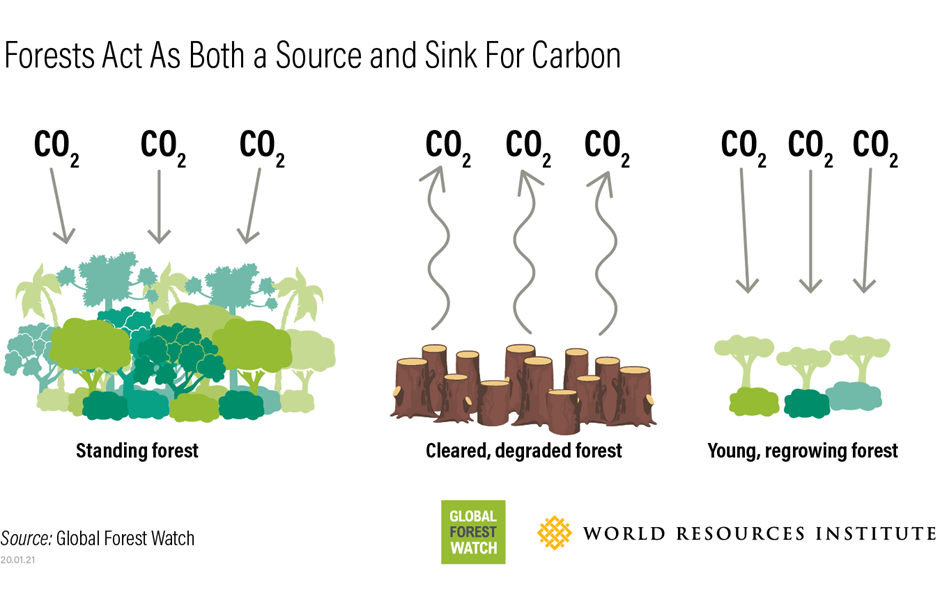
The classic diagram below is misleading in that it is too simple. The “young growing forest” in the third panel is shown as sequestering more CO2 than the “standing forest” or natural forest. This is initially true but depending on its origin and future, the young growing forests can end up as a net carbon sources or at best carbon neutral.
There are two main groups of “young growing forests”: plantations and regrowth forest. If regrowth forest survives long enough and is ecologically diverse enough, it can take on the characteristics of older forests when it reaches an equilibrium between death and decay and natural tree replacement.
Old-Growth Forests Store Carbon Differently
When it comes to fighting climate change with forests, it’s easy to think all trees are equal. This thinking has led to simple approaches that focus on tree numbers rather than the complexity of the forest. However, science tells a different story: old-growth forests and tree plantations store carbon in distinct ways, and this matters significantly for climate action.
Old-growth forests are sophisticated carbon storage systems that have been built over hundreds or even thousands of years. There are trees of different ages, sizes, and species, creating a complex living structure. This diversity is crucial for storing carbon. Trees do die but they are replaced, and the system reaches a wonderful equilibrium which continually sequestered carbon. The massive tree trunks in old-growth forests represent centuries of carbon buildup. A single large tree can capture as much carbon in one year as an entire medium-sized tree contains in its whole body. In some forests, large trees make up just 6% of all trees but account for 33% of the forest’s yearly growth. This shows why size matters when it comes to carbon storage.
Most importantly, old-growth forests continue to store carbon in many different ways and places. Above ground, carbon is locked in living trees, dead standing trees, and fallen logs that take decades to break down. Below ground, massive root systems and centuries of built-up soil create huge underground carbon vaults. This multi-layered storage system provides both capacity and strength.
Many of Australia’s native forests are younger remnant forests but these forests are also living ecosystems and actually work nearly as hard for us, not just by sequestering carbon and preserving our biodiversity but by helping to cool our land through evapotranspiration and shading and forming a critical part of the water cycle. Forests can store a lot of water, helping to mitigate floods, seed clouds and clean water.
Do Plantations Mitigate Climate Change?
Plantations are typically planted with a single species all at the same time. Plantation forests can remove between 4.5 and 40.7 tons of CO2 per hectare per year during their first 20 years of growth. However, they all reach maturity together and die together, throwing all that carbon back into the atmosphere if they are not logged first. Depending on the use of those forestry products a little of the carbon may be stored for a few decades. Thus, plantations end up carbon neutral at best having achieved no long-term benefits.
Unfortunately, the carbon accounting and reward systems in Australia encourage the use of plantation type forests after bush fires rather than assisting the natural but slower reforestation processes. Some of these decisions are influenced by the severity of the fires. This again emphasises the importance of doing everything we can to fight all wildfires as quickly and efficiently as possible.
What Happens If Forests Stop Absorbing Carbon? Ask Finland
In a country of 5.6 million people with nearly 70% covered by forests and peatlands, many assumed the plan would not be a problem.
For decades, the country’s forests and peatlands had reliably removed more carbon from the atmosphere than they released. But from about 2010, the amount the land absorbed started to decline, slowly at first, then rapidly. By 2018, Finland’s land sink – the phrase scientists use to describe something that absorbs more carbon than it releases – had vanished.
Finland’s forests were mostly planted after WW2. In other words, they are mainly plantation forests. Commercial logging of forests – including rare primeval ecosystems formed since the last ice age – has increased from an already relentless pace, now making up the majority of emissions from Finland’s land sector.
Higher temperatures are causing the peat to break down and release CO2.
It has been suggested that by reducing the amount of logging and better management of their forests, the situation could be turned around. However, Finland’s Finance Ministry estimates that harvesting a third less would reduce GDP by 2.1%.
Finland is now forced to reduce its emissions by other means and won’t reach its Net Zero Target any time soon.
Are Australia’s Tropical Forests Becoming Net Carbon Sources?
An October 2025 paper published in Nature looking at Australian moist tropical forests used half a centuries’ data on above ground biomass as a measure of carbon sequestration. The above ground biomass was determined by measuring the girth and the height of every tree in each plot.
The study reported that a transition from carbon sink (0.62 ± 0.04 tonnes C /ha/ yr: 1971–2000) to carbon source (−0.93 ± 0.11 tonnes C /ha/ yr: 2010–2019) had occurred. https://doi.org/10.1038/s41586-025-09497-8
Standing carbon stored in the trees dropped almost 30% to about 200 tonnes of carbon/ha yet these Australian forests continue to be among the most carbon-dense terrestrial ecosystems on the planet as well as harbouring a very high proportion of Australia’s remaining biodiversity.
The trees are only living half as long. Death rates have doubled. Degradation has been caused by cyclones and high winds, invasive species, higher temperatures and loss of soil moisture. Canopy leaves die in hot dry weather. There has also been a change in fire regimes. Loss of pollinating species such as the spectacled flying fox means that there are less seeds to regenerate the forests. Clearing and fragmentation of the forest in earlier years left the forest more vulnerable.
Importantly, in this particular study other vegetation was excluded as was carbon stored below ground in the soil and plant roots. However, luckily this forest is still a net sink when biomass underground is considered. Could that change?
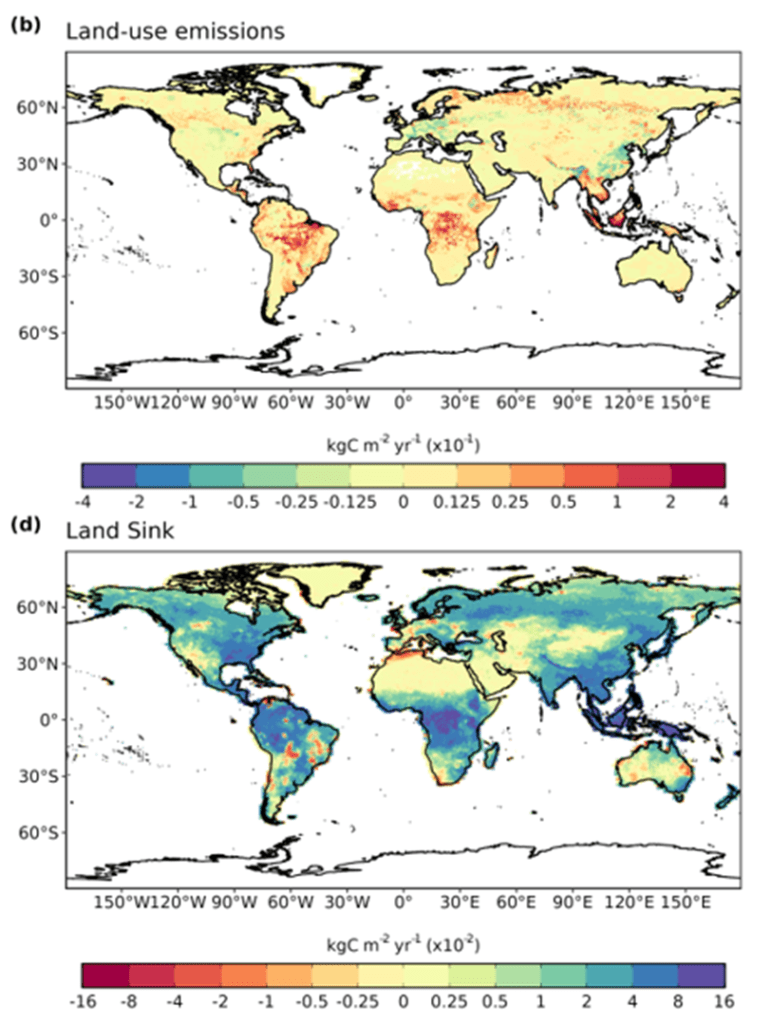
The World’s Land Sinks and Sources in 2024
Ref: Global Carbon Project Carbon Budget 2024 slides
Note that the land of southern Queensland, despite its remaining forest, is now a carbon source.
Many areas around the world are close to a tipping point.
The Amazon basin is showing many areas of stress, the most important natural forest areas of the world. The upper Amazon River and tributaries dried out for the first time in recent years.
A wrecked canoe lies in the dry bed of the Amazon River near San Augusto, Peru. IMAGE CREDIT: Plinio Pizango Hualinga/Rainforest Foundation US
How Much Degradation Can a Forest Take Before Becoming a Net Carbon Source?
An intact native forest will be a carbon sink.
A disturbed forest may be a carbon sink or a carbon source depending on the nature and amount of disturbance. A forest can become a net carbon source long before being totally degraded. For example, in 2025 the Amazon Basin has now been degraded to the extent that it has become a net source rather than a net sink.
A badly degraded forest is a carbon source.
As temperatures climb, and land dries out, is there a tipping point? Of course there is!
It is not necessary to clear large areas within a forest to start it along the path to its tipping point. Studies in the Amazon basin have shown that clearing a little land in the middle of forest can dry out the soil for up to 3 km away. This has an effect on the water cycle and over time the damage gradually extends further and further into the forest.
Despite man’s disruption of some of our most important forests and increasing CO2 levels, nature has continued to remove 30 % of the carbon emissions we produce. Signs of strain are now showing. The oceans are not taking up quite the same amount that they were. The major tropical forests have sink areas but increasing source areas and the balance between sink and source is changing.
However, these forests still store hundreds of billions of tonnes of carbon.
Unfortunately, the current Net Zero protocols reward the creation of plantation forests at the expense of ecologically diverse established native forests. There is little reward for maintaining and looking after real forests. It is seen as beneficial to degrade forest to build short term mitigation structures, not considering the long term effects. We are neglecting the natural world by concentrating too much on economic drivers. Even less-intensively managed land has been made a poorer cousin.
Adapted from Earth Syst. Sci. Data, 15, 1093–1114, 2023
What Will Happen to the World if Nature Stops Being a Net Carbon Sink?
We do need to cut emissions. It is not the basic concept of Net Zero that is the problem. It is how it is being implemented. We need a new way forward!
As temperatures climb, and land dries out, is there a tipping point? Of course there is!
Unfortunately, the current Net Zero protocols give the biggest rewards for the least effective behaviour.
How much more can we threaten our Australian forests before they crash and the eastern states become drier and drier and even hotter than necessary?
Please UN, COP and Australian Government find a way to reverse these trends. It is not too late!
The wind turbine projects being built on the tops of the Great Dividing Range have very little sediment control. Some of the roads are very steep. I wonder how much sediment is washing into the little streams that host endangered species like the Magnificent Broodfrog. How far does the fine sediment flow? Many of these projects lie in the Great Barrier Reef catchment. Farmers must meet tougher and tougher standards regarding their properties.
For years I worked on huge infrastructure projects in Asia. Sediment control was carefully planned and monitored.
A neighbour has recently had his driveway engineered. After a relatively light rain event up here in northern Queensland, I noted that fine sediment from his driveway washed down the drains and disappeared. Sand carried for tens of metres down the roadside gutters while gravel pieces moved several metres. Here are a few photos. Note the silt still remaining on the road itself. The driveway gently slopes down to the old road-side gutters with a narrow concreted steeper area just before the gutters.
Up here, we can experience rain intensities that wash roads away and roadside slopes collapse. How much sediment will move into streams into our heritage areas from the wind turbine projects? Who is monitoring it? No-one has an obligation to report it. Thousands of kilometres of roads are being built. What is the cumulative impact?
I fight to have wind turbines built where they do not damage the Australian Environment.
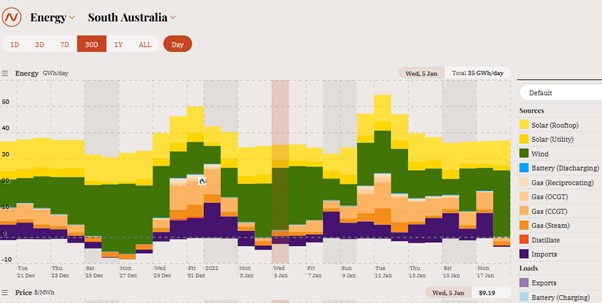
This is the fourth in a basic series about electricity written by Dr David Jones.
The 80% renewable electricity target by 2030 cannot be achieved unless there is sufficient storage in place for the output of variable renewables.
When you think about it, storage has always been a primary issue for electricity generation. In the case of coal there has always needed to be sufficient coal in bunker storage at a power station to feed the furnaces. Coal is a concentrated form of “solar energy” that was captured by plant photosynthesis many millions of years ago – so it is a form of energy storage. Likewise with gas.
As Australia transitions towards a planned renewables-based electricity generating system it will be critical to have sufficient storage to maintain power supply during periods when intermittent primary generation sources are not producing power. Shutting down existing dispatchable, fossil-fuelled generation before the required storage is in place will likely lead to frequent, unpredictable, widespread blackouts.
As discussed in a previous instalment, solar PV (especially rooftop solar) has a low capacity factor since electricity is only produced when the sun is shining. Let’s assume for simplicity that large scale solar PV with a capacity factor of 30% is the only source of generation. Electricity is produced during an 8h daytime window. What about the rest of the 24h period?
To ensure that sufficient electricity is produced for a 24h period, “surplus” electricity needs to be produced and stored during the day, for use during the dawn and dusk periods and through the night. This means that more than 3 times, over and above the daytime requirement, needs to be produced and stored. Thus, a 300MW nameplate capacity solar farm would be needed to produce 100MW, averaged over the 24h period, with sufficient storage.
The situation is more complicated with wind because of its intermittent nature, noting that the average capacity factor of an onshore windfarm in Australia is about 35%. However, in contrast to the regular and predictable day/night cycle for solar, wind is typically quite variable. So even with overbuilding x3 to allow for the capacity factor, if there is no wind (be it day or night) there will be no power produced.
So, we are going to need storage and LOTS of it, if our current electricity system is going to function with 80% renewables by 2030. What are we looking at for 2030 and how much more is going to be needed between now and then, and beyond?
Australia’s total current storage capacity is only 3GW. Current forecasts by the Australian Energy Market Operator (AEMO) show Australia will need at least 22GW by 2030 – a more than 7 fold (700%) increase in capacity in the next six years.
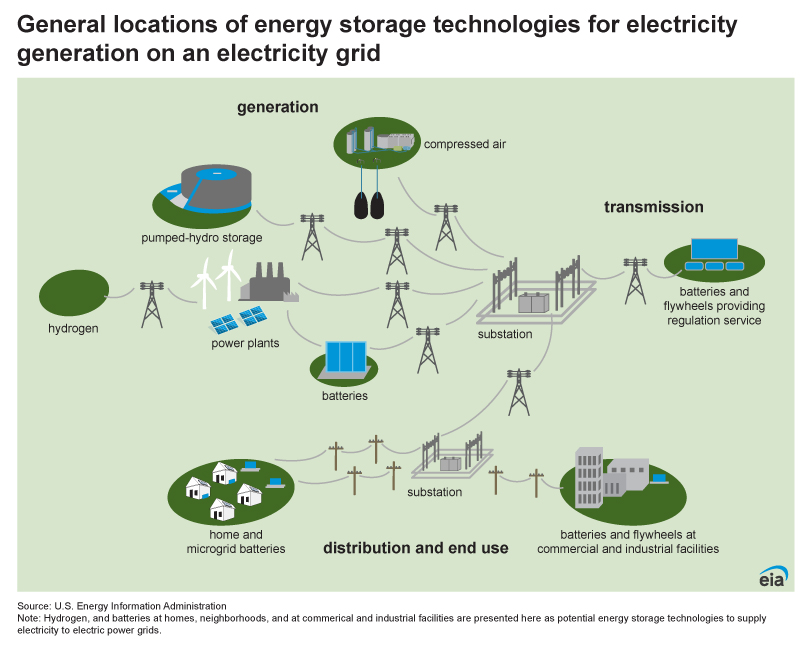
In my next instalment I will be taking a closer look at the main options that are being proposed for large scale storage – pumped hydro and batteries – and the challenges associated with them.
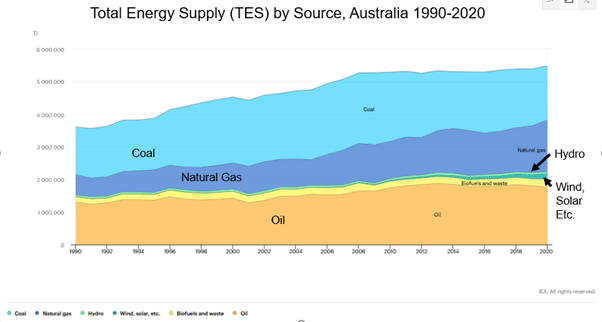
There is currently much confusion in understanding how big the task will be, and how long it will take, to decarbonise Australia’s energy supply. In particular, electricity generation is being used interchangeably with energy demand in communications from the Government and much of the general media. This confused situation is not helping us understand the current heated debate about the path forward for the energy transition.
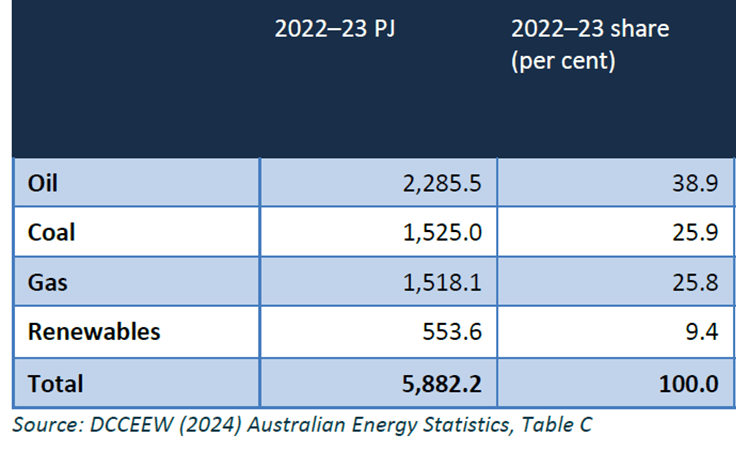
The chart below shows how Australia’s energy mix has changed from the 1980s to the present. The energy units are Petajoules (PJ). One PJ is the heat energy content of about 43,000 tonnes of black coal or 29 million litres of petrol.
Source: DCCEEW (2024) Australian Energy Statistics, Table C
Latest Data on Australian Energy Consumption by Fuel Type
Oil, including crude oil, liquefied petroleum gas (LPG) and refined products, make up the largest share of energy consumption (39 per cent), with coal and natural gas both at 26 per cent.
Although renewable electricity generation has more than doubled over the last decade, it still only accounts for 9% of Australia’s total energy consumption. It will be a surprise to many to learn that combustion of biomass such as firewood and bagasse (the remnant sugar cane pulp left after crushing in Qld & northern NSW) makes up about a third of all renewable energy generation in Australia. But wait a minute, aren’t we being told that renewables make up 37% (solar-16%, wind – 12% and hydro-6%) of the total amount of electricity currently being generated in Australia?
So where does this 37% number come from, when renewables only make up only 9% of the total energy mix?
Well, the fact is that electricity generation currently only makes up about one-quarter or 25% of the total current energy demand. 25% of 37% is 9.2%.
So, both numbers (9% and 37%) are technically correct, it just depends on what they are referring to.
On the one hand, this means that we are now almost half way to the Australian Government’s current target of 82% renewable electricity by 2030. However, even if we do make that target it means that we are still less than one quarter of the way to decarbonising Australia’s energy supply by 2050. That leaves a huge gap between 2030 and 2050.
If that gap is to be made up of wind, solar and hydro alone then it would mean having to install and connect nearly 10 times more generating capacity (with associated storage) than we have in 2025. This will be a truly mammoth undertaking, noting that between now and 2050 the earlier solar and wind installations (and associated battery storage) will need to be replaced up to two times.
My next instalment is Australia’s Energy Resources – Where our “Power” Comes from.
How did you go with my question at the end of the last blog? I am about to hand you a kilogram of a radioactive substance. I have 2 choices. One has a very short half-life and one has an extremely long half-life. Which one is the safest?
The radioactive substance with the short half-life is very dangerous. It has a short half-life because it is decaying quickly and sending out a lot of energy and particles. The substance with a long half-life decays very slowly and may even be safe to hold with very little protection. As a teenager, I held a bar of uranium in my bare hands during a special visit to Lucas Heights. These days they would insist on gloves. In the fifties, Queen Elizabeth II was given a plastic bag containing a large amount of plutonium to hold during her visit to Sellafield.
What implications does this insight have when considering nuclear waste management?
Here is Dr Don Lincoln describing more about radiation.
When discussing the levels of radiation experienced on Earth except in exceptional circumstances, I find it easier to understand if the units are in millisieverts or a thousandth of a sievert.
Don’s Examples of Radiation Levels Expressed as mSv per Year
Woodchopper in woods USA 3 City Dweller with medical tests USA 6 Just from your own body 0.4 Plane trip across the Atlantic 0.025 Whole body CT Scan 10 Nuclear worker maximum allowed 50 Cancer risk starts 100 Radiation sickness 400 Severe radiation poisoning 2000 Usually kills but may survive with medical care 4000 Death certain 8000
The first 6 items in the table are all examples from the USA. Background radiation levels around the world vary enormously as my next blog illustrates.
Earth is made of Stardust –We live on a Radioactive Planet, a Nuclear Planet
Every element in the Universe was made by nuclear reactions in stars.
When stars age, they break apart and form stardust.
Gravity combined this dust to make solar systems of planets.
The core of our planet is radioactive and provides us with a warmer planet surface and a magnetic field.
For A Planet to Generate Its Own Magnetic Field by the Geodynamo Process – It Must Have the Following Characteristics
The planet must rotate fast enough.
Its interior must have a fluid medium.
The interior medium must have the ability to conduct electricity.
The core must have an internal source of energy that propels convection currents in the liquid medium.
On Earth where does the energy come from? Radiogenic heat comes from the radioactive elements: Uranium 238,Thorium 232 and Potassium 40. All have very long half-lives.
Iron and Nickel conduct the electricity in the core.
Today, Mars does not have a global magnetic field. However, Mars did power an early dynamo that produced a strong magnetic field 4 billion years ago, comparable to Earth’s current surface field.
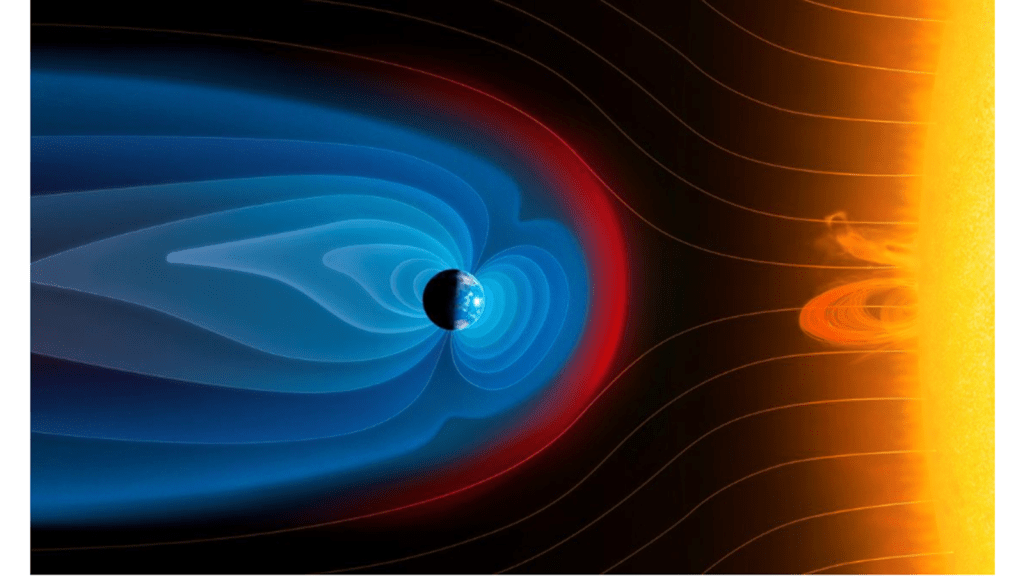
Without a Magnetic Field Our Atmosphere Would be Stripped Away by Solar Winds. Life on Earth Would Not be Possible.
Earth’s Magnetic Field – Our Protective Blanket Helps Shield Us From Unruly Space Weather.
According to NASA, the magnetosphere also protects Earth from large quantities of particle radiation emitted during sun storms as well as cosmic rays – atom fragments – raining down on Earth from deep space. Our magnetic field repels harmful energy away from Earth and traps it in zones called Van Allen radiation belts.
But our protective shield is not completely invincible. Cosmic rays are part of the background radiation we receive every day.
Tritium is created in our upper atmosphere every day and comes down in the rain.
None of this protection would be possible if Earth was not enough of a nuclear planet with sufficient quantities of radioactive substances.
The next two blogs in the series illustrate the basics of just what radiation actually is and provides terms necessary to understand later blogs. The third blog discusses the range of background radiation found naturally on the surface of our planet. For some readers there will be surprises in store.
The Adverse Impacts of Wind Turbine Developments on Australia’s Biodiversity and Climate
Most of our big cities are spread along the East Coast of Australia. They were sited where they are because of the environmental conditions resulting from the Great Dividing Range and its forests. We are still undervaluing these assets and underestimating the threats even as we face the ravages of climate change. In Far North Queensland our tropical rainforests and wet sclerophyll forests are now being severely threatened by wind turbine developments. There is little of this forest left. Forest is more than trees. The biodiversity is enormous. In our ignorance, yet another project has recently been passed under the EPBC Act. But it is not just the biodiversity that is lost. The forests on the ridges of the Great Dividing Range help to stabilise the local climate in many ways. Undisturbed tropical forests are usually fire resistant.
Forests play so many roles. They tie the soil together, preventing erosion and absorbing the water to form deep sponges slowing down the passage of water and cleaning it on the way. In other words, forests help to lessen the impact of floods, feed ground water and keep the area moist and cooler. While doing all these services, they sequester carbon dioxide in their wood and their roots, pouring oxygen into the atmosphere and producing food and habitat for other living creatures. Recent studies suggest that the trees on lower ranges, as we have in Australia, also help it to rain in two ways: evapotranspiration help clouds reach saturation levels and organic compounds rising from the trees seed the clouds. This becomes more and more important as temperatures rise with climate change as warmer air holds more water before it becomes saturated.
It is not enough to claim that a wind turbine development only effects the actual cleared area. Any disturbance leads to edge effects that have now been shown to penetrate as much as 3 km into adjacent tropical forests, drying out the soil and vegetation, making wide bands of land more susceptible to fire and windstorms. This leads to progressive degradation and the damage grows exponentially hot summer by hot summer. When this forest with all its diversity is gone, it is gone. It cannot be restored by replanting a few trees. Rainfall comes less often but when it does rain, the amount is increased with bigger drops. Flooding and soil erosion can become massive.
Carbon Dioxide
Australia is the driest continent on Earth. Like every other nation on earth, we will be affected by climate change. We certainly don’t like the idea of becoming hotter and drier in the future. When I look at the data on global carbon dioxide levels and rising temperatures, I see that we are not winning the so-called war on carbon dioxide levels despite the amount of wind and solar projects being built around the world and the trillions of dollars already spent.
Despite many dire predictions, the Earth’s natural systems are still doing most of the heavy lifting. It is hard to comprehend that we humans, one of the most successful species to have evolved on our planet is unbalancing a range of natural systems on which our very existence depends. If we wish to leave a liveable planet to our children and grandchildren, we need to consider all the components that are threatening our natural systems. When we speak of saving the climate, it’s really the Holocene climate we are trying to save, and the biological richness holding it up.
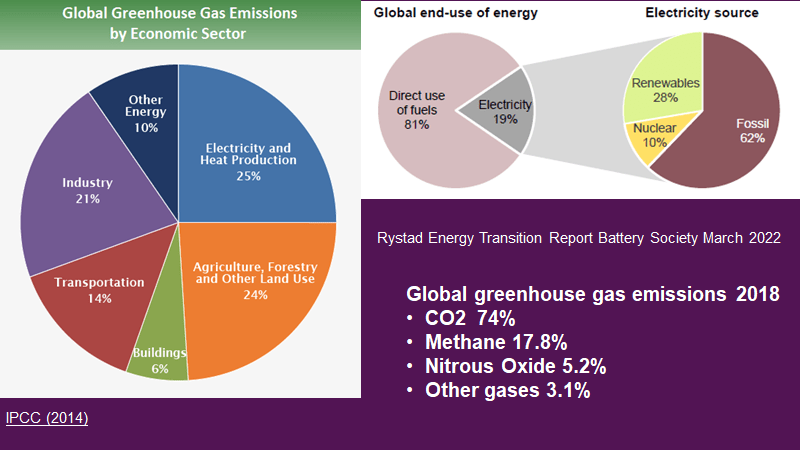
In our haste to save the climate we have separated two of the important dynamics that affect carbon dioxide levels. In the race to replace fossil fuels with “renewables”, we seem to be overlooking other large factors. Well over a decade ago, the Australian Government funded a project to really look at the big picture to determine just what should be done. How should our money and resources best be spent mitigating climate change? The images below illustrate the situation both globally and in Australia.
Source: Global Carbon Project – the numbers are in billions of tons of carbon dioxide per year averaged between 2010 and 2019.
The arrows show the major fluxes. So, fossil fuels and industry produced 34.4 billion tons per year (Pg CO2/yr) while land use change emitted 5.7 for a total carbon dioxide source of 40.1 billion tons CO2/yr.
The land sink is 12.5 billion tons of CO2 per year and the ocean absorbs 9.2 making a total sink of 21.7 billion tons of carbon dioxide per year. The data shows that natural systems were removing more than half of anthropogenic (man-made) carbon dioxide between 2010 and 2019 averaged over this period. It has continued to do this enormous task for the last 60 years on a proportionate basis. The sections of the United Nations that look at this side of the equation have reiterated this information for many years.
Source: Global Carbon Project – the numbers are in millions of tons of carbon dioxide per year averaged between 2010 and 2019. (Note that the units are millions of tons of carbon dioxide per year.)
Look at the impact of FIRE! It had a much larger impact than our electricity production.
Australia only produced 0.12% of the net emissions of the world and we were nearly carbon dioxide neutral from 2010 to 2019 while the sequestration by ocean was not even counted!
If only it were that simple. We are a small nation but we emit 1% of the world’s carbon dioxide from fossil fuels and industry. Add our emissions from bushfires and that doubles our emissions to 2 %. BUT our wonderful land sequestered most of this , bringing our overall emissions down to .1%. How much longer can the natural world help us if we continue to chop down trees and let fires burn? Both decisions dry out our soil and the consequences compound.
What about our coal and gas exports? The reality is that we are buying our wind turbines and solar systems and batteries and EV cars from overseas, some parts of which have been manufactured using energy from fossil fuels, possibly even our coal. Simplistically, one could suggest that Australia’s transition to renewables is actually bad for climate change mitigation. Particularly so when we destroy Nature’s system of carbon sequestration when installing wind turbines on ridges in forested areas.
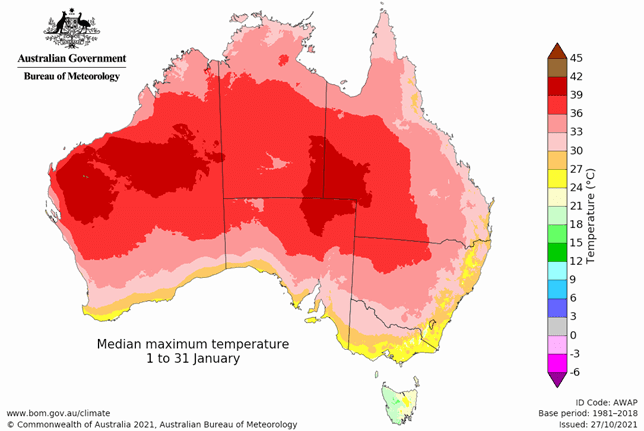
Elevation doesn’t offer protection from heat in Western Australia. Neither does it correspond with rainfall despite the nightly impression we see on the TV weather maps of clouds passing from North West to South East over our continent.
It is no surprise that most Australians live close to the Great Dividing Range in Eastern Australia.
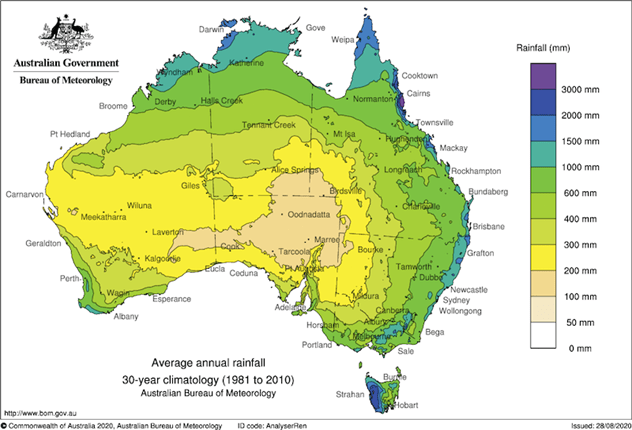
As compared to rainfall in Australia where are our remaining forests?
Forests in Australia
Distribution of Australia’s Forest Types 2018
In 2019, Australia had a total of 134 million hectares of forest, which is equivalent to 17% of Australia’s land area. Australia had about 3% of the world’s forest area, and globally is the country with the seventh largest forest area.
Most of Australia’s forests are native forests and these native forests are often divided into three classes based on their crown cover and three classes based on mature tree height. Crown cover is the area of ground covered by tree canopies, ignoring any overlaps and gaps.
Less than a third of our forests are reasonably dense with more than 50% canopy cover. Rainforest is nearly three quarters closed canopy and of medium height.
Rainforest
Well over half of Australia’s rainforest is in Queensland. Australia has 3.6 million hectares of the rainforest native forest type, which is 2.7% of Australia’s total forest area. Half of this is protected in nature conservation reserves with 2 million hectare belonging to Queensland.
Australia’s rainforests are typically characterised by high rainfall, lush growth and closed canopies. They rarely experience fire. However, currently planned renewable energy projects will change this dramatically. Recent studies undertaken in the Amazon and Brazil show that fragmentation dries out the soil and the forest for up to 3 km from the cleared area making the rainforest much more prone to both bushfire and wind storm damage. This damage extends further and further into the forest with each event. It has been shown in China that wind turbines act as giant fans leading to extra drying. These same mechanisms apply to other forest types as well. Eucalypt forests can recover from fire if given the chance to do so. Studies in Indonesia and the Amazon indicate that this is not the case for tropical rainforests. Fire and wind storms do not recognise boundaries between conservation zones and private land. Our World Heritage Areas have no special protection from fire and edge effects resulting from clearing on nearby land.
Distribution of the Rainforest Native Forest Type 2018
Rainforests are very important for the conservation of biodiversity. They provide habitat for many forest-dwelling and forest-dependent species of plants and animals. This includes numerous species that are endemic to Australia, and species listed as threatened under the Commonwealth Environment Protection and Biodiversity Conservation Act 1999.
Rainforest comprises only 2.7% of Australia’s total native forest, but provides habitat for 60% of Australia’s plant species, 60% of butterfly species, 40% of bird species and 35% of mammal species.
One third of Australia’s rainforests lie within UNESCO World Heritage Areas. The World Heritage Wet Tropical Forest clusters around Cairns. The IUCN nominated this forest as the second most important natural area in the world. At the time of its listing, it was noted that the forest was partially degraded and that every effort should be made to link the various sectors together.
Recent studies have indicated that wet forests including wet sclerophyll forests help to cool the temperature of Earth down and will continue to do so as temperatures rise unlike other forest types.
The albedo effect of forests, because they are darker and absorb more light energy, causes warming. This is counteracted in tropical wet forests due to the greater extent of cooling caused by evapotranspiration from their leaves. The UN has estimated that that the overall worldwide cooling effect may be as much as 1 degree Centigrade.
Eucalypts
Three quarters of Australia’s total forest area is dominated by Eucalypt forest.
Distribution of Eucalypt Native Forest 2018
Please note that the denser eucalypt forest in Queensland lies just west of the wet tropical forests clustered around Cairns. The other main zone lies to the south of Emerald and Rockhampton. While some of the denser forest are protected as National Parks and Forest Reserves, nearly 90% of the eucalypt forest in Queensland is either leasehold or privately owned. Much of it is the open woodland forest type and is often used for cattle grazing.
The Hydrological Cycle, Clouds, Mountains and Rain
The Great Dividing Range consists of a complex of mountain ranges, plateaus, upland areas and escarpments. A very simplistic view of the rainfall is that moisture laden air brought in by the trade winds rises up the sides of the Range and the moisture condenses in the higher cooler air and down it comes as rain (orographic rain). A rain shadow can then form on the other side of the Range. However, our peaks are not very high. An increasing number of studies hypothesise that the clouds form and are seeded as the result of organic compounds rising from trees on the mountain ridges. It has also been suggested that additional moisture needs to be added to the air from land evaporation and tree evapotranspiration before critical moisture levels are reached and it rains.
Currently there are over 60 renewable energy projects planned for the Great Dividing Range between Cairns and Brisbane most of them in our precious remaining forest. Steve video ref Far too many of them require clearing for access roads and blasting of the mountain tops to catch the best winds available. Queensland’s wind resources are not wonderful as recorded daily by current operating wind turbines. Their placement is understandable from the project proponents’ viewpoints as this is where access to transmission lines and the QLD Renewable Energy Zones were placed. BUT what are the consequences.
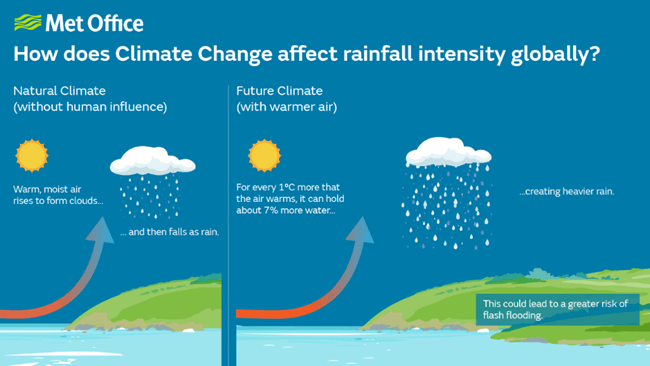
Do we know? Current climate models do not take all these details into account. One thing is certain that as temperatures rise the air can hold more moisture. Two things can happen as a result. It is harder for moisture to condense and rain to fall. BUT when it does rain, the volume and intensity of the rain will be much greater.
Forests play many roles. They tie the soil together, preventing erosion and absorbing the water to form deep sponges slowing down the passage of water and cleaning it on the way. In other words, forests help to lessen the impact of floods, feed ground water and keep the area moist and cooler. While doing all these services, they sequester carbon dioxide in their wood and their roots, pouring oxygen into the atmosphere and producing food and nice places for other living creatures.
So, if instead we put wind turbines on the mountain ridges, we dry out the soil and the nearby forest, increase the temperature, affect rainfall patterns, decrease carbon sequestration, increase bushfire intensity and occurrence, destroy biodiversity, waste lots of rare resources while making unreliable energy, killing our remaining manufacturing and businesses while costing our nation a fortune which will have to be repeated again before 2050. In the meantime, China has discovered that it is possible to lower urban temperatures by planting a forest around their cities.
It would be nice to believe that fragmenting the remaining forests would not do too much damage. This is not the case. It is absolutely critical that our northern forests are left intact. Thousands of recent ecological and forestry studies show that we are reaching a tipping point of tropical forest survival. Death by a thousand cuts? No just a few more may well be enough. So many species are on the edge. No, we don’t have every answer or absolute proof. By the time it is available it will be too late.
Why are we risking Australia’s future on a poorly thought out strategy.
Last Tuesday representatives from 116 regional community groups from far north Queensland to southern Victoria travelled to Canberra for the Reckless Renewables Rally. The press either ignored them or made fun of them; called them selfish or victims of misinformation by their local members. These were people who already have wind turbines, solar farms, and transmission lines next door. They care about climate change and our natural environment which is currently sequestering as much carbon dioxide as Australia produces. They feed not only Australians but many other peoples around the world as well. They watch while our forests are being made more fire prone, and our best agricultural soils are being lost. Our regional farmers are receiving 1970 prices for their produce while the big companies are making record profits.
Perhaps it’s time to listen.
I have enclosed a copy of their flyer which lists the wide range of entities involved.
This is a particularly important blog for Australians. It is time we learnt about our land and just what happens in Australia.
Earth Systems and Climate Change Hub provided a big red flag and some fascinating insights into Australia’s total carbon budget from 2010 to 2019. The ESCC Hub is funded by the Australian Government’s National Environmental Science Program and feeds data into the international entity the Global Carbon Project. Carbon budgets provide information and data to inform and raise awareness about how the world is tracking against the global climate change mitigation challenge.https://nespclimate.com.au/wp-content/uploads/2021/06/ESCC_Global-and-regional-carbon-budgets_Brochure.pdf
Good News: Australia was almost carbon neutral for the ten years from 2010 to 2019.
We only emitted 0.1% of the carbon dioxide added to the atmosphere worldwide over that 10-year period. It is our wonderful natural land that acted as a giant carbon sink squirrelling away almost all the carbon dioxide we produced. The situation varies from year to year depending on weather conditions and our actions.
Yes, we can save our biodiversity and do our bit to fight climate change at the same time. Indeed, we must do so.
Bad News: bushfires produced half the carbon dioxide.
In many parts of Australia, when bushfires start, we simply let them burn. Most firefighting is done by an ageing voluntary fire service with little equipment and even this equipment is old and often no longer safe.
Work undertaken, particularly in the Northern Territory, shows that traditional fire management practices work well to reduce emissions. Indeed, our First Nations People earn carbon credits using their traditional cultural practices. Using properly timed cool burning techniques, the carbon dioxide produced by fire is greatly diminished. If these practices were used more widely, great savings could be made in the loss of human life, property, and biodiversity. Indeed, scientific studies have shown that biodiversity can even be improved.
As the climate gets hotter, the potential damage done by bushfire in Australia will increase dramatically unless we do all we can to protect our land from fire and fight fires quickly and effectively when they do start. It has already been shown that access to water bombing helicopters can result in fire being stopped very quickly. Timing is critical – the sooner a fire is reached, and action taken, the less the damage. Satellites can now provide the necessary information in real time.
A First Nations man told me recently that Australia spends less than 5% on fire management and 95% paying for the damage afterwards. He wanted to know why we had it so backwards.
We are spending billions of dollars to reduce the emission of carbon dioxide when we produce electricity. Yet, fire releases far more carbon dioxide and has the potential to become much worse. If we stay on our current pathway, we will destroy the ability of our land to be a carbon sink.
Worldwide, natural systems on both land and sea still sequester over half the world’s production of carbon dioxide each year. But there are signs of this slowing. So far, as we have produced more carbon dioxide each year, the natural systems have kept up. We need to be helping natural systems as much as we can, and this is particularly important in Australia. Worldwide, the oceans do half of the work and land systems the other half. But in Australia, our natural land-based systems can sequester all of our carbon dioxide.
Figure: The Australian carbon budget, including natural and human-caused CO2 sources and sinks (and their net effect in the atmosphere). Annual fluxes are the average for the 2010-2019 decade. Units are in million tons of CO2.
What should we do with the resources we have?
Upgrade our fire fighting ability with quicker, scientifically backed fire fighting techniques. A stitch in time saves nine and saves lots of human lives and property, carbon emissions PLUS our precious BIODIVERSITY.
Use the best sources of energy. Ask: Which power systems impact the least land area, are low carbon, use the least materials in their manufacture, and can be used to make steel and bricks and cement?
Australia is dotted with pit lakes from mining activities. Many of these pit lakes may be suitable as a source of water for water bombing in regional areas.
Here are 8 good reasons. Most of this post comes from a simple pamphlet I recently put together.
Nuclear Saves Habitat, Jobs and Farming Land
We could be replacing coal-fired power stations with Nuclear Power on the dirty old coal sites. A high proportion of the skilled workforce could be retained with decent salaries. Current transmission infrastructure would replace the need to build new transmission lines, saving money, resources such as copper while saving even more habitat and our best food producing soils.It is our land and its habitat that is sequestering most of the carbon dioxide that Australia produces. See my 2 previous blogs for more information.
2. Nuclear Power is a Low Carbon Energy Source
3. Nuclear Power is Safe
Nuclear activity and its ionising radiation are part of the natural world and were there when life began. Biology had to learn how to live safely with low and moderate levels of radiation. Otherwise, it would not have survived. The problem is with neither the physics nor the biology but with ourselves. While like all animals we are naturally protected and have no need to worry about immersion in moderate radiation, we have learned how to build instruments and make measurements that scare us. We put regulations in place that are designed to protect us from risks that nature has already covered.- Wade Allison Nov 2023
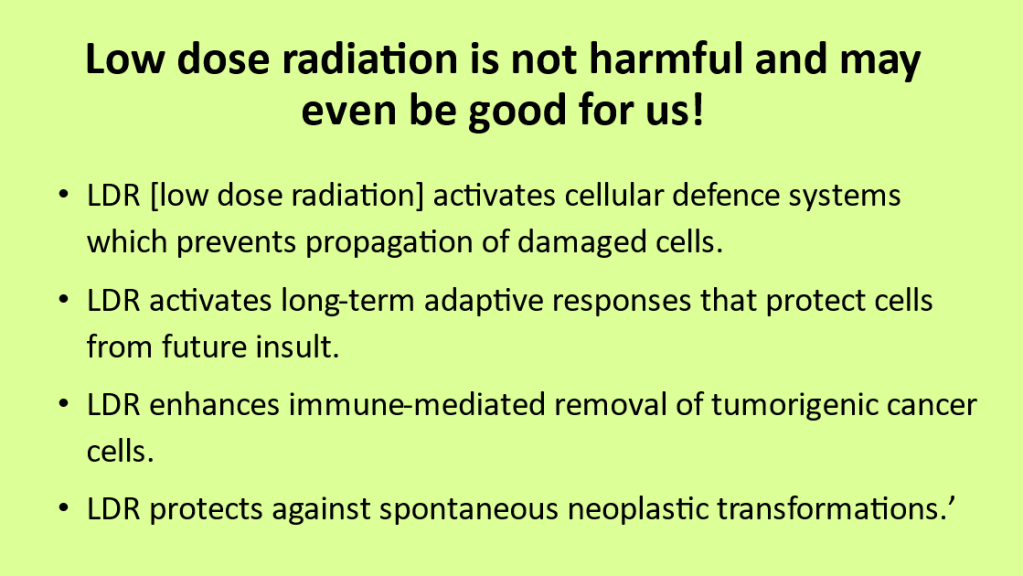
The Cellular Changes Needed To Initiate Cancer Have Not Been Observed at Low Dose Rates. At least 6 to 8 of specific cellular changes must occur for cancer to result. The “Hit Theory” of DNA mutation as a cause of cancer is way out of date and not applicable.
4. Nuclear Waste is the Power Source of the Future
We do know how to bury it safely for ever – Nature has shown us how and some countries are doing so now. BUT, what a waste!
5. Materials Needed to Manufacture Power Systems
The metals used in solar and wind power and transmission lines are becoming scarcer. It takes more than a decade to open up a new mine but we do not even have enough mineral resources to build the first generation of renewables. Recycling is very energy inefficient.
Recent evaluations of all the materials needed for the Energy Transition indicate a shortage of many materials. We do not even have sufficient minerals in the ground- Simon Michaux. We must be careful with all the resources we have whether minerals, money, or biodiversity. We must never forget how much nature is doing to look after us.
6. We Need to Decarbonise More Sectors Than Just Electricity
7. The Energy Produced from a Power System Compared to the Energy Used to Produce that Power System
Until a solar farm can produce enough energy to make itself again, it shouldn’t be called renewable. If it takes too much energy to make and use a power source, it is not a viable long-term solution. Most calculations of money or energy costs do not include all of the system costs.
Why does Nuclear Power have such a high EROI? ANSWER: Because of the orders of magnitude higher energy density of the fuels it can use such as uranium and thorium.
8. The Future
When should Australia introduce nuclear energy? Are we Australians ready yet? The false fear of radiation has even slowed our ability to even look after our low dose waste from research facilities and hospitals to a ridiculous extent. Most of the cost and time delays that effect the building of nuclear power plants around the world do not arise from the reactor itself but from ordinary engineering works. Australia’s recent history with big infrastructure projects including Snowy 2.0 is not impressive. It seems many big projects have very big cost and time overruns.
However, the first stage of the process will take time that we shouldn’t waste. Stage One involves removing the current bans both nationally and state by state. By the time we finish this first stage, we will be in a better position to judge what to build and purchase.
Wish to learn more? See early posts and become a subscriber.
While we are stressing trying to make our electricity production low carbon, we are overlooking the impact of fire. Dozens, if not hundreds of scientists around the world are doing their best to measure carbon fluxes. It is easy to get lost looking at all the detail and miss the big picture. Some years Australia is a net carbon dioxide sink, some years we are a small net producer of carbon dioxide. It all depends on our bush fire frequency and intensity plus the rainfall patterns and soil moisture levels in any particular year. Looking at the data illustrated in my last blog, Australia only emitted 0.1% of the carbon dioxide emitted to the atmosphere from 2010 to 2019. Nature is doing all the hard work for us. But our record for protecting our natural landscape and our biodiversity could be much better.
Even WORLDWIDE nature is removing over half the carbon we produce. Both Land and Sea are doing the work in so many different ways.
Yet all over the world, climate change policies result in billions of dollars being spent on new infrastructure that has not reduced carbon dioxide emissions nearly enough. Are we spending our resources wisely?
Here is a reminder of Australia’s carbon budget from 2010 to 2019 shown in millions of tons of carbon dioxide per year.
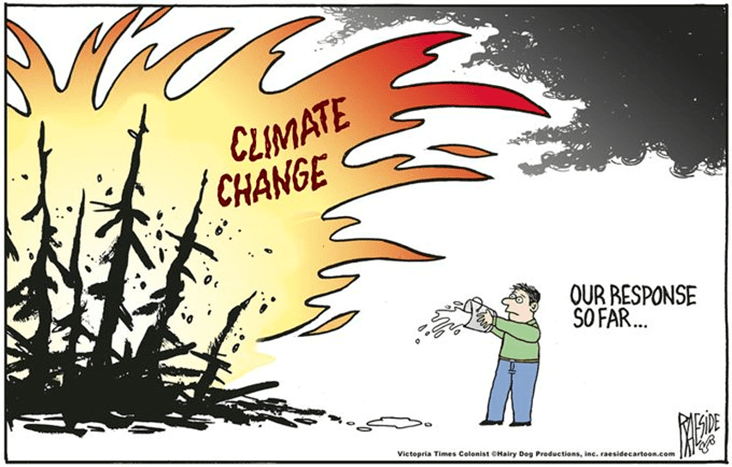
The carbon dioxide emitted by fire is almost equal to the emissions from fossil fuels and over half of our land sinks. One has to ask where we would get the best value for dollars spent. We are at a crossroads, if we do not improve our fire prevention we face a future with horrific bushfires, losing more and more lives, property, and livelihoods while killing off Nature’s ability to help us. The cartoon below illustrates what could be Australia’s future in a somewhat sarcastic manner if we don’t start thinking smarter.
What should we do with the resources we have?
Upgrade our fire fighting ability with quicker, scientifically backed fire fighting techniques. A stitch in time saves nine and saves lots of human lives and property, carbon emissions PLUS our precious BIODIVERSITY.
Use the best sources of energy.
I am not any sort of expert on fires, but I see so many wonderful articles on the web from firemen, scientists, and indigenous experts that need to be heeded. Economically, we spend 3% on protection and 97% after disasters happen. If we keep doing what we do now, our carbon emissions will be huge. Our land could become unlivable.
Australia currently depends on our Rural Fire Brigades, volunteers who put their lives at risk with outdated and insufficient equipment.
This year up where I live in Far North Queensland, the undergrowth stayed too wet for cool burns until later in the year. When the undergrowth was just right, a total fire ban was put in place by those 2,000 km away. The result: few cool burns and later, lots of rampaging fires because the fuel load was too high. This has thoroughly frustrated our local fire fighters.
Indigenous fire systems work well in parts of Australia. We need to learn from our Indigenous people use their skill and knowledge far more. It is so much cheaper to prevent fires than to pay for all the damage later.
Modern satellite monitoring can really assist if the information reaches the right people very quickly. Most fires start from lightening strikes when conditions are dry. We can pinpoint them quickly now. What we need is the ability to reach these fires fast and put them out as quickly as possible.
Mother Nature is still doing a magnificent job removing carbon dioxide from the atmosphere. Over half of the carbon dioxide, we produce from fossil fuels and other carbon intensive activities is taken up by the ocean and vegetation on the land.
The Global Carbon Budget
There are many entities around the world, doing their best to measure and calculate the earth’s carbon budget. The clearest summary I have seen so far is shown below and copied from an overview article Carbon Stocks, Fluxes and the Land Sector by Graham Diedrich February 07, 2022. https://www.canr.msu.edu/news/carbon-fluxes-and-carbon-stocks
The figure above shows global carbon stocks and fluxes. The boxes represent the stocks of carbon in its different forms, but the numbers always relate to the amount of carbon. The arrows show the movement of carbon in or out of these carbon storages. The annual carbon exchange flux is represented numerically in PgC per year units, in which 1 PgC is equal to 1 billion metric tons of carbon. Nature has stored away huge quantities of carbon over eons of time as coal, gas and oil. Even more carbon is stored in the deep ocean (37 trillion tonnes). Each year we are burning carbon so that about 7.8 billion metric tonnes of carbon join with oxygen and add to the carbon dioxide already in the atmosphere. Land use change adds even more as we desecrate forests and release carbon from soils.
Mother Nature is still doing a magnificent job removing carbon dioxide from the atmosphere. Over half of the carbon dioxide, we produce from fossil fuels and other carbon intensive activities is taken up by the ocean and vegetation on the land. The movement of carbon into the soil is very substantial but very variable and hard to measure. Note just how much carbon is stored in soil and permafrost.
Why Care About Natural Terrestrial Ecosystems
Nature provides a range of services such as:
Capturing and storing carbon.
Regulating climate – lowering the intensity of droughts and floods while stabilising temperatures.
Maintaining water balance – helping to make it rain and storing and cleaning water.
Providing biodiversity – bees to koalas to earthworms and magpies.
Creating jobs in ecotourism.
Providing resources for our use including our food.
Manufacturing soil.
Forests are particularly important not just for providing shade and storing lots of carbon, but they lower the earth’s temperature by as much as a degree. They do this through evapotranspiration, a process similar to the cooling produced by evaporative air conditioning. Some trees such as our eucalyptus also emit chemicals that trigger cloud formation providing yet more cooling effect.
A slide from one of my talks
But Australia’s natural ecosystems are at risk from:
climate change and variability – extreme heat events and droughts,
fire – carbon stored in woody vegetation is vulnerable to increased fire risk through burning under climate change,
land-use change particularly land clearing,
disturbance including invasive species, and disease.
Death of vegetation from drought stress, extreme disturbance events, disease, and pests could also result in increased carbon release to the atmosphere and changes to CO2 emissions from soils. An issue often overlooked is the release of water from soil as vegetation cover lessens. Lower soil water levels reduce the rate of photosynthesis and hence carbon removal.
Factors That Affect Nature’s Role in Reducing Carbon Dioxide in the Air
The vegetation on Earth holds a lot of carbon, somewhere between 450 and 650 billion tons of carbon (PgC). Just how much carbon is sequestered as vegetation each year is a delicate balance between photosynthesis and plant respiration and horror – wildfires or as we know them in Australia bush fires. During photosynthesis plants take up carbon dioxide and convert it to carbohydrates while releasing oxygen. During respiration plants take up oxygen and release carbon dioxide.
Lots of scientists are looking at the factors that effect the rate of photosynthesis and respiration by plants. What would it take to tip the balance in the wrong direction? What we know is that increasing carbon dioxide levels in the air are increasing photosynthesis. But far more important is the water available to plants and the temperature. There seems to be a maximum temperature for many plant species. Increasing temperature increases photosynthesis until the maximum is reached then as temperatures become even higher, photosynthesis falls away – heat stress. Droughts decrease carbon uptake by plants. Very wet years in Central Australia can result in massive increases in carbon uptake even over a short period of time. Unfortunately, plant respiration seems to continually go up as temperatures climb.
Will plants adapt to the changing conditions? It has been noted that plants in dry northern Australia recover from fire faster now and become carbon sinks again after a fire made the area a carbon source.
It is not surprising that seasonal variation is found depending on the weather. Winters are cooler. Rainfall patterns vary considerably. In Australia, there are major differences between El Nino and La Nina years. Long droughts in Australia can cause the more arid regions to become carbon sources.
Forests Buffer Thermal Fluctuation Better than Non-forests
A systematic study of thermal buffer ability (TBA) of different vegetation types showed that forests and wetlands buffer thermal fluctuation better than non-forests (grasslands, savannas, and croplands). Notably, seriously disturbed and young planted forests displayed a greatly reduced TBA as low as that of non-forests at high latitudes. Canopy height was a primary controller of TBA of forests, while the TBA of grasslands and savannas were mainly determined by energy partition, water availability, and carbon sequestration rates. Protecting mature forests is critical to mitigate thermal fluctuation under extreme events. https://www.sciencedirect.com/science/article/abs/pii/S0168192320300964?via%3Dihub
An introduction to the Australian and New Zealand flux tower network – OzFlux
OzFlux is the regional Australian and New Zealand flux tower network that aims to provide a continental-scale national research facility to monitor and assess trends, and improve predictions, of Australia’s terrestrial biosphere and climate. https://bg.copernicus.org/articles/13/5895/2016/ and https://ozflux.org.au/index.html
Many universities and other research entities form the network and the OzFlux website provides hundreds of research articles if you wish to read more detailed information. OzFlux is part of a worldwide network FLEXNET.
Studies in Australia are measuring factors that effect photosynthesis and respiration, the effect of fires and other stressors. The earliest measurements were made two decades ago. Since then, lots more monitoring points have been added and some removed. The monitoring data collected by OzFlex and FLEXNET is used to calculate and understand the factors increasing carbon dioxide in the air to work out the best strategies to adopt to climate change and mitigate it. OzFlex has helped us to understand the major roles the savanna lands and arid desert play in Australia’s carbon balance.
The Protection of Our Ecosystems is Our Most Important Action
We must do everything we can to slow the loss of natural vegetation in Australia. Otherwise, we face a future where our carbon sinks become carbon sources and Australia becomes one of the hottest places on Earth.
Regional climate protection is in our hands. Global Climate Change is not. I will explain more in the next blog post and look at Australia’s carbon balance in more detail.
And for those readers who like a little more complexity, I include a few diagrams below from an older IPCC report. The numbers are outdated.
The Wet Tropics is where I have chosen to live now and every day I am still learning more and more about this special region. Much of the information in this blog has been copied from Terrain NRM websites: https://terrain.org.au/ and https://www.wettropicsplan.org.au
The Terrain NRM website is full of information, and it is obvious that a lot of time and careful thought was used in its creation. I loved their descriptions of this region. Hence, I have chosen to copy and paste a few sections that I particularly wish to emphasise. The website is now a few years out of date unfortunately.
There are now new threats to this special area that are not described on the Terrain website so in my next few blogs I will be writing about some of these issues. I will also be writing about the role Australia’s natural world plays in climate change and carbon sequestration.
I should note that I am currently Treasurer for an offshoot of Terrain, the Wet Tropics Soilcare group. This group of farmers care for the biota in the soil, reducing fertilizer use while increasing carbon and water in the soil thus protecting the Great Barrier Reef while producing more and better-quality food.
Terrain NRM is an independent, not for profit and community-based environmental management organisation. We think innovatively and act collaboratively, combining the latest science with local knowledge to develop sustainable solutions to increase the resilience of the rainforests, reefs, landscapes and local communities of Australia’s Wet Tropics region.
If you wanted one word to describe the Wet Tropics Region – it would be DIVERSITY.
Have you ever seen a cassawary in the wild?
Photo credits Terrain NRM
The Wet Tropics region is a melting pot of variety with elevated tablelands, vast outback savannah areas and eye-achingly green coastal floodplains nestled between the foot of the highest peaks in Queensland and the Coral Sea.
The region extends from the iconic Daintree forests of the north to the sugarcane land delta of the Herbert River catchment in the south and then west to the dry rangelands of the Upper Herbert.
The Wet Tropics is literally where the rainforest meets the reef.
This is the only place in the world where two World Heritage Areas are located directly adjacent to one another – the Wet Tropics and the Great Barrier Reef.
The great diversity in the rainfall, geology, soils, topography, drainage and altitude has resulted in a complex and extremely varied spectrum of plants and animals as well as many unique landscapes crafted by nature as well as human activity.
It is a region of contrasts.
The community of the Wet Tropics
Over 250,000 people call the Wet Tropics home and work in a variety of industries. The tourism and primary industries sectors form the foundation of the region’s economy.
Cairns is the largest urban centre in the Wet Tropics region with a population of over 150,000 people from 35 nationalities.
The Wet Tropics is home to a rich, vibrant and enduring Indigenous Rainforest Cultural Heritage, handed down since millennium within the many different Traditional Language Groups. These comprise 20 Traditional Owner Tribal groupings with over 100 clans and family groupings. Over 80 legal entities represent Land People and Culture.
In November 2012, the Wet Tropics World Heritage Area was re-listed to formally include its cultural values. This listing recognises that Rainforest Aboriginal heritage is unique to the Wet Tropics and is a remarkable and continuous Indigenous connection with a tropical rainforest environment.
Wet Tropics Biodiversity
Because of the enormous diversity in altitude and climate, the Wet Tropics region is truly a biodiversity hot spot of global significance.
Directly descended from Gondwana Land, pockets of rainforest in this region have survived 8 major stages of evolutionary change over 415 million years and have more life forms with primitive characteristics than anywhere else in the world.
These origins, along with the varied climate and the dramatic shape of the land, combine to create the perfect conditions for mega-biodiversity.
The Wet Tropics contains half of Australia’s bird species, one third of the continent’s mammals and about 3,000 plant species.
Endemic and Rare Species
The Wet Tropics is home to numerous endemic species, which means that they are found nowhere else in the world; many are rare and threatened plants and animals. Of particular interest is the Southern Cassowary, the Mahogany Glider and the Lumholtz Tree Kangaroo, a kangaroo which actually lives in the treetops of the threatened Mabi Forest.
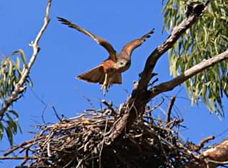
The endemic and rare species don’t all live in protected areas. Visit the Rainforest Reserves website and learn about the Magnificent Brood Frog or the Northern Greater Glider or the Red Goshawk threatened by the Chalumbin Wind Project. https://www.rainforestreserves.org.au/
The ecosystems of the Wet Tropics region have also evolved over thousands of years through active Aboriginal interaction with the land and management of its resources. The plants and animals of the region are a fundamental and integral part of many aspects of the life and culture of Traditional Owners.
Biodiversity and Climate Change
Due to its diversity and the unique warm and wet climatic conditions and altitudinal variation, it is anticipated that the Wet Tropics region will be a really important refuge for quite a number of species in a changing climate. For example, species from further west may move into the Wet Tropics as it becomes drier. Species that currently call the coastal areas ‘home’ may move up the mountain slopes to cooler locations.
Threats to Biodiversity
Although 35% of the Wet Tropics region is in the World Heritage Area, the precious and unique plants and animals are still not adequately protected. There are many threats which, unless dealt with, will continue to erode the extraordinary biodiversity values of this region.
Habitat destruction and fragmentation are top of the list as they destroy ‘homes’ and limit the ability of animals to move and interbreed. Pests and weeds, which are rampant in this warm and wet climate, are another significant threat, while pollution, changing fire regimes and changes to waterways also play a part.
Protecting Biodiversity
Australia is in a unique position to protect the biodiversity of this region. Of the 17 ‘megadiverse’ countries, only 2 are developed. Australia’s low population and continental sovereignty provide a unique opportunity for Australia to be world leaders in the protection of the amazing spectrum of plant and animal life that call this region home.
Everyone has a role to play in keeping their footprint as light as possible, respecting the right of other species to exist and flourish, as well as sharing information about the importance of our plants and animals with future generations. The ecological, economic, cultural and social fabric of our Wet Tropics lives depends on this.
The Wet Tropics Bioregion
The Wet Tropics Bioregion, although only accounting for 0.26% of the total area of Australia, conserves a large proportion of Australia’s biodiversity, as demonstrated in the table below (from Goosem, 2002).
% of Australian Total
Wet Tropics Bioregion land area
0.26%
Animals
Mammals
35%
Birds
40%
Frogs
29%
Reptiles
20%
Freshwater fish
42%
Butterflies
58%
Plants
Vascular plants
26%
Ferns
65%
Cycads
21%
Conifers
37%
Orchids
30%
NB: the Wet Tropics bioregion (ca. 2 million hectares) does not fully align with the Wet Tropics NRM region (2.2 million hectares), and notably does not include the Upper Herbert .In either case, the rivers of this area all flow into the Great Barrier Reef.
Goosem, S. (2002). “Wet Tropics of Queensland World Heritage Area – including an Update of the Original Wet Tropics of Queensland Nomination Dossier”. Wet Tropics Management Authority, Cairns, QLD.
Our People of the Forest
Many Aboriginal people in the region have a mutual obligation or totemic relationship with certain animals or places.
The ecosystems of the Wet Tropics region have evolved over thousands of years through active Aboriginal interaction with the land.
Activities such as fire management, hunting, gathering, harvesting of materials for shelter, tools, ceremony and art and craft have always been integral to the ecology of the Wet Tropics.
The plants and animals of the region are of great importance to Aboriginal culture and there are many customs, stories, songs and dances associated with them. They are a fundamental and integral part of many aspects of the life and culture of Traditional Owners.
Traditional Owners don’t view the plants and animals of their landscape as resources to be exploited. Looking after Country and all the species that live there is a natural obligation for Rainforest Aboriginal People.
Many Aboriginal groups in the region have a totemic relationship with particular animals or plants which are considered their totems.
This means they must abide by the many social and spiritual responsibilities related to that totem and respect and conserve the totem by refraining from eating that species.
Traditional Owner Concerns
Traditional Owners across the whole region have grave concerns about things that threaten the health of the plants and animals of the Wet Tropics, including vegetation clearing, habitat fragmentation, pests and weeds, urban development and climate change.
There is a sense that there isn’t enough awareness of the cultural importance of the plants and animals of this region, and they would like to create more awareness.
They also want to be part of the solution and be respectfully involved in, and benefit socially, culturally and economically from research, planning, monitoring and management of plants and animals.
Please note the green areas on this map. It is such a small area. Please help to save it!
It is now more than 10 days since the massive rally at Ravenshoe, Far North Queensland, recorded by Nick Cater of the Menzies Research Centre. The question now arises as to whether Tania Plibersek, the Minister for the Environment and Water, will again postpone her decision on the fate of this extremely special forested area right next to the Wet Tropics World Heritage Area. The week before the rally, Ark Energy decided to submit a variation to their project. The project had been the subject of a Public Environmental Report. They even changed the name of the project. Locals still know it as Chalumbin Wind Farm. Locals have never confused the Wet Tropics World Heritage Area with the Ark Energy Project Site.
A map of the changes is given below, followed by my response to a Press Statement by Ark Energy. Lastly, I enclose the Statement itself in italics.
Copy of map on the project website
Last Ditch Stand by Ark Energy to Build the Chalumbin Wind Farm
It is only days before the Federal Environment Department were due to announce their decision about Ark Energy’s plan to build a wind farm near Ravenshoe in Far North Queensland. In their desperation, they have even renamed the wind farm and modified the project.
I have not been able to find any reference to the submitted design change or the name change on the EBPC site. I wonder if this is a back door route to keep other Ministers happy.
The site of the proposed wind development, whatever its name, lies within the catchment area of the Great Barrier Reef. Parts of the eastern boundary of the site are contiguous with the World Heritage Wet Tropics Area. This area was named by the IUCN as the second most valuable natural site in the world. It has been recognised for a long time that a much wider barrier protection area is needed next to the World Heritage Area. The ecological value of wet tropical forest is increased by the presence of wet sclerophyll and other forest beside it and should form connectivity between the sections of the World Heritage Area.
Ark Energy divided the proposed “Chalumbin wind farm” into two stages just before issuing the Public Environment Report for comment by the public.
Stage 1 turbines, roads and other infrastructure were mostly in dense, biodiverse forested areas. Stage 2 had areas of more open woodland where cattle grazed and there were some weed and pest infested areas. The forest and waterways of Stage 2 area were still of major importance from a biodiversity viewpoint but not as critical. As a last-ditch stand, Ark Energy has put in a variation of the project to government. If they had really wished to improve the impact of the project, it might have made sense to remove the turbines of Stage I and keep Stage 2.
But, No! Their new concept has basically removed turbines from the Stage 2 area and left the turbines of Stage 1. In other words, they have not removed the major environmental impacts of the proposed project but are making it sound as if they had. Their statements are extremely misleading and only careful perusal of their press release makes this apparent. It was not until we had a clear map of the turbine removal and remaining sites that the real situation could be seen. The press release states that the project completely avoids wet sclerophyll forest adjoining the World Heritage Area. Further information in the document states that “These changes reduce the impacts of the development to 0.7% of wet sclerophyll within 10 km of the project area.” These are carefully worded statements and are very misleading.
The claim is made that “After rehabilitation of the temporary construction disturbance the wind farm would have an operational footprint of approximately 57.6 hectares.” This suggests that full rehabilitation can happen relatively early and that the roads will be mostly rehabilitated. Even if rehabilitation planting could start immediately after the main construction phase, the restoration of actual habitat takes time. However, the roads are still needed for maintenance activities such as lubrication of the turbines, replacement of blades and ultimately removal of the entire wind turbine. I very much doubt that the area of cleared land will become only 57.6 hectares for a long time. In addition, about half a million tons of concrete would be used to form the bases for the turbines and these would not be removed or rehabilitated if the development was to go ahead. Neither will the deep scars on the landscape be rehabilitated.
The offsets are a joke as are so many other statements made in their press release. Offsets should be additional areas, not areas that are left alone. Actually, as I will explain in another blog, the “offset areas” may be subject to impact from the project. The impact assessments do not take into account the loss of soil water by the project.
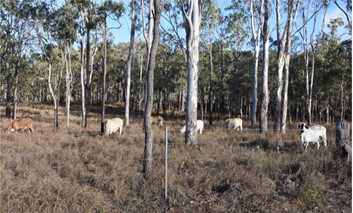
Do not be fooled! Yet again Ark Energy showed pictures of cattle grazing in areas not impacted by the turbines, roads and other infrastructure. It should be remembered that the cattle stations range from heavily forested land to the east and open forest and pasture to the west.
The whole press statement has been written to make it sound as if they are really caring for our precious biodiversity when they are not. When our biodiversity is lost it is gone forever. It is not only the endangered species that are affected. There are no ways to rehabilitate or offset the loss.
By cutting down and dividing forest which currently works hard to sequester carbon, slow and clean and store water and cool the earth, the gains made by any renewable, unreliable electricity produced are greatly diminished. Indeed, the roads and the giant fan turbines will dry out large areas of forest and turn them into carbon sources rather than carbon sinks. It is quite possible that the carbon dioxide reductions afforded by wind power will be negated by the impact of the project itself. Will the forest itself be destroyed by poor climate change mitigation?
Media release Tuesday 5 September 2023
Controversial wind farm project in Queensland redesigned and renamed.
Environmental impacts reduced to low levels.
A proposed wind farm in north Queensland has shed its controversial name and responded to environmental concerns with a drastic redesign that halves its size.
The former Chalumbin Wind Farm has been renamed Wooroora Station Wind Farm, after its host property Wooroora Pastoral Station, a large cattle-grazing property, and has undergone a drastic redesign in response to concerns about the visual and construction impacts on the property, which is located next to national parks that form part of the Wet Tropics of Queensland World Heritage Area.
Forty-four of 86 wind turbines have been removed, halving the size of the project, and leaving a layout of 42 wind turbines. The new design includes a minimum buffer of 1 km to neighbouring World Heritage areas, and completely avoids wet sclerophyll forest adjoining the World Heritage Area as well as all known magnificent brood frog habitat.
A comprehensive nature positive plan includes rehabilitation of most of the construction disturbance and the establishment of magnificent brood frog nature reserves totalling 1,255 hectares. It also includes First Nations-led fire management and control of widespread feral pests (pigs, dogs, and cats) and invasive weeds, to improve the host property’s habitat for key species including the northern greater glider, masked owl, and spectacled flying-fox.
“These changes reduce the impacts to very low levels. We believe the benefits to the natural environment of this project far outweigh its impacts. Not least of them more clean energy into the grid in a relatively short time period and a significant improvement in habitat for protected species on private land adjacent to protected forests,” said Ark Energy General Manager Development for Queensland, Anthony Russo.
“After extensive public consultation, we have listened to feedback from the community, government, and the traditional owners, and made changes to the project to meet expectations. We look forward to working with all key stakeholders to achieve positive outcomes and we are committed to getting this project right from the outset and delivering on world’s best practice in the energy sector.
“We must navigate the tension between the construction required to transition to a clean energy system and protecting nature, and this project’s evolution offers an excellent case study of major design iterations to achieve nature positive outcomes.”
After rehabilitation of the temporary construction disturbance the wind farm would have an operational footprint of approximately 57.6 hectares.
It is hoped that the new name will also help to address a misunderstanding that the development could impact a nearby wilderness area also known as ‘Chalumbin’.
“Some opponents took advantage of the former name to spread misinformation and make unsubstantiated claims about what kind of habitat and species are in the project area and therefore the environmental impacts of the development. The reality is the project is NOT within the World Heritage area and it is important that the project is represented accurately, and the public have the facts,” said Mr Russo.
A variation has been lodged with the Department of Climate Change, Energy, the Environment and Water, which is currently assessing the proposal. More information on the project is available online at wooroorastationwindfarm.com.au
On 9th September, a rally was held in Ravenshoe. Theoretically it was only days before the Federal Minister for Environment was due to announce her decision on the status of the proposed “Chalumbin Wind Farm”. I fail to see how the word farm applies to the wind turbine industry. Farming involves life that grows and reproduces itself. The proposed wind farm will only kill our beloved forest and all the creatures that live in it – death and destruction while doing very little to help mitigate climate change. The forest itself is doing a much better job while not costing Australia millions of dollars.
At the 11th hour the project proponent Ark Energy has submitted a change to the project. What happens next is unknown up here on the Atherton Tablelands. The fight continues.
Hundreds of people joined the rally which was recorded by Nick Cater of the Menzies Research Centre. The link below takes you to his video on ADH TV which is then followed by his interview with the wonderful Stephen Wilson of Queensland University explaining why companies like Ark Energy are so keen to take on these projects.
Decades ago, I worked as an environmental scientist based in Hong Kong. I still stay in touch with some of my staff, who now are very experienced in their careers. I had heard that Hong Kong people were being warned about buying seafood, particularly seafood from Japan due to the release of water from Fukushima. I received an interesting article yesterday and quote from a section of it in the original Chinese together with the translation. I have omitted the first paragraphs. The references vary in their language but Note 2 is in English.
I jump to the last paragraphs examining the above 7:30 report.
“Of course, you can still argue that the Japanese figures are fake. Then you can also check out Korean news. According to Yonhap news yesterday, the South Korean government has conducted emergency radiation tests at 30 points in the sea after Japan discharged nuclear waste water last Thursday, all samples met safety standards, and so far no radiation has been detected in seafood or imported seafood in South Korea. (Note 2)
In fact, South Korea has never believed in Japan, or even the International Atomic Energy Agency, so since July, South Korea has done its own water quality monitoring at 200 ocean points, and Japan is not welcome. But strangely enough, China has not joined the monitoring ranks like South Korea, just insist on scaring ghosts and doing “big internal propaganda” in mainland China and Hong Kong, letting writers like “financial writers” spread false information, lest the world will cause panic.
“So we can assume” that the central government is playing a big game of chess, aimed at “teaching the Chinese people a lesson in popular science”, guiding the public to snatch up Geiger counters that test nuclear radiation, and then looking back to discover that their own home’s radiation is more than 900 times stronger than Tokyo (note 3) – perhaps China’s building materials problem – the reason behind it is too heartening.”
As expected, the South Koreans have not been able to find fault with seafood or seawater. One has to question the motives of countries who spread fear about radiation when these same countries build and sell nuclear power plants. Is it a question answered as it so often is “Just follow the money trail”?
The International Atomic Energy Agency (IAEA) was created in 1957 in response to the deep fears and expectations generated by the discoveries and diverse uses of nuclear technology. The Agency was set up as the world’s “Atoms for Peace” organization within the United Nations family. From the beginning, it was given the mandate to work with its Member States and multiple partners worldwide to promote safe, secure and peaceful nuclear technologies.
The IAEA’s headquarters are in Vienna, Austria. It also has two regional offices located in Toronto, Canada (since 1979) and Tokyo, Japan (since 1984). The Agency runs laboratories specialized in nuclear technology in Vienna and Seibersdorf, Austria, and in Monaco.
Due to the involvement of both my husband and I in the regulation of uranium mining in Australia, we have a few friends who have worked for the IAEA in the laboratories and in the cleanup of mining areas in parts of the old Soviet Union. One of them had his office across the corridor from the man most responsible for the data on Chernobyl. David did a short consultancy in the Vienna offices. The scientists of the IAEA take their responsibility for nuclear safety very seriously and come from dozens of nations.
When Japan proposed the water discharge from the Fukushima nuclear plant, the IAEA examined the strategy very closely and gave its blessing but insisted that the discharge be monitored very carefully. Japan gave itself a tough standard of 1500 Bq/L knowing that the WHO standard for drinking water was 10,000Bq/L. A lot of data is available online which I have viewed. It is possible to see the data for every tank on site. Some of the tanks containing water cleaned up early in the process contain a fraction too much caesium isotopes. This water will be cleaned up again before release. The IAEA has a website that shows the monitoring data during the discharge in real time.
A snapshot in time (as I am writing) is shown below:
Green dots show that the data indicates that everything is OK. A red dot would indicate that the nuclear company, Tepco, should take action. A grey dot shows that a pump is not operating.
The water after dilution is shown as 207 Bq/L, way below the level Japan set for itself and only 2% of the WHO drinking water standard. It is about this amount each time I looked at the data.
What fascinated me was that seawater has slightly more radiation than the treated water as measured in cps. Although details are not given, Geiger type counters probably do not pick up tritium as the beta rays are so weak. These measurements are used to ensure other radioactive elements such as caesium are not being discharged. As the data shows, the levels in both the treated water and the seawater are very low.
In my last couple of posts, when trying to picture what enormous numbers mean, it was shown that 3 big teaspoons of natural rain falling on my head in Australia would contain about a million tritium atoms. This sounds really scary but as I will gradually show, it is of no concern. Washing our hair would increase the amount.
Tritium forms in our atmosphere every day when cosmic rays hit gases in the air, mostly nitrogen. It is washed down into rivers and streams to the ocean as well as falling directly into the ocean. Tritium forms a minute part of the background radiation that surrounds us always. Life evolved on Earth at a time when background radiation levels were 5, maybe even 10 times higher than today. All life with its complex biochemistry deals with low radiation levels so well, that there was never a need to be able to sense radiation and hence avoid it.
Tritium is even less dangerous than most sources of ionizing radiation. It gently sends out low energy beta rays. Too much of anything can kill us. High dose radiation is dangerous, and we need protection from it. The bigger the ray particle and/or the energy involved, determines just how harmful various forms of radiation are. Tritium’s beta rays are low energy electrons. It has a half life of about twelve and a half years. The rays are so weak, they cannot penetrate the skin. If swallowed most of it leaves as water in our urine within a day or so. If tritium water vapour is breathed in the World Health Organisation standard for drinking water is 10,00, it leaves again within minutes.
This is an ironic look at statements made out to be scientific fact. Most of the fear about radiation is not true and certainly not scientific fact.
I am still scared! A million sounds such a lot!
If you read my earlier posts on tritium, you may recall that 1 TU (Tritium Unit) is one tritium atom in 1018 hydrogen atoms. This is far smaller than one person among all the people on earth. You need to visualize one person only on as many planets as there are people on earth all with similar populations as Earth. Three big teaspoons of water contain 12*1023 hydrogen atoms. One million in 12*1023 is equivalent to 1 in 1018. It is mind boggling small.
Australia receives between 2 and 3 TU in rain falling on our land. 1TU is equivalent to 0.118 Bq /L of water. One becquerel (Bq)is defined as the activity of a quantity of radioactive material in which one nucleus decays per second. The World Health Organization standard for drinking water is 10,000 Bq/L. To reach the same levels of radioactivity in 3 big teaspoons of our rainwater you would need to drink about a quarter of a million litres of water in one day. Whoops! A small fraction of that amount of water as just H2O would kill you.
The human body has 30 to 700*1012 cells. Another enormous number.
So single strand DNA breaks occur naturally in the whole human body over 1016 times a day. This is another enormous number. Our bodies repair this damage.
These slides have been taken from a talk I gave to a group of CSIRO alumni.
The message is that the radioactivity associated with the Fukushima discharge will not harm anything physically. Fear may cause damage to many livelihoods.
The final step: making sure to put numbers in their right context. Are we looking at the whole picture? What works for some people may not work so well for others.
There is a tremendous amount of excellent technical information about radioactivity on the web, but it is often hard for anyone without that specific training to understand. There are also a lot of misleading statements and conclusions on the web. These even appear in peer-reviewed scientific journal articles such as the Chinese paper given as a link in my blog Tritium Trivia. This paper showed the results of modelling various releases of tritium water from Fukushima. Unfortunately, the last step was forgotten. Showing great expanses of red all over the Pacific Ocean would lead nearly everybody to say “How terrible! Japan is polluting the Pacific Ocean with radioactive material.” However, at the end of the document the background levels of tritium in the Pacific Ocean are quoted and this puts the release data into perspective. But nowhere in the paper was the context of the data given, that is that the levels of tritium were so low compared to normal background levels that they would be impossible to distinguish from the background variability.
I have made the decision that I will try to make my blogs as easy to read as I can so that they are suitable for most users of the web. This is not easy with technical information and my background of writing technical reports. Word has an editor function that allows you to calculate the readability of the document. Yesterday, for the very first time I managed to achieve my goal.
I was so excited that I quickly finished the blog and published it only to realize within minutes that I had forgotten a crucial step. I had jumped to the conclusion too quickly and not fully put the information into context. I rapidly edited the post and republished it. However, my subscribers received a set of comments that were not quite right. In my joy of finding a way to explain just how low tritium levels can be, I forgot just how many hydrogen atoms are in a little water. 18 g of water (one mole for the technocrats) contains 6*1023 molecules of water, 12*1023 hydrogen atoms and about a million tritium atoms. This is still just as teeny in radiation terms but the numbers 1 and a million sound so different. 1TU is only 0.118 Bq/L. I will explain what this means in future blogs.
I apologize to my subscribers. At my age you are allowed to call it a senior moment. However, I suspect that in our current haste over climate change mitigation, we are all making similar mistakes. We do the first part of the work but then forget to really look at the big picture and put everything into context.
I have been having so much trouble writing this blog. There are so many people out there who can communicate in a clearer fashion than I can. Why would my blog make any difference to a world that needs so much help? Both you dear reader, and I need to remember that if we even educate or influence one other person, we have helped to change the world for the better.
It is impossible to share with others everything that I have learnt on this nuclear journey of mine, but I must try. Without nuclear power, we will find ourselves going back to the dark ages which was such a cruel world.
Renewable energy technologies can only take us so far. There are three major reasons for this. The first is energy density. Wind and solar power cannot provide enough energy to both manufacture themselves, mine the materials they require, recycle some of their components and still produce electricity for other purposes. Nuclear can. Secondly, the resources to make enough wind and solar for both the developed and the developing world don’t seem to exist. Basic physics ensures that the energy required to completely recycle components is enormous.
Finally, the land requirements for wind and solar are huge but not impossible. Unfortunately, to find enough land, we destroy or badly harm biodiversity of all types including forests, wetlands, mangroves and our precious and diminishing arable soils. Nuclear power requires less space despite the stupidity about radiation caused by fear.
Nuclear Now is a 2022 American documentary film, directed and co-written by Oliver Stone. It is a film that I would like everybody to watch. It is very long film and really has too much information for one sitting. I have provided a link to the film below. Do make use of the link while it still works.
There is also a book that I would love everybody to read. Jack Devaney makes some points that I believe should be considered by regulators in every country. The book is finally available as a paperback from a number of sources. It is a big book but even reading the beginning chapters and the final chapters is more than worthwhile.
The book is not as negative as the title “Why Nuclear Power has been a Flop”suggests. The book supplies many fascinating insights.
“Jack Devanney is the principal engineer and architect of the ThorCon molten salt reactor power plant. Since 2011 he has pursued his idea of using shipyard construction technology to mass-produce safe, inexpensive power plants that can bring the benefits of electricity to all the world, with no CO2 emissions. He married the advanced nuclear technology developed and demonstrated by Oak Ridge Laboratory with his own engineering experiences with ships, power plants, and energy.” – Amazon.com
Jack also speaks on Decouple and has lots of information and fascinating ideas on his Geordian Knot News. http://jackdevanney.substack.com
The photo shows my scientist husband Dr. David Jones. David and I have long conversations about the environment. We have a small consultancy. I do the books these days and David does all the work. David is a geochemist with particular expertise in mining and water quality. He began his career with the CSIRO in the Coal and Energy Division, worked for mining companies as an Environmental Scientist and finished full time work as the Research Director for the Research Institute of the Supervising Scientist. We met each other on opposite sides of the table at a technical meeting about Ranger Uranium Mine a few years before I retired. David is an invited speaker on mining issues internationally. He was a member of the panel that produced the Pepper Report on the Technical Evaluation of Gas Extraction in the Northern Territory.
I gave a number of presentations on nuclear energy last year, including meetings to inform the public about wind farm projects proposed for far north Queensland. I even did my very first TV interview.
Then the Environmental Impact Statement on the proposed Chalumbin wind farm was made public for “positive comments” (word used in local newspapers by the developer). Under our current system, comments can only be sent to the project proponent, that is the developer. The Australian tax-payer heavily subsidises the project proponents who in the majority of cases are foreign entities. The project proponent then has to change their document and it is sent to the Federal Environment Minister with the comments. This process is triggered if species are at risk of extinction. The Minister then makes a decision about the project.
I spent months reading, evaluating and commenting on the massive document for this crazy project. I will write some of my next blogs on some of our findings. The Rainforest Reserves group has been tireless in its endeavours to save our precious tropical forests. Special mention should be made of Carolyn Emms and Steven Nowakowski. At this time we still don’t know the outcome, the decision has been put off for months time and again.
I ended up in hospital a couple of times this year threatened with blindness. Hopefully the worst is over. My mobility and independence is more limited. David has been wonderful with constant emotional and physical support.
I have never stopped caring about our future. The possibility of becoming blind was so threatening as I never stop investigating. I read various viewpoints on many issues at every level of detail. An abstract of a scientific paper is never enough. A sense of urgency has grown. I should be sharing my insights so that they are accessible to all who wish to know more. I need to learn more about ways to communicate technical ideas in ways that are more easily understood.
I want to express my immense gratitude to Dr Gus Yip for helping me overcome my periods of blindness. I continue to live in hope that I will retain enough sight for years and years of serving our environment.
I plan to share some of the insights my journey has given me over the last year in a variety of formats over the coming months.
The Damage from One Wind Farm May Not Cripple the Environment – But Lots of Them Could Be Catastrophic for our Biodiversity
The Queensland Renewable Energy Zones take in the entire length of the Great Dividing Range. Wind farm projects being sanctioned in the wet tropics catchment area alone are numerous and in areas of high biodiversity value, close to World Heritage areas and on the mountain ridges. This is death by a thousand cuts, and nothing is done to even evaluate the consequences. There is no mechanism either under the Commonwealth EBPC Act or at state level to consider cumulative impacts. Our World Heritage Wet Tropics is listed as the second most irreplaceable natural World Heritage site on earth by the International Union for the Conservation of Nature (IUCN). Wind turbines are planned within 500m of the World Heritage site. The forest is unbroken between the some of the planned wind farms and the World Heritage areas.
Fragmentation of Forest and Edge Effects Destroy Biodiversity
Edge effects are a prominent driver of fragment dynamics, strongly affecting forest microclimate, tree mortality, carbon storage and a diversity of fauna.
The hydrological regimes of fragmented landscapes differ markedly from those of intact forest. Desiccating conditions may penetrate up to 100m into areas near the roads. Streams in fragmented landscapes experience greater temporal variation in flow rate than do those in intact forests. Cleared areas have less evapotranspiration and rainfall interception and absorption by vegetation. Rapid runoff promotes localized flooding in the wet season and stream failure in the dry season, with potentially important impacts on aquatic animals.
Even narrow forest roads (20–30m) result in increased tree mortality and damage with wide-ranging alterations in the community composition of trees and undergrowth. Many insects and other fauna will not cross narrow roads, yet hundreds of 70m roads are proposed.
Proposed Wind Farms Could Add Pollution to the Great Barrier Reef
Projects like Chalumbin lie on the head waters of the river catchments of the Wet Tropics Area. Hundreds of kms of unsealed 70-metre-wide roads that cross waterways have the potential to dump sediment and other pollutants down rivers through areas of World Heritage Rain Forest and cane farms out to the Great Barrier Reef. Farmers fear they will be blamed. There is no provision under the EBPC Act to consider any type of off-site impact. Water quality is not considered.
Building Wind Farms in Forests is a Terrible Waste
Forests are giant carbon and water storage batteries. Why discharge greenhouse gases to the atmosphere by land clearing and lose all the benefits forests provide in the mitigation of climate change? When they are gone, we lose all the carbon sequestration and cooling they do every day. Natural forests do this better than plantation forests.
By clearing forest to build wind farms, we lose a very substantial proportion of the carbon savings we would make by siting them elsewhere. Much of what we gain in lower carbon emissions from wind power, we lose by destroying forest.
Even worse, we contribute to climate change through the loss of a range of mechanisms forests provide long before any of the benefits of wind energy mitigate carbon emissions. This is making climate change worse needlessly on a temporal basis which is the opposite to why we are setting 2030 targets.
We are also desecrating our irreplaceable biodiversity, Aboriginal cultural heritage, and tourist jobs in areas of high importance. High quality patches of remnant forest are rare and precious, and some of windfarm project areas were being planned for inclusion in National Parks in the future. What a waste!
Loss of Forest Affects Cloud Formation and Alters the Hydrological
Loss of forest on mountain tops will lessen rainfall and lead to more droughts and flooding. While one project may have almost negligible impact on weather, more and more wind farms are proposed. A major failing of the EBPC Act is the absence of assessment of cumulative impacts. The wind farm projects change the land use from forest to major industrial, permitting major extensions to each project being possible with much less assessment. This will impact on both our World Heritage listed Wet Tropical Forests and Great Barrier Reef while drying our inland agricultural lands to the west.
Consideration of Aboriginal Science and Sites of Aboriginal Cultural Heritage
Aboriginal science is not considered by developer-led ecologists. For example, Traditional Owners speak of the impacts to migratory birdlife and the harms related to wildlife removal – why are their voices excluded from any meaningful reporting?
Many of these sites are sacred regions of high significance for the tribes and their clans’ peoples, including The Ancestors. What should the response be when it is stated, “Our culture means more to us than anything else. We know where we belong – we belong to the land. It is the land where our Ancestors reside, and where our future generations will go too. The land should remain undisturbed”.
Are We Getting our Money’s Worth?
It is very difficult to estimate how much the renewables sector is being subsidised by taxpayers’ money.
On Sky News in 2020, Nationals MP Barnaby Joyce said it is important to remember each wind turbine costs the taxpayer $660,000 per year, per tower, due to the government subsidy scheme for renewable energy developments. He was commenting on a $600 million, 77-turbine wind farm proposed just outside of Tamworth.
In Conclusion
What worth do we put on the loss of biodiversity and ecosystems, stunning landscapes, natural carbon sequestration and storage. Forests cool the earth and make it rain. Forests soak up runoff like giant sponges and help prevent flooding, while recharging aquifers. Forests produce lots of oxygen for us to breathe. They clean our air and water of pollutants so that most of the water going to the Great Barrier Reef is clean. Forest stabilises the soil so turbid water does not kill corals. Our drinking water is cleaner too! We are putting so much at risk by building wind farms where they should not be.
What is the cost of desertification, increased flooding and droughts? I thought the idea was to fight climate change, not make it worse.
As a reminder: The International Union for the Conservation of Nature (IUCN) has listed Our World Heritage Wet Tropics as the second most irreplaceable natural World Heritage site on earth.
We are about to turn areas close to the World Heritage Wet Tropics, such as at Chalumbin (Ravenshoe) below
into this.
This photo taken at Kaban (Ravenshoe), the least valuable of all the proposed sites in the catchment of the Wet Tropics, and only shows the site of two turbines. There are plans for hundreds of much larger turbines for the Wet Tropics catchment; many projects are already in the system. Hundreds of kilometres of roads wider than these have been designed.
We have seen and heard strong Far North Queensland Jirrbal truth-telling about their desire to preserve forest in the Wet Tropics catchment. Many of these sites are sacred regions of high significance for the tribes and their clans’ peoples, including The Ancestors. What should Australia’s response be when it is stated, “Our culture means more to us than anything else. We know where we belong – we belong to the land. It is the land where our Ancestors reside, and where our future generations will go too. The land should remain undisturbed…we are concerned about losing our identity”.
In my experience, the Jirrbal people seem to be becoming more and more positive about the use of nuclear power in Australia. It is viewed as a way of ensuring no more forests are desecrated and hence protect irreplaceable cultural heritage. A forest is not just trees and they cannot be replaced just by replanting trees. Cultural heritage is forever, and a loss of biodiversity and wildlife and totems cannot be replaced. Important decision-making is required as the ramifications are permanent and forever.
Some of my dread about more renewables arises from:
some of our best forests are being desecrated to build wind farms;
some of our best agricultural land is being covered and possibly polluted with solar farms;
no consideration is being given to the cumulative impacts;
no plans are in place for either waste disposal or recycling at the end of usefulness.
I am no longer convinced that renewable energy is cheap because of all the ancillary costs.
Everywhere that high levels of wind and solar power exist, power prices and grid problems have risen sharply if there is not high levels of hydroelectricity or geothermal power available.
Personally I think renewables should be part of the mix, if much more thought is given to their placement. Large areas of Australia have very low rainfall and relatively low biodiversity or have already been highly disturbed. Many of these areas have great solar and wind power potential if transmission lines are more carefully planned.
I would love you to spread it far and wide. These videos were recorded in Cairns 15 May. The presentation by Steven Nowakowski is wonderful. Steve is a photographer who really cares about our special places.
Early next month I will finally give a series of talks to our local University of the Third Age (U3A). It is my way of sharing some of what I have learnt. The omicron variant of COVID-19 postponed many of my activities including these lectures.
The act of putting the presentations together, taught me how little I knew about these issues. I have learnt so much in the process. I have finally decided to present the contents of these lectures in my blog with encouragement from friends.
During the preparation of the talks, I spent many days being thrown from one viewpoint to another but did not stop until I had satisfied myself as to the basic facts. I have tried to take into account the biases and background of each source.
Luckily, I have been able to access many online university courses through EdX on topics ranging from batteries, electric cars, critical raw materials, energy economics, carbon capture and storage, hydrogen, nuclear terrorism and “Living at the Nuclear Brink” plus “Nuclear Energy Science.” (https://www.edx.org)
I have collected and read scientific papers, books, reports and articles, videos and films. Many of the graphs in these presentations have been taken directly from sources such the International Energy Agency (IEA). The one below has been modified to make the labelling more visible.
Despite all the rhetoric about solar and wind power and all the gains made so far, Australia faces enormous challenges. Reducing our use of CO2 emitting energy sources will be a hard road as can be seen from the graph above from the International Energy Agency (IEA) of which Australia is a member.
Unfortunately, we often equate energy with electricity which can give a very false picture despite our massive uptake of residential solar. Are we counting the CO2 emitted during the manufacture of green technologies: battery storage, electric cars, wind turbines or solar panels? Energy use is only part of our emissions of greenhouse gases and electricity is only part of energy production/consumption. Many positive changes sit on the horizon. For example, hydrogen could reduce the use of coal used in steel manufacture, but hydrogen still requires a lot of energy as electricity for its generation.
Australia’s energy production almost doubled between 1990 and 2020. Until a decade ago, our CO2 emissions were also rapidly rising. This rise has now flattened, principally due to greater use of gas over coal but gas prices could threaten this improvement. At best gas can only be a transition measure. Our CO2 emissions rose by 45% between 1990 and 2020. (ref: https://www.iea.org/countries/australia)
Australia is the world’s 14th highest emitter, contributing just over 1 per cent of global emissions. The Australian Government tracks the nation’s greenhouse gases emissions through the National Greenhouse Gas Inventory. According to the December 2020 update, Australia emitted 499 million tonnes of carbon dioxide equivalent. (ref CSIRO) This a lot for a country with 0.3% of the world’s population.
We are one of the world’s highest green-house gas emitters per capita in lots of categories. We have reduced methane and nitrous oxide emissions substantially but are still very high in world terms. These gases are partly produced in the agricultural sector but changes in farming practices have already helped to halve these emissions. (ref: https://ourworldindata.org)
Data varies from source to source and data is often grouped in different categories making comparisons very difficult, but the big pictures are clear.
Tasmania produces clean, green electricity according to a fascinating live site on electricity production around the world (https://app.electricitymap.org/zone/AUS-TAS Approximately 60 % of Queensland electricity comes from coal and roughly 40 % from solar. The data I found on wind was sketchy.
The carbon intensity information below cleverly illustrates the differences energy source makes to carbon intensity of electricity generation. Grant Chalmers created the video using data from http:/docs.co2signal.com. Countries with lots of nuclear power and/or hydro have low carbon intensity per MW.
One of the issues not discussed enough relates to the materials needed for the green transition. I have heard very little discussion of the lead-in time for all the new mines needed for essential materials.
Does nuclear power have a place? Looking at world-wide statistics, it plays a huge role in those countries with low carbon intensities.
Until recently, my stance was that countries like Sweden could safely use nuclear power because they developed and implemented long term policies. When Australia could not even manage low level waste sensibly, I doubted we could safely use nuclear power.
Recently, many countries are changing their views about nuclear power. Currently, Australia has a ban on nuclear power but has a research reactor at Lucas Heights near Sydney producing medical isotopes.
Good background knowledge is essential for meaningful discussions about Australia’s energy future. By sharing my journey, I hope to put others on a pathway to learning more about low carbon technologies and the challenges we face.
The first of the series of talks is called Why Do We Fear Nuclear Power?
It is presented as a series of 6 blogs which are labelled a to f so that they can be accessed in a logical order.
The second and third lectures examine the question
Does Nuclear Power have a Place in the Era of Decarbonisation?
The final lecture in the series is called Nuclear Power for Today and Tomorrow
I worked as an Environmental Scientist in China and Hong Kong for a decade. My son married a wonderful Chinese lady and I have 2 grandsons living in the New Territory of Hong Kong. Having worked in Hong Kong both sides of 1997 and the transfer from British to Chinese sovereignty, I have some sympathy with the younger generation of Chinese who have enjoyed a democratic political situation for most of their lives. However, it should be remembered that Hong Kong under the British was far from democratic until the last Governor Chris Patten moved quickly to make changes.
The Australian media often describes China in a critical tone. There seems to be little understanding of the insults that have been delivered and copied around the world. Yes, we do need to stand firm on many critical issues but the language in which our views are expressed are often insulting and culturally inappropriate. In some cases, we need to be careful that it is not a case of the pot calling the kettle black. My young teenage grandson explains the interpretation given to many of our press articles. Of mixed heritage, he currently sees himself as Australian with strong Scottish genes.
China has done so much to help the Earth’s climate. The birth rate in many countries falls with prosperity and educational levels. China recognised the problems associated with massive population growth and brought in the One Child Policy. The degree of social and family disruption has been enormous and still continues – but the population curve has been slowed.
I sometimes hear that China is not doing anything about climate change. It is a difficult challenge to bring hundreds of millions of people out of poverty while decreasing CO2 emissions at the same time. In a recent speech by Xi Jinping, general secretary of the Communist Party of China Central Committee, Xi stressed that the country’s green pursuit is no easy job. He said that strategic thinking must be improved as people should bear in mind the big picture throughout the entire process of delivering the carbon peaking and neutrality goals.
Xi Jinping stated that the relations between development and emission reduction must be properly handled. Cutting emissions is not aimed at curbing productivity or no emissions at all. Economic development and green transition should be mutually reinforcing.
While bringing down carbon emissions, efforts should be made to safeguard energy security, industrial and supply chain security, and food security, as well as ensure people’s normal daily lives.
Simon Evans posted the following graph on Twitter
Yicong Zhu, an analyst of renewable energy for Rystad Energy expects over 50 gigawatts of utility solar PV and onshore wind projects to be connected to the grid in China, despite the end of national subsidies for these energy sources. Large battery storage facilities to match with these projects are proceeding. New ultra-high voltage cross-province transmission lines are being constructed to match the projects.
According to Xi Jinping: It is necessary to accelerate the development of new energy sources such as wind, solar, biomass and hydrogen energy that have scale and benefits, coordinate hydropower development and ecological protection, and actively develop nuclear power in a safe and orderly manner.
The numbers are changing rapidly, China opened a nuclear power plant in December and one more on 1 January 2022. The World Nuclear Association data lists China as having 53 operating plants, 18 under construction with another 200 planned or proposed.
How can anyone claim China is not doing its share of climate change mitigation? One argument rests on the fact that China is using increasing amounts of coal. CO2 levels emitted from China are increasing. However, it often forgotten that a lot of the metals and rare earth elements needed for ultimate decarbonisation are either mined or processed in China and this all takes energy for electricity and metallurgy. Then there is industrial production of the equipment to generate renewable power. Australia just imports wind turbines and solar panels. We are not manufacturing the equipment although we do mine ores for such essential metals as iron, copper, aluminium and lithium.
In 1999, I was invited to a special dinner and announcement. I had been leading some environmental studies for the Kowloon Canton Railway Corporation at the time. The invitation was a real honour and the memento of the occasion given to me is shown below.
Translation: China Hong Kong Railroad Association Establishment Celebration. 1999 January 25
The big announcement was the plan by China, with the participation of Hong Kong, to build a very extensive network of electric high- speed trains throughout China. By 2008 the first line was operational from Beijing to Tianjin. By 2013, 10,000 km was operational. There is now about 40,000 km of track and 70,000 km will be built by 2035.
Such projects require massive quantities of concrete and steel. Until innovative technologies replace current methods of production, massive amounts of CO2 are generated to make these materials. In operation, Chinese high- speed trains are powered by electricity and unless the electricity is very green, more CO2 results. Train travel has already reduced aeroplane fuel use in China. It is hard to see how China can reduce greenhouse gas (GHG) emissions in the near future but long term, China is surely on track to massively cut GHG emissions.
Early this morning, I watched the First Nations People ceremonies in Sydney on ABC TV. Then I chatted with a friend. After lunch, my husband David, who had been working hard reviewing a paper for our small environmental consultancy, needed to escape our house for a while.
The Atherton Tablelands has a wonderful mix of forests and farmland surrounded by hills and mountains. We drove out in the direction of the hectares of blueberry production. Yes, we do grow blueberries in Far North Queensland. We are blessed with a range of micro-climates and soil types on the Tablelands. Some soils are volcanic in origin and rainfall varies from very little to almost too much. Atherton itself is about 850 metres above sea level.
Here are a few photos from our little trip.
Don’t you love my horns? Part of Atherton can be seen in the background.I am just magnificent!So am I.This little shed is almost a century old and is made of chamfer boards. Note the tangle of discarded power lines.This old shed is also made of chamfer board. Old maize silos stand proud to the right.Details of the roof trusses in the old shed. A close up of the chamfer boards is shown below.
I am confused. I have been reading articles spruiking up ACT’s wonderful performance on the renewable electricity front. The ACT only produces about 5 % of its energy needs. According to SBS News on January 1, 2020:
The rest is drawn from the National Energy Market, which is overwhelmingly powered by non-renewable energy sources like coal and gas.
So for every watt of ‘dirty’ energy that Canberra draws from the grid, it pays to feed the same amount of ‘clean’ energy back into the system.
While 21 per cent of those payments are mandatory under the national Renewable Energy Target scheme, the ACT government pays the remainder voluntarily, at a cost that is expected to peak next year at around $5.50 per household per week.
The renewable energy the ACT purchases is drawn from solar and wind farms spread across the Territory and four other states.
A close look at http://opennem.org.au shows that while South Australia and Tasmania may have some renewable electricity to spare now and again, imported energy from Victoria and New South Wales would come principally from fossil fuels. Both Tasmania and South Australia also rely on some imported electricity.
This seems to be a big game of smoke and mirrors. If ACT buys renewable electricity from other states, then those states have less for themselves. Money might change hands but the overall CO2 production arising from that day’s electricity generation remains the same.
I would prefer that Canberra showed integrity and indicated just what type of sources really light up the city.
OR am I too old- fashioned preferring fact instead of fancy words?
Until we moved to Atherton, I thought all bats used sonar. We have a wonderful bat hospital here. About 50% of bat species do not have sonar and are susceptible to colliding with many objects. Many of the injured bats brought to the hospital have had their wings shredded by barbed wire fences. I have heard that bats are drawn in by wind turbines. Our area has many different species of bats.
I would like to introduce you to Cecil, a micro bat we rescued at our place. Cecil’s problem was believing he was ready to leave his nursery and fly with the rest of the adults at dusk. He was just a little too young and his wings were not fully developed. He flew a few metres and landed near our shed. He crawled in and managed to get tangled in bird netting. Next day, when the weather was already hot, we heard his cries.
I tried to follow Mummy, but my wings were not big enough yet!
Cecil was obviously badly dehydrated but despite our efforts we could not get him to drink. Jenny, the founder of the bat hospital, came to the rescue. He was too dehydrated for her to give him water using simple equipment so off to hospital he went for a couple of weeks. Finally, he was ready to fly and join the adult bats. By this time, he was almost as big as the rest of the bats. The photo below was taken just before he was launched.
Microbats like Cecil do use sonar, just look at his big ears. Cecil and other Little Northern Freetail Bats love to eat insects and keep the mosquito levels down.
I found this fascinating simulation of CO2 production during electricity generation. It is out of date now as the data was collected in July 2019.
The simulations for Sweden, France and Ontario clearly show the low CO2 levels generated when nuclear power is a major source of electricity. Germany has shut down more nuclear power plants since 2019 and is more and more dependent on fossil fuels despite its campaign to use more wind power. The Tesla battery in South Australia was in operation before July 2019.
I had been hearing statements like “South Australia runs entirely on renewable power.” This was contrary to many articles I had read that suggested that running on only renewables was very difficult if not impossible unless the mixture of sources included sufficient hydro power.
Today I learnt about the likely source of these statements. On the Facebook page of Australian Greens for Nuclear Energy – unofficial, the idea was fact checked. It seems Senator Sarah Hanson-Young authorised the following statement made yesterday under the banner “SA BREAKS ENERGY RECORD – RUNNING FOR A WEEK ON RENEWABLES”
“GOOD NEWS! South Australia sourced over 100 per cent of the electricity it needed from renewable power for a week leading up to December 29 – a new record. Now is the time to get rid of coal, gas and the Morrison Government ”
I checked the reference to the energy information. A snapshot is shown below. It is hard to see the zero line but it is clear that SA produced sufficient renewable electricity for its needs for the 3 days before 29 December 2021, on average, on a daily basis. These days were all days of lower electricity consumption and of higher wind power production. Renewables also produced very close to 100% of consumption on Christmas day and yesterday. This is a wonderful result, but SA needed some form of gas generated power for most of the month. It was dependent on dirty imported power almost every day. To claim a week on renewables by averaging excess exported green power on the three days with the 4 days before is game playing and hides the critical issues relating to balancing green energy production with electricity consumption on a minute-to-minute basis.
The Save Chalumbin campaign has much support locally including both our local federal and state MPs. It is easy to find information about Chalumbin by just googling the name. Destroying ecology and habitat critical to the survival of endangered species, is not “green” power!
Even according to the project’s referral under the EPBC act, Epuron states: “Despite the avoidance, minimisation and mitigation measures…, the project is anticipated to have a significant residual impact on the greater glider, the red goshawk and the magnificent brood-frog.” Epuron sold the project to Korea Zinc about a month ago. Did they realise Chalumbin was one step too far?
The Red Goshawk is probably Australia’s rarest bird of prey. This endangered raptor lives at Chalumbin.
At that first coffee meeting, I mentioned that nuclear required a lot less space on the ground than renewables. Some of the campaigners were thrilled with this idea, and even offered to develop a website for me so that I could blog about the benefits of nuclear power. This offer gave me the emotional impetus to act but I refused their offer of financial support to set up the website. I wanted to maintain my independence. Over the last couple of months, I have tried ridiculously hard to see both viewpoints on many issues. It can be hard to determine the facts and undertake your own assessment, but I have been trying to do so.
Since finishing slides for my presentations, the group has sent me some remarkably interesting documents about many topics relating to decarbonisation which have added to my already large and growing collection. I love articles that quote their sources because then I can go back and really look at what the original article said and look at actual data and assess it when I can. I am grateful for the support. There is so much out there and of such varying quality.
I do believe there is a real place for renewables, but we must not be blindfolded to the downsides. More and more, I do see a place for nuclear power and sincerely hope that many of the new designs for nuclear power plants are implemented. Some days, I have felt negative about the chances of nuclear power really taking off in time but slowly and surely, I am becoming increasingly optimistic.
There are now green groups and many individual environmentalists who once shunned the use of nuclear power generation, changing their minds. The Green Party in Finland is pro-nuclear. There are now members of the Green Party in Australia who are pro-nuclear. I have been disappointed by the Swedish Parliament who seems to be dominated by the Green Party and is planning, at huge financial cost, to shut down working nuclear power plants. This is even though most of the Swedish population are still pro-nuclear.
In the last week, I have discovered some of the pro-nuclear groups operating in Australia. Most of their information is fascinating and written by people so much more knowledgeable than me. I have gathered so much material about renewables and nuclear that I feel this blog should share some of the information or at least direct others to great sources.
I would like to say a big thank you to Helen Keough and Caroline Emms who have been working so hard to save Chalumbin. Their friendship and encouragement keep telling me to get out there and do what I can.
Recently, having coffee with a friend, we were chatting about wind power. The Mount Emerald Wind Farm lies between my town, Atherton and its sister town, Mareeba. Now it seems that the Queensland Government has planned many much bigger wind farms in our area. It was thus that I first learnt of the Save Chalumbin campaign. The area designated for this next wind farm lies beside the Wet Tropics World Heritage Area. As locals, we believed Chalumbin to be a conservation buffer zone. Forest will be cleared to build the wind farm. Prestigious ecologists believe the project will severely affect many species of wildlife including the endangered Red Goshawk and such vulnerable species as the Brood Frog and the Northern Greater Glider. It is Jirrbal land and contains places and artifacts of great cultural significance.
Until I heard of this campaign, I had not been thinking about the adverse footprint that the production of wind energy could cause.
The project area is more than 1000 ha of high biodiverse forest. At minimum, land will be cleared directly under 95 big wind turbines. Additionally, there will be 146 km of access tracks from 60 m to 100 m wide, substations, concrete batching plants and construction areas. Clearing for high and low voltage power lines both within and outside the project area will occur. According to the project proponent, long-held forested grazing properties Glen Gordon and Wooroora Station, 15km southwest of Ravenshoe, were identified because the area is an “excellent wind resource” and for the “proximity” to the grid.
This is a view looking south over much of the land to be carved up and fragmented. This Timeline photo has been copied from https://m.facebook.com/KeepChalumbinWild
Renewable wind power farms are currently being fast tracked by Queensland Government and have separate rules for environmental assessment. The proposed Chalumbin wind farm has triggered the EPBC Act.
Yes, it is urgent that we decarbonise Earth, but we do need to be incredibly careful that while saving our climate we do not destroy our world.
The assessment of renewable energy projects needs to be undertaken on a cumulative basis. It is ironic that the region now chosen for wind farms and associated infrastructure was banned for use by timbergetters. Our timber mills are now gone. What happens to all the wood resulting from the clearing for these projects? Is it burnt? Land clearing is supposed to stop! The Magnificent Brood Frog lives only on the Atherton Tableland near Ravenshoe in QLD. This is where all the windfarms and associated projects are planned.
Four broad habitats exist in the Chalumbin Wind Farm project area:
Notophyll vine forest,
Riparian zones,
Rocky pavement shrub complex, and
Eucalypt woodland.
Part of the property where cattle graze: Ben Harden
One of my burning questions was: why are wind farms being built over 1500 km from where most of the power will be used? Tim Flannery gives a reason in his book The Climate Cure. It seems the wind blows in a contrarian fashion to that of southern areas. Hmm! The Mount Emerald Wind Farm has been operating for a few years now but not at its capacity. There are technical reasons for this associated with the grid. I know that at one stage, the wind turbines were only turned on when the Barron Gorge Power Station started operating each afternoon.
The whole network of high voltage lines will need upgrading as the various projects are implemented, cutting through more swathes of forest near the peaks of our mountain ranges. There must be other alternatives.
The error is the result of letting fear rule your actions.
I have never blogged before. I still haven’t posted the blogs I have written. It must be time to overcome my fears.
How can I blame anyone for their fear of nuclear power and radiation, when they have had little opportunity to learn about these subjects? We are bombarded with emotional statements by the media and the internet giving negative frightening viewpoints. The media often use the phrase “the Fukushima nuclear disaster” to describe the results of the tsunami that hurt so many people in Japan.
My first PowerPoint presentation examines these fears. Why are we afraid of nuclear power? Nuclear power is illegal in Australia.
Perhaps with time I will be able to present my talks within my blog.
We have managed to spend time with friends and my husband’s relatives in outside patios and balconies despite Omicron putting a damper on hugs and kisses.
I have been trying to understand my world and at times have become extremely confused. I have working hard to put a series of lectures together for my local University of the Third Age group. I feel a real drive to share some of the information I have garnered.
One of my friends posted the image below on their Facebook page. I don’t know its origin. It summarises how I feel.
I need to put aside all my recent learnings and give what I can to the Wet Tropical SoilCare group for a time. In a fit of goodwill, I offered to be Treasurer this year and keep the database of members updated. What I didn’t realise, there was a plan to hold a big conference again in 2023, 5 years after we organised the last Australian Biological Farming Conference.
By looking after the biology of the soil using appropriate farming methods, so many benefits arise: healthier plants, less chemical use, less fertilizer use and better farm economics. The carbon content of the soil is of particular importance to climate change mitigation and leads to better water holding capacity. Better grazing and pasture practices alone can store immense amounts of carbon in the soil thus substantially mitigating other greenhouse gas emissions.
One of the joys of retirement is being able to surf the Internet for hours at a time without guilt or criticism. Having been kept at home for long periods during the Covid 19 epidemic, I needed to keep my mind busy. I discovered MOOCs: university courses on the Internet posted for free if you don’t wish a certificate of proficiency. During December, I discovered there were a wealth of courses about energy production, batteries, nuclear proliferation fears, nuclear power, the minerals needed for green energy, electric cars, carbon capture and storage and so on. The courses were posted by universities in the United States, Holland, Russia, and Australia. My image of decarbonisation has changed.
About 10 years ago, my husband David and I visited Sweden. David was an invited speaker about uranium mining in Australia. He was the Director of the Environmental Research Institute of the Supervising Scientist at the time. We took the opportunity to learn as much as we could about Swedish nuclear power, community attitudes and nuclear waste disposal. We visited nuclear power stations, CLAB interim waste facilities, research centres and tunnels dug deep into the earth designed for safe waste disposal. Sweden was a great example of the successful use of nuclear power.
The more I read, the more sceptical I became of the directions the EU seemed to be taking. The EU denotes itself as being green, but it seemed to have so many unresolved issues. France and Germany seemed to disagree on the use of nuclear power. As I understood it, if they didn’t use nuclear power, either gas or coal was needed for baseload power to support renewables. Gas came from Russia at the time of writing and was in short supply and expensive. Germany uses “dirty” brown coal. I also learnt about a shortage of critical materials needed to manufacture solar panels, batteries, electric cars, and wind turbines just in the EU. What about the needs of the rest of the world? I decided to do a series of Power Point presentations for our local University of the Third Age and maybe even start a blog. Why are we so afraid of nuclear power? Can wind and solar power provide all the electricity we need?
“…we must accelerate action to keep the 1.5 degree goal alive.
Our fragile planet is hanging by a thread.
We are still knocking on the door of climate catastrophe.
It is time to go into emergency mode — or our chance of reaching net zero will itself be zero.
I reaffirm my conviction that we must end fossil fuels subsidies.
Phase out coal.
Put a price on carbon.
Build resilience of vulnerable communities against the here and now impacts of climate change.
And make good on the $100 billion climate finance commitment to support developing countries.
We did not achieve these goals at this conference. But we have some building blocks for progress.”
141 nations did agree to stop deforestation by 2030. However, the last agreement of this sort did not slow down deforestation – deforestation increased. Why 2030? It needs to be much sooner.
The challenge is huge, not only to reduce carbon emissions by today’s users, but to bring poorer peoples everywhere into the modern world if they so desire. Hundreds of millions of people around the world do not have electricity. Urbanisation has reached a pace where half of the population of many the world’s biggest cities are demanding more access to power. When not provided in adequate amounts, more and more electricity is and will be stolen. What right do we have as richer nations to demand others should remain in poverty? Energy is wealth.