The Earth is losing over 300 billion cubic metres of freshwater annually.
“The world is using and losing more freshwater every year as people, farms, and cities all demand more.
Drawing on satellite measurements and global economic data, a new report from the World Bank finds that Earth is losing roughly 324 billion cubic meters of freshwater annually. (This is equivalent to over 500 Sydney Harbours in volume.)
It is all to do with groundwater which makes up 99% of all liquid fresh water. Most of the time, all the water that flows in streams and rivers is groundwater. It’s called base flow. All wetlands are fed by groundwater, and most ecology that’s water-related has a groundwater feed.
Our continents are drying because we are changing the land surface so that groundwater recharge is reduced while we use more and more groundwater. We build our cities and towns so that instead of seeping into the ground, water speeds over concrete and bitumen into the sea. We build giant reservoirs and millions of little dams designed to stop water seeping into the ground and water is wasted to evaporation. We chop down forests and fill in wetlands. We bare the soil and water rushes across the landscape. Water from irrigation is lost to the atmosphere.
” About half the people in the world drink groundwater to some degree or another. And 40% of the food these days is produced by irrigation, but 70% of the irrigation water is groundwater.”- John Cherry in an interview with Alpha Lo of the Climate Water Project: https://climatewaterproject.substack.com/p/the-big-groundwater-crisis-food-water
There is a global water crisis caused by the depletion of aquifers around the world. We forget that water is an important greenhouse gas helping to make our world hotter. Low soil moisture leads to a greater need for irrigation and so the cycle further leads to more aquifer depletion. More and more water ends up in the oceans. Depleting water levels and increasing temperature work together to reduce agricultural yields and lead to famine.
Social consequences
Around the world, large parts of northern India, Central America, Eastern Europe, and the Middle East are already in drying basins where both demand and aquifer depletion are climbing together.
In Sub Saharan Africa, the World Bank report links drought driven water shortages to job losses for roughly 600,000 to 900,000 people each year, especially in rural farming communities and among women and older workers.
The mass migration to the cities in Syria because of water shortages, caused civil unrest and worse.
Iran is in severe trouble. In the past year, the country’s average annual rainfall has dropped to 45 percent below normal, and nineteen of its thirty-one provinces are in a severe drought. The dams and reservoirs that supply the capital have dried up and are operating at minimal capacity, with some at only 5 percent of reserve capacity. (Google AI summary from carnegieendowment.org/emissary/2025/11/iran-water-crisis-warning-climate?)
“Faced with a perfect storm of weather woes and decades of mismanagement, Iranian president Masoud Pezeshkian issued a warning to his country that the situation could deteriorate even further.
“We’ve run short of water. If it doesn’t rain, we in Tehran … must start rationing,” he said.
“Even if we do ration and it still does not rain, then we will have no water at all.
Continental drying also fuels more frequent and severe wildfires, especially in forests and grasslands that used to stay moist for most of the year.
The World Bank report estimates that a modest increase in the rate of freshwater depletion can raise the likelihood of wildfires by more than a quarter, and by about half in biodiversity hotspots where species are already under pressure.
As water tables fall and rivers shrink, ecosystems lose the steady flows they need to keep species alive.
Wetlands can turn into dry plains, fish populations can crash, and soils can degrade, which makes recovery harder even if rain eventually returns.
Land Use Decisions are a Key Driver of Continental Drying
The figure below shows effect of land use change on ground water resources, defined as TWS (terrestrial water storage).
Note: This figure illustrates the estimated impact of a 1 percent change in the respective land use type in 2002 (equivalent to approximately 25 km2 on average) on the grid cell’s TWS trend from 2003 to 2024, with barren land serving as the baseline. “Other natural vegetation” includes grasslands, savannas, and shrublands. Error bars show 95% confidence intervals. TWS = terrestrial water storage.
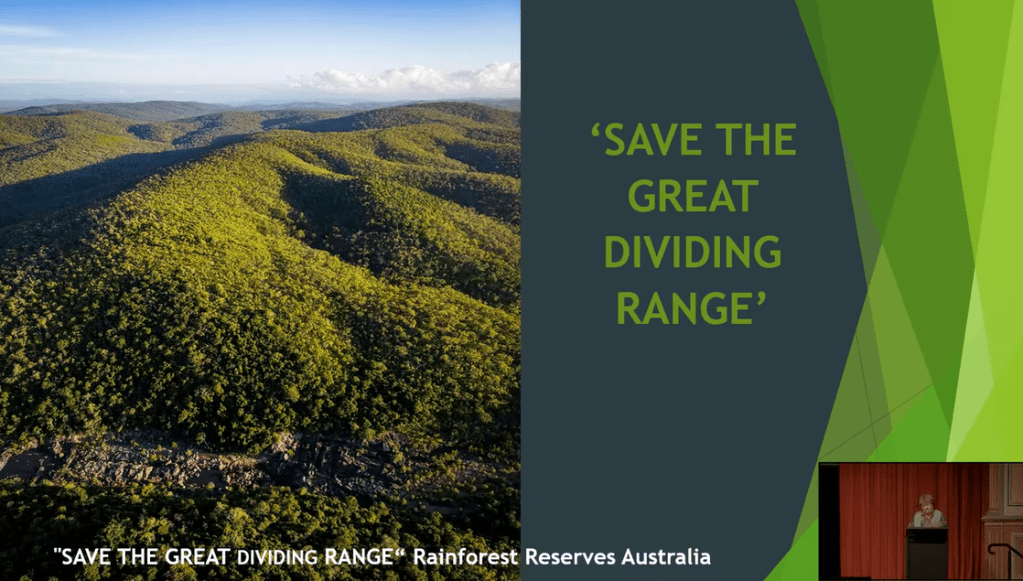
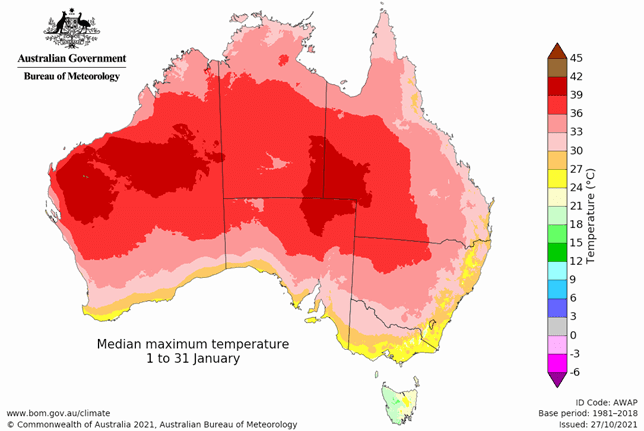
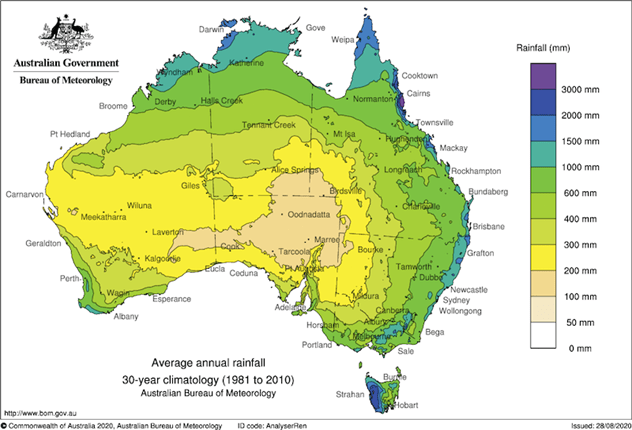
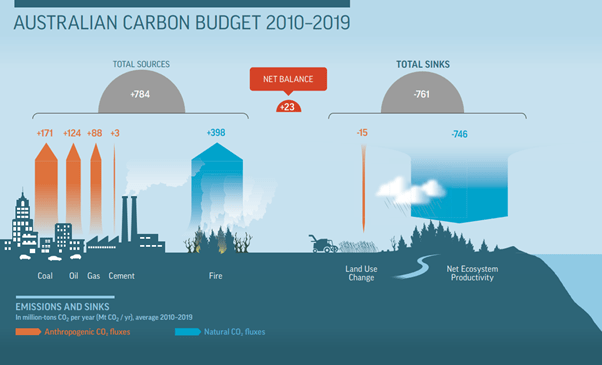
What About Australia?
We are already a dry land but so far, the Great Dividing Range has kept our main population centres watered and fed. However, our current obsession with removing forest, particularly on the mountain ridges, may become a step too far. This could result in a drier continent but when it rains flooding will increase. Our major cities are placed next the Pacific Ocean. As we build further and further west, the remaining patches of forest that attract rain inland may no longer so effective. This may result in rainfall reduction further inland as theorized by the Biotic Pump concept – perhaps a discussion for a future blog?
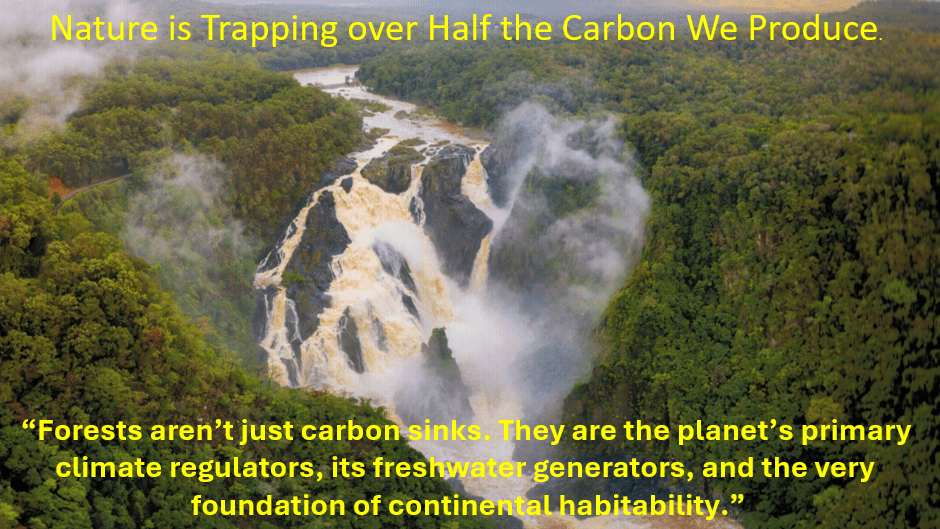
“Here is the uncomfortable truth: Even if we zeroed out carbon emissions tomorrow—a goal certainly worth pursuing—without massive ecological restoration the climate emergency would persist. Forests aren’t just carbon sinks. They are the planet’s primary climate regulators, its freshwater generators, and the very foundation of continental habitability.” Antonio Donato Nobre
We must not degrade native biodiverse forest in Australia for any reason no matter how persuasive the argument seems. We must do all we can to restore and preserve it!
This blog is an adaptation of a short talk I gave at the Cairns & Far North Environment Centre (CAFNEC) Round Table in November 2025.
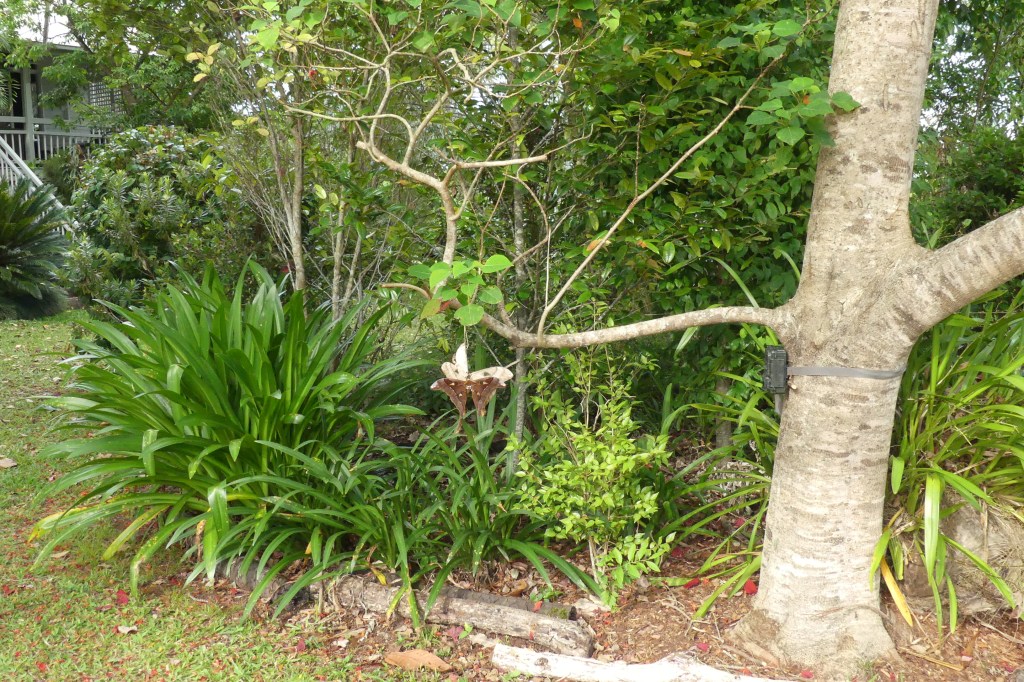
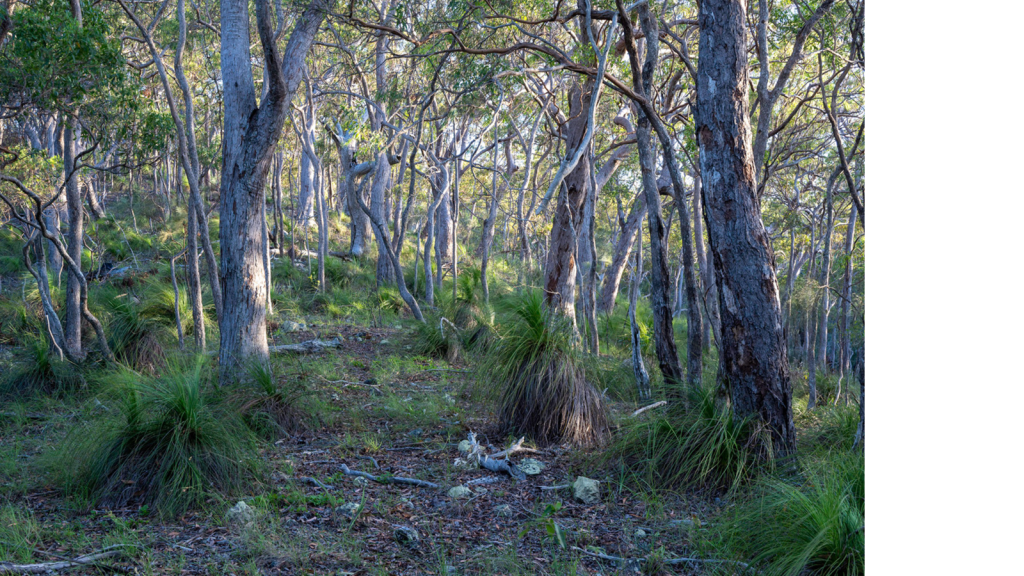
Picture by Stephen Nowakowski of the Barron River Falls and the surrounding forest.
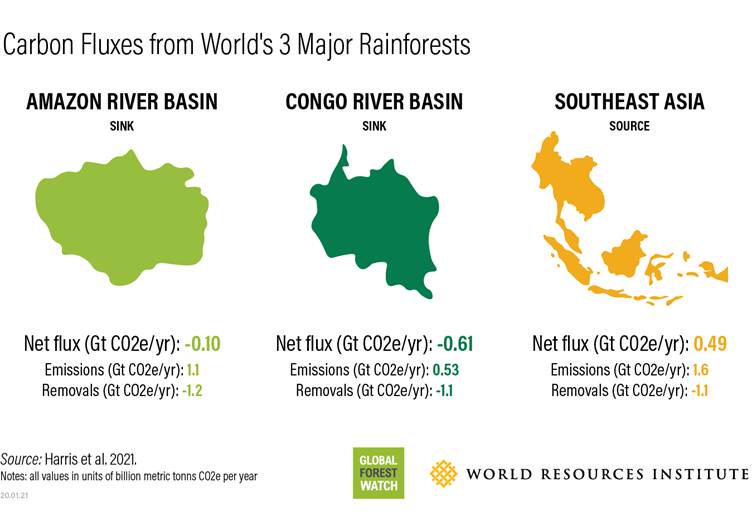
Forests do a lot of heavy lifting. But what is happening to tropical forests around the world?
Looking at the 3 most important tropical forests around the world, the Amazon Basin is now at a tipping point as a carbon sink. It is barely sequestering more carbon than it produces. The Congo River Basin is still functioning as a net sink despite high levels of clearing. Sadly, South East Asia is now a net carbon producer. A reminder that the carbon emissions from these areas would be much greater without the intact biodiverse forest that still remains.
What about Australia? Recent studies indicate that our tropical forests may reach a tipping point due to various types of disturbance and damage. Unfortunately, the land of south eastern Queensland has already become a net carbon source. Friedlingstein et al 2024; Global Carbon Project 2024
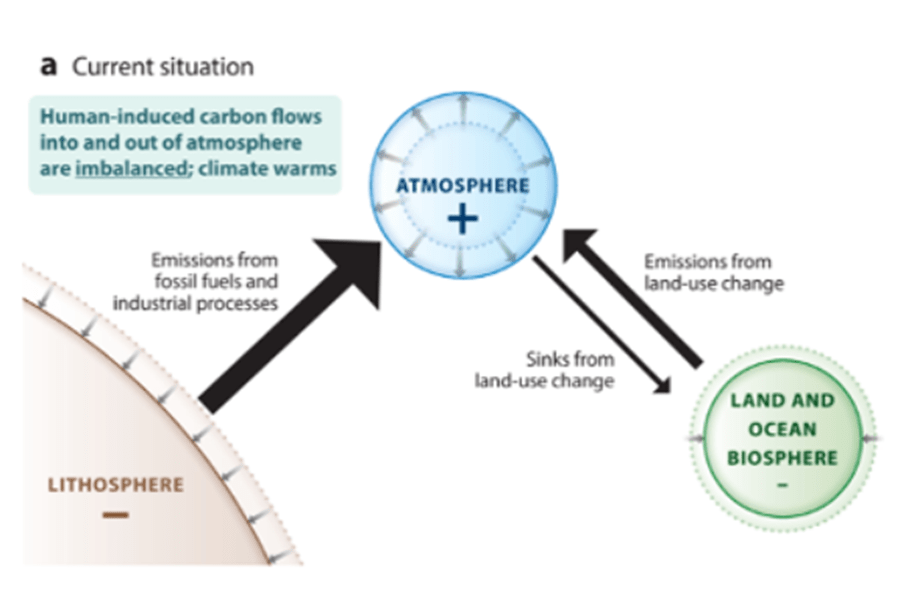
Net Zero Protocols and Targets
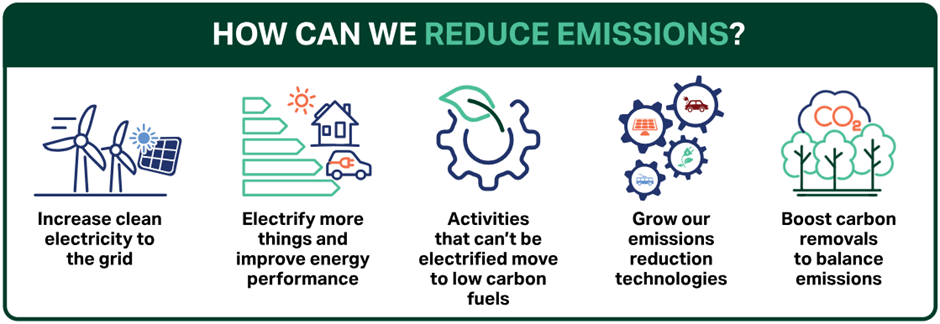
Australia, as did over 100 countries around the world, took on the protocols and targets set by the UN. Each country has been reporting its carbon emissions to the UN according to this plan. This year, only half of these same countries are going to COP30 with the same promises to meet Net Zero Targets. This UN approach to fighting climate change and adopted by Australia is summarized in the diagram below. It is copied from https://www.netzero.gov.au/net-zero. It is my emphasis that has been placed on the word we.
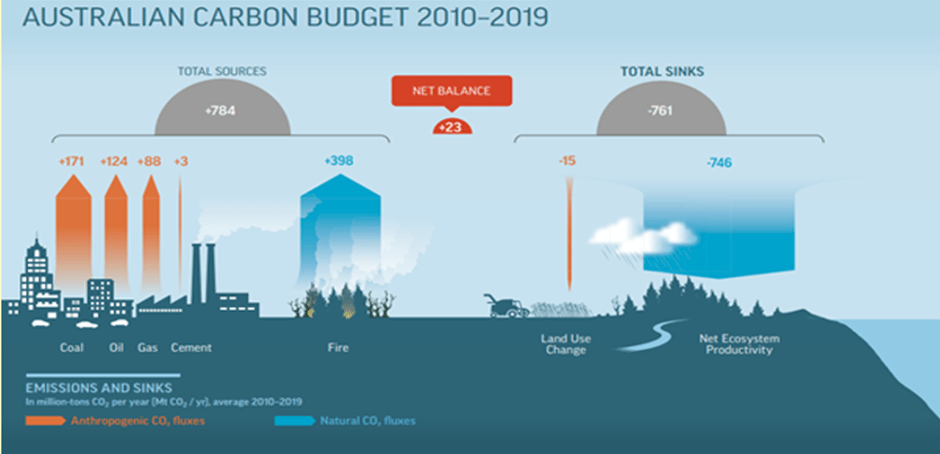
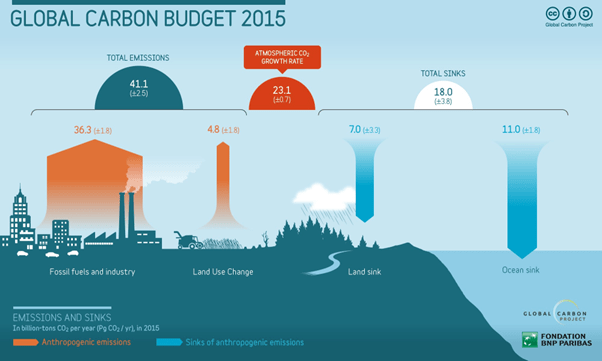
Just how effective is this anthropogenic approach? Well, the world adds a net 5.2 Gt of C to the atmosphere each year.
This diagram illustrates just what is being rewarded under the Net Zero protocol approach. Yet the land with its forests removes 3.2 GtC each year. Millions and millions of dollars have been pumped into the second two technologies for years now and maybe, just maybe, they may eventually have a real effect on carbon emissions. But, in the meantime, we destroy the very thing that it actually working hard for us.
Under the Net Zero protocols, biodiverse forest is not really counted or rewarded.
An example, after a bushfire, if the fire was not too hot, the forest will regenerate and even would benefit from a little help – no reward. But, if the area is cleared and a plantation is developed, the developer can get lots of saleable carbon credits. The former may continue to sequester carbon for little or no cost and keep doing so for thousands or even millions of years. The latter costs more money, sequesters carbon really well for a generation or so but may end up as a zero-sum game.
If good quality biodiverse forest is knocked down, the carbon accounting systems only records a small penalty for change of land use, but little or no accounting is made for the loss of sequestration that would have continued for hundreds of years.
Why are our Forested Areas becoming Net Carbon Sources Instead of Net Carbon Sinks?
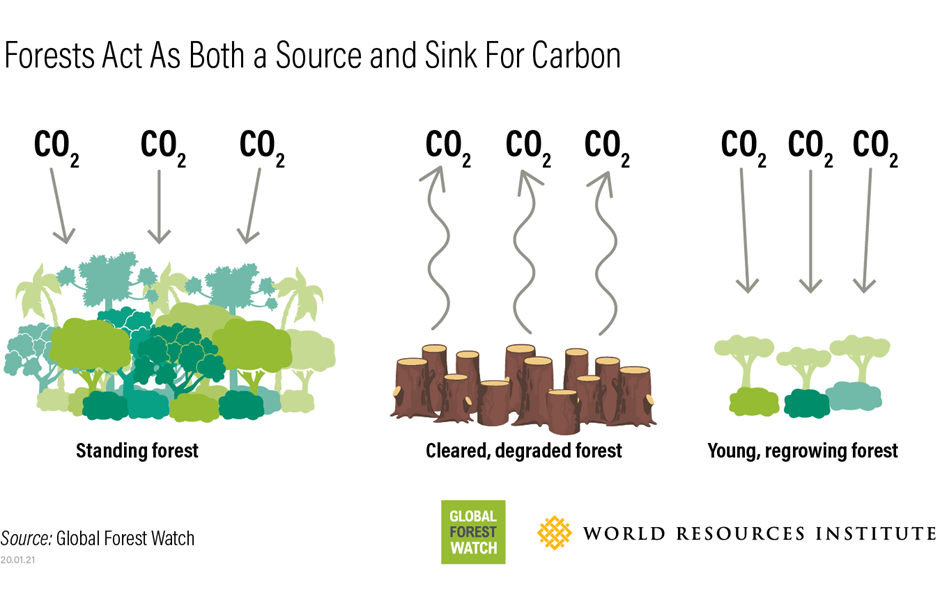
This classic diagram provides a hint.
A biodiverse forested area is a living ecosystem. When too much disturbance happens, the tipping point can occur well before 50% disturbance occurs. In Australia, wind turbines are being built by destroying mountain top forest. The impacted area is far greater than the area cleared. The clearing changes micro weather patterns. Uncovered soil is hotter and the surrounding soil and forest also dries. The mists that used to form on the mountain tops become less frequent and the vegetation changes, becomes more fire-prone, invasive species seize the opening, the biodiversity changes and bats no longer pollinate the trees and spread seeds.
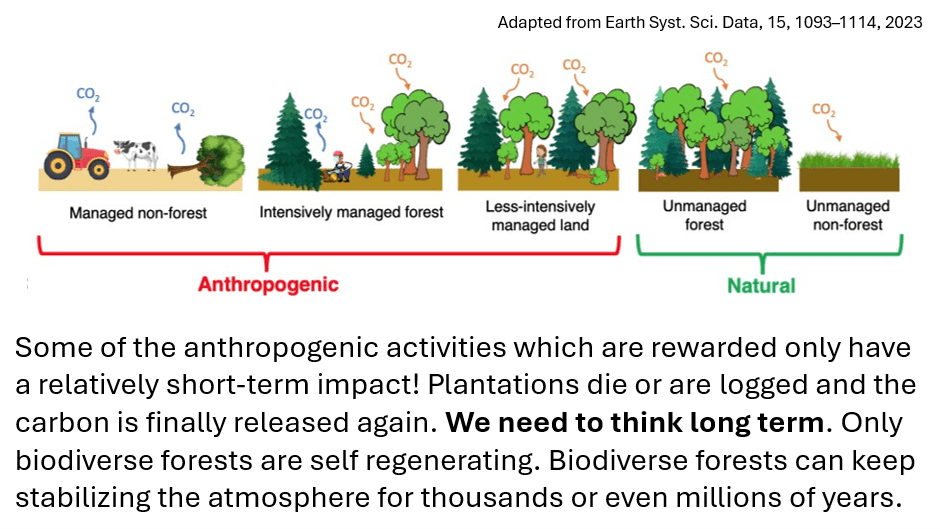
Basically, we are rewarding anthropogenic activities that only last for a generation or two. We must start thinking long term. The following diagram shows the sorts of activities that are rewarded. We ignore the “natural” and even give little weight to the less intensively managed forest.
Biodiverse Forests are More than Simply Carbon Sinks
I found some wonderful words by a retired Brazilian scientist who has summarised the issues so eloquently. I presented some of his words in my presentation in 2 slides as shown below.
Currently, our land with its forests and other vegetation removes a massive 30% of our carbon emissions every year. Unless natural carbon removal processes are maintained, we have no chance of ever restoring carbon dioxide levels in our atmosphere to tolerable levels.
The classic diagram below is misleading in that it is too simple. The “young growing forest” in the third panel is shown as sequestering more CO2 than the “standing forest” or natural forest. This is initially true but depending on its origin and future, the young growing forests can end up as a net carbon sources or at best carbon neutral.
There are two main groups of “young growing forests”: plantations and regrowth forest. If regrowth forest survives long enough and is ecologically diverse enough, it can take on the characteristics of older forests when it reaches an equilibrium between death and decay and natural tree replacement.
Old-Growth Forests Store Carbon Differently
When it comes to fighting climate change with forests, it’s easy to think all trees are equal. This thinking has led to simple approaches that focus on tree numbers rather than the complexity of the forest. However, science tells a different story: old-growth forests and tree plantations store carbon in distinct ways, and this matters significantly for climate action.
Old-growth forests are sophisticated carbon storage systems that have been built over hundreds or even thousands of years. There are trees of different ages, sizes, and species, creating a complex living structure. This diversity is crucial for storing carbon. Trees do die but they are replaced, and the system reaches a wonderful equilibrium which continually sequestered carbon. The massive tree trunks in old-growth forests represent centuries of carbon buildup. A single large tree can capture as much carbon in one year as an entire medium-sized tree contains in its whole body. In some forests, large trees make up just 6% of all trees but account for 33% of the forest’s yearly growth. This shows why size matters when it comes to carbon storage.
Most importantly, old-growth forests continue to store carbon in many different ways and places. Above ground, carbon is locked in living trees, dead standing trees, and fallen logs that take decades to break down. Below ground, massive root systems and centuries of built-up soil create huge underground carbon vaults. This multi-layered storage system provides both capacity and strength.
Many of Australia’s native forests are younger remnant forests but these forests are also living ecosystems and actually work nearly as hard for us, not just by sequestering carbon and preserving our biodiversity but by helping to cool our land through evapotranspiration and shading and forming a critical part of the water cycle. Forests can store a lot of water, helping to mitigate floods, seed clouds and clean water.
Do Plantations Mitigate Climate Change?
Plantations are typically planted with a single species all at the same time. Plantation forests can remove between 4.5 and 40.7 tons of CO2 per hectare per year during their first 20 years of growth. However, they all reach maturity together and die together, throwing all that carbon back into the atmosphere if they are not logged first. Depending on the use of those forestry products a little of the carbon may be stored for a few decades. Thus, plantations end up carbon neutral at best having achieved no long-term benefits.
Unfortunately, the carbon accounting and reward systems in Australia encourage the use of plantation type forests after bush fires rather than assisting the natural but slower reforestation processes. Some of these decisions are influenced by the severity of the fires. This again emphasises the importance of doing everything we can to fight all wildfires as quickly and efficiently as possible.
What Happens If Forests Stop Absorbing Carbon? Ask Finland
In a country of 5.6 million people with nearly 70% covered by forests and peatlands, many assumed the plan would not be a problem.
For decades, the country’s forests and peatlands had reliably removed more carbon from the atmosphere than they released. But from about 2010, the amount the land absorbed started to decline, slowly at first, then rapidly. By 2018, Finland’s land sink – the phrase scientists use to describe something that absorbs more carbon than it releases – had vanished.
Finland’s forests were mostly planted after WW2. In other words, they are mainly plantation forests. Commercial logging of forests – including rare primeval ecosystems formed since the last ice age – has increased from an already relentless pace, now making up the majority of emissions from Finland’s land sector.
Higher temperatures are causing the peat to break down and release CO2.
It has been suggested that by reducing the amount of logging and better management of their forests, the situation could be turned around. However, Finland’s Finance Ministry estimates that harvesting a third less would reduce GDP by 2.1%.
Finland is now forced to reduce its emissions by other means and won’t reach its Net Zero Target any time soon.
Are Australia’s Tropical Forests Becoming Net Carbon Sources?
An October 2025 paper published in Nature looking at Australian moist tropical forests used half a centuries’ data on above ground biomass as a measure of carbon sequestration. The above ground biomass was determined by measuring the girth and the height of every tree in each plot.
The study reported that a transition from carbon sink (0.62 ± 0.04 tonnes C /ha/ yr: 1971–2000) to carbon source (−0.93 ± 0.11 tonnes C /ha/ yr: 2010–2019) had occurred. https://doi.org/10.1038/s41586-025-09497-8
Standing carbon stored in the trees dropped almost 30% to about 200 tonnes of carbon/ha yet these Australian forests continue to be among the most carbon-dense terrestrial ecosystems on the planet as well as harbouring a very high proportion of Australia’s remaining biodiversity.
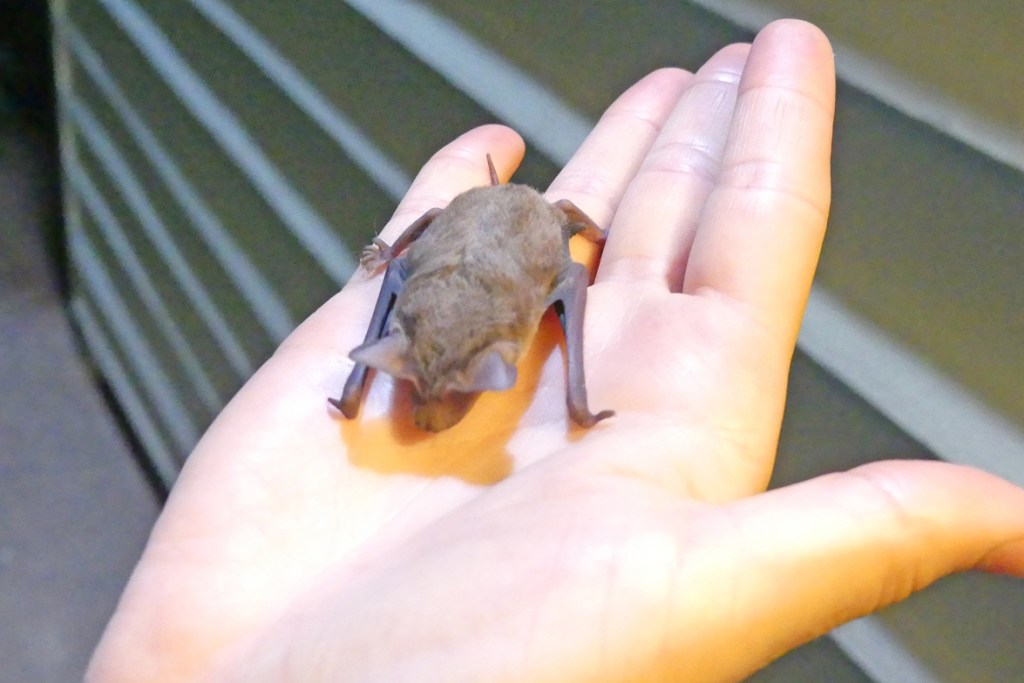
The trees are only living half as long. Death rates have doubled. Degradation has been caused by cyclones and high winds, invasive species, higher temperatures and loss of soil moisture. Canopy leaves die in hot dry weather. There has also been a change in fire regimes. Loss of pollinating species such as the spectacled flying fox means that there are less seeds to regenerate the forests. Clearing and fragmentation of the forest in earlier years left the forest more vulnerable.
Importantly, in this particular study other vegetation was excluded as was carbon stored below ground in the soil and plant roots. However, luckily this forest is still a net sink when biomass underground is considered. Could that change?
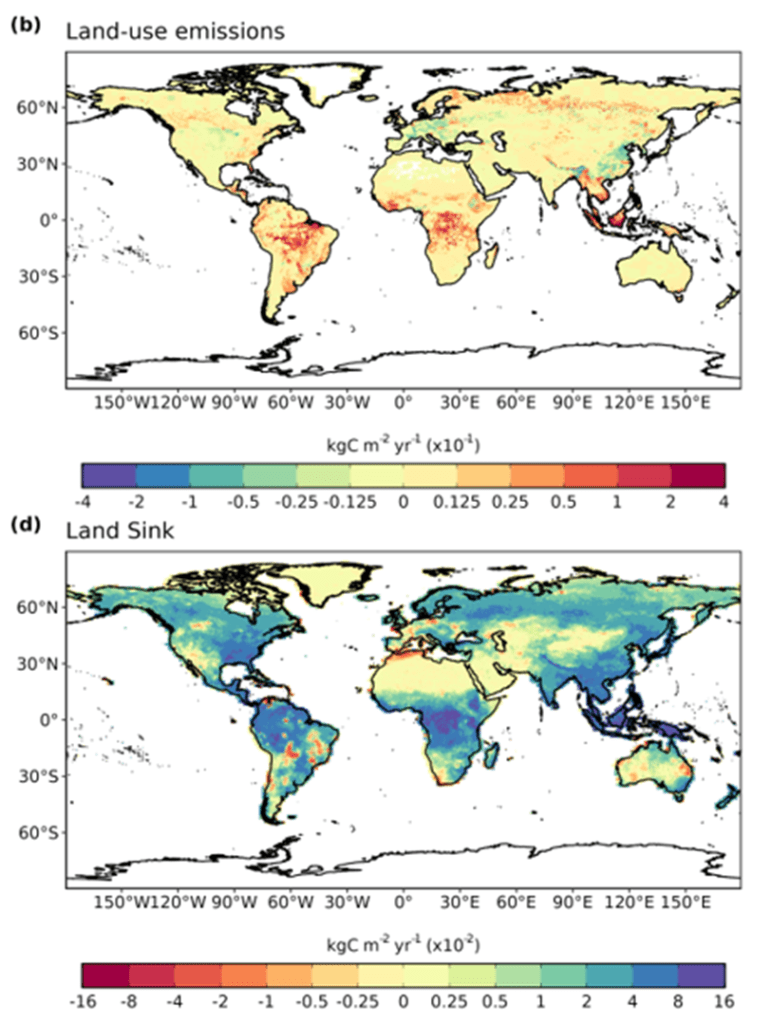
The World’s Land Sinks and Sources in 2024
Ref: Global Carbon Project Carbon Budget 2024 slides
Note that the land of southern Queensland, despite its remaining forest, is now a carbon source.
Many areas around the world are close to a tipping point.
The Amazon basin is showing many areas of stress, the most important natural forest areas of the world. The upper Amazon River and tributaries dried out for the first time in recent years.
A wrecked canoe lies in the dry bed of the Amazon River near San Augusto, Peru. IMAGE CREDIT: Plinio Pizango Hualinga/Rainforest Foundation US
How Much Degradation Can a Forest Take Before Becoming a Net Carbon Source?
An intact native forest will be a carbon sink.
A disturbed forest may be a carbon sink or a carbon source depending on the nature and amount of disturbance. A forest can become a net carbon source long before being totally degraded. For example, in 2025 the Amazon Basin has now been degraded to the extent that it has become a net source rather than a net sink.
A badly degraded forest is a carbon source.
As temperatures climb, and land dries out, is there a tipping point? Of course there is!
It is not necessary to clear large areas within a forest to start it along the path to its tipping point. Studies in the Amazon basin have shown that clearing a little land in the middle of forest can dry out the soil for up to 3 km away. This has an effect on the water cycle and over time the damage gradually extends further and further into the forest.
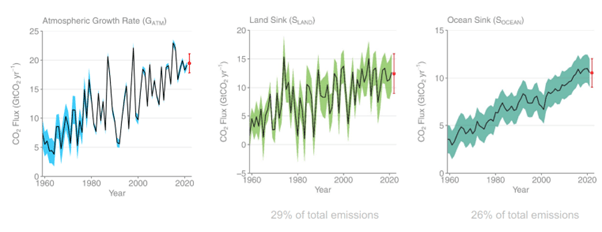
Despite man’s disruption of some of our most important forests and increasing CO2 levels, nature has continued to remove 30 % of the carbon emissions we produce. Signs of strain are now showing. The oceans are not taking up quite the same amount that they were. The major tropical forests have sink areas but increasing source areas and the balance between sink and source is changing.
However, these forests still store hundreds of billions of tonnes of carbon.
Unfortunately, the current Net Zero protocols reward the creation of plantation forests at the expense of ecologically diverse established native forests. There is little reward for maintaining and looking after real forests. It is seen as beneficial to degrade forest to build short term mitigation structures, not considering the long term effects. We are neglecting the natural world by concentrating too much on economic drivers. Even less-intensively managed land has been made a poorer cousin.
Adapted from Earth Syst. Sci. Data, 15, 1093–1114, 2023
What Will Happen to the World if Nature Stops Being a Net Carbon Sink?
We do need to cut emissions. It is not the basic concept of Net Zero that is the problem. It is how it is being implemented. We need a new way forward!
As temperatures climb, and land dries out, is there a tipping point? Of course there is!
Unfortunately, the current Net Zero protocols give the biggest rewards for the least effective behaviour.
How much more can we threaten our Australian forests before they crash and the eastern states become drier and drier and even hotter than necessary?
Please UN, COP and Australian Government find a way to reverse these trends. It is not too late!
This approach does not match the UN Net Zero approach as only direct anthropogenic activities to ease Climate Change can be counted.
Checking the Meaning of Net Zero
A deeper look at the wording of Net Zero statements puts little emphasis on Nature’s role in lowering GHG. For example, note the following Australian wording, with emphasis on “we”.
Net zero means balancing the amount of emissions WE produce with those WE remove from the atmosphere.
The UN says:
Put simply, net zero means cutting carbon emissions to a small amount of residual emissions that can be absorbed and durably stored by nature and other carbon dioxide removal measures, leaving zero in the atmosphere.
However, the UN reports use the following explanations:
Carbon dioxide removal (CDR): Refers to anthropogenic activities removing CO2 from the atmosphere and durably storing it in geological, terrestrial or ocean reservoirs, or in products. It includes existing and potential anthropogenic enhancement of biological or geochemical sinks and direct air capture and storage but EXCLUDES natural CO2 uptake NOT directly caused by HUMAN activities.
Land use, land-use change and forestry (LULUCF): A GHG inventory sector that covers emissions and removals of GHGs resulting from direct human-induced land use, land use change and forestry activities.
What is the Effect of Using this Anthropocentric Approach?
Only 3% of the world’s budget for climate change mitigation is spent on forest protection, even though vegetated land surface is removing 30% of the emissions we produce. As CO2 levels have risen, nature has kept taking CO2 out of the atmosphere, but the system is starting to show real strain for 2 reasons.
We have undervalued natural ecosystems already in existence by not giving their conservation and protection a strong enough voice and role in the definitions of Net Zero. Thus, it becomes OK to knock down parts of a forest to build wind turbines or palm plantations or build a 4- lane highway for COP 30. Net Zero accounting only measures the actual land area cleared but forgets the edge effects that can dry out forest and soil lessening the ability of far greater areas of forest to continue sequestering carbon. Disturbed forest is more susceptible to wildfire and damage from storms leading to yet further degradation.
As temperatures climb, the ability to photosynthesise can become weaker in a wide range of plants. Unfortunately, almost all tree species have a C3 type metabolism that is not well adapted to hotter and drier conditions. Australia is lucky to have many C4 plants such as saltbush, spinifex and indeed almost all of our Australian grasses. C4 crops include sugarcane, pearl millet, corn and sorghum. In some wetter years our savannah lands do a lot of sequestration. They need protection too.
C4 photosynthesis was an adaptation to less water and lower CO2. It is far more efficient in drought and high sunlight and dominates in tropical savanna areas. When grown in the same environment, at 30°C, C3 grasses evaporate approximately 833 molecules of water per CO2 molecule that is fixed, whereas C4 grasses lose only 277. This means that soil moisture is conserved, allowing them to grow for longer in arid environments.
It is possible that if we keep on our current pathway, Australia will turn our forests from net sinks for CO2 to net sources and then we could progress to losing them completely. What a tragedy that would be! Imagine losing our moist Eastern Australia lands. Forests are a very important part of the water cycle and do a massive job of cooling the Earth and keeping it from drying out. Forests bring rain. Loss of biodiversity within forests degrades and ultimately kills forests. They are complex ecosystems where every living thing plays a role. I will expand the topic of forests as net sinks or sources in a future blog.
Reaching net zero is impossible without nature. In the absence of proven technology that can remove atmospheric carbon on a large scale, the Earth’s vast forests, grasslands, peat bogs and oceans are the only option for absorbing human carbon pollution, which reached 37.4 bn tonnes in 2023. https://www.iea.org/reports/co2-emissions-in-2023/executive-summary)
So far Nature has been doing much more to lower CO2 levels than all our anthropogenic efforts.
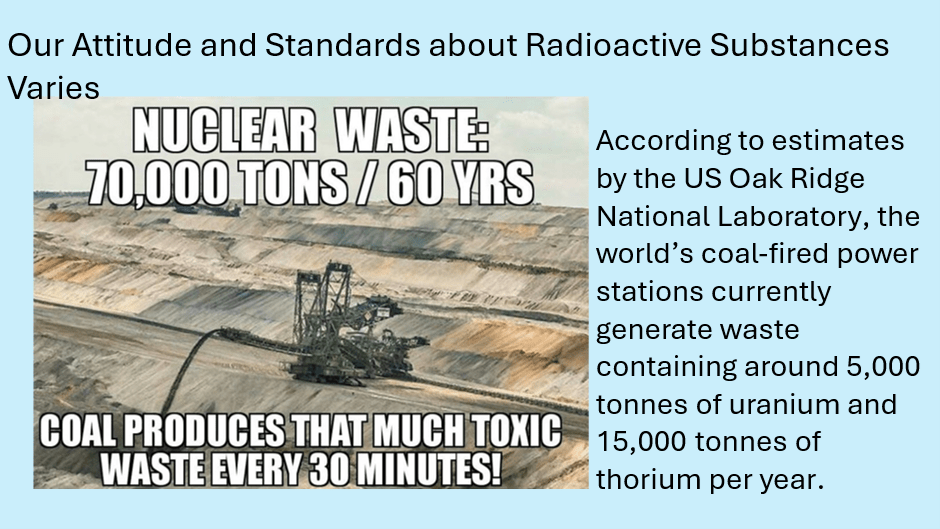
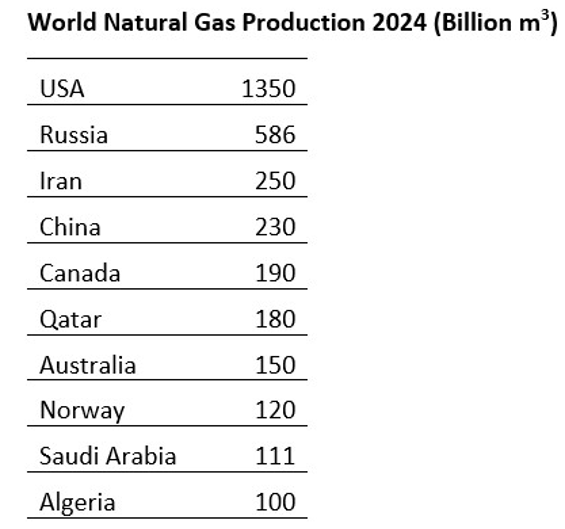
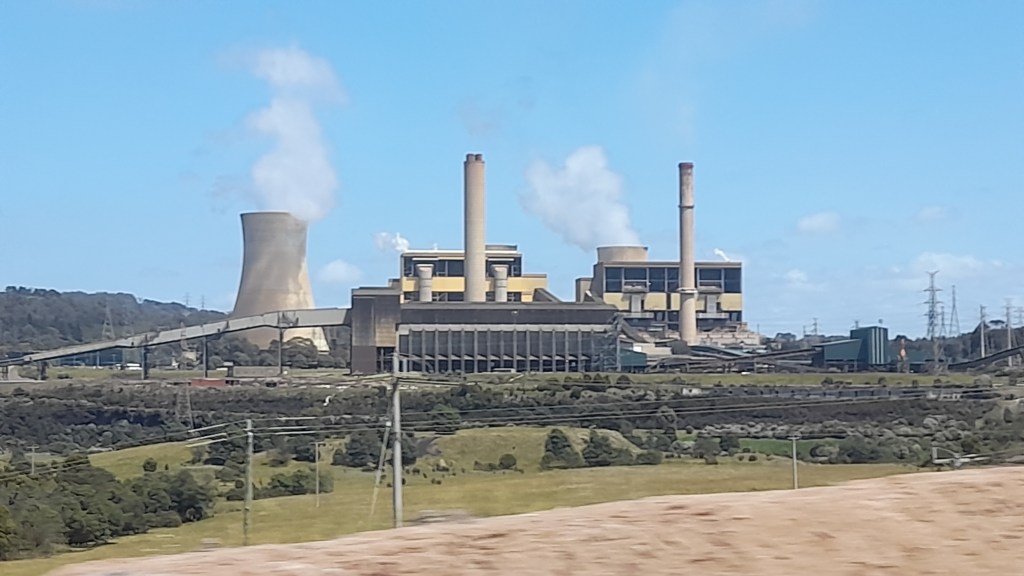
Why are we wasting money and other resources to build temporary structures by destroying the resource we already have that is busily working to moderate our climate ? How about we save our land from further degradation by using nuclear power in the longer term and gas now as part of a meticulously planned energy transition that includes carefully sited renewables?
The use of nuclear power and gas would help to preserve the land. Gas is a much lower carbon emitter than coal. By using more gas for industrial purposes for tasks that require high heat, a job that renewables cannot do, carbon emissions can be reduced without losing strategic industries we need to build our homes, produce food and export mining products. The Australian Government recognises a role for gas but seems to have done little to ensure a reasonably priced, adequate supply to industry. https://www.industry.gov.au/publications/industry-sector-plan/pathway-2050
Watch Mark Vassella, BlueScope Managing Director and CEO, address The National Press Club of Australia on “Australian gas prices are costing us our manufacturing, jobs, energy transition, and a future made in Australia.” https://youtu.be/HJoVbF1rtGI?si=LdTxvpatAGY-PDjO
We have already done so much damage, because Net Zero policies just don’t address the issues. Theoretically, Australia now has the Nature Repair Scheme which officially began with the Nature Repair Act 2023 which came into effect on December 15, 2023. Implementation finally started in 2025 with the first project improving land by replanting. The scheme is designed to” restore and protect” our natural environment, and participants can earn carbon credits. This scheme does not protect forests. It demands similar actions to Net Zero and still leaves our best remaining forests vulnerable. Our Environmental laws need strengthening not weakening to prevent building renewables in the wrong places and destroy the existing carbon sequestration capacity.
Next time – Are Our Forests Becoming Net Carbon Emitters or Sinks?
The Official statement by the Australian Government Net Zero Economy Authority means the same as the COP statements:
“Net zero means balancing the emissions we produce with those we remove from the atmosphere. It doesn’t mean eliminating all emissions, but making sure we don’t add more than we take away.”
Net Zero does not mean that all Green House Gas emissions are zero. Unfortunately, plans in Australia to reach Net Zero are very unbalanced and too simplistic. These plans put weight on emission reduction and sequestration technologies while neglecting the biosphere’s role.
We are lucky in Australia as our land and its biota, our biodiversity, is assisting us to sequester and store a lot of carbon in our forests and savannah lands, both above and below ground level. I will go into this issue and other related issues in greater detail in future blogs.
Meanwhile, we continue to remove trees from our forests, drying out the soil, reducing nature’s ability to help, throwing more carbon into the atmosphere. The new approach to environmental protection currently under Murray Watt encourages destruction of natural systems to build renewables. What a waste! This means all the money spent is not achieving as much as it could be. Let’s put solar on car parks instead of good agricultural land. Let’s build windfarms on brown field sites. Let’s preserve forests rather than find we need to rehabilitate and replace those same forests.
We only have finite resources, money, and materials. We must rigorously evaluate the true cost of various strategies and policies while looking at the whole picture not just isolated pieces of the transition challenge.
Have you ever wondered how green wind energy really is, especially when you see those vast piles of wind turbine blades dumped in landfills? Social media posts with photos of wind turbine blades in landfill have raised this question, casting doubts on the sustainability of wind power. Is it actually horrible for the environment?
The video below examines why recycling wind turbine blades is such a challenge, focusing on the materials and manufacturing methods involved. Then, then it scrutinizes the current recycling methods and discusses what needs to change for blades to be effectively recycled. It also evaluates the efforts of wind turbine manufacturers and composite material suppliers towards this goal. The video was made in Jan 2024.
My original training was in Chemistry but lacked the chemistry of plastics manufacture. As Rosie’s video explains, epoxy resins are thermoplastics which do not break down to their original starting materials. Epoxy resins are made from Bisphenol A but once they set, the Bisphenol A no longer exists. The process can’t reverse.
Wind turbines are an important part of our energy systems but their siting needs careful planning. In Australia they should not be placed in areas of high biodiversity.
Australia’s Current Energy Policy a ‘Dangerous Experiment’ – Risks Trillions in Costs and Irreparable Damage
MEDIA RELEASEFOR IMMEDIATE RELEASE – 30 April 2025
Australia’s energy future is in jeopardy, according to a major open letter signed today by over 50 of the nation’s leading scientists, engineers, economists, conservationists, business leaders, union leaders, and energy experts.
The signatories warn that Australia’s current energy policies are ideologically driven and risk becoming a multi-trillion-dollar, irreversible economic and environmental disaster.
Key Points from the Open Letter:
• Australia’s energy transition is proceeding without sufficient scientific rigour, transparency, or cost accountability.
• Full renewable transition costs are projected between $7 trillion and $9 trillion — equivalent to up to $850,000 per Australian household.
• Renewable-only plans pose a severe threat to grid stability, affordability, and national energy sovereignty.
• Nuclear energy is being misrepresented and prematurely dismissed; reliable, zero-emission nuclear power could be delivered for around $120 billion — a fraction of the renewables rollout cost.
• Billions in taxpayer subsidies are flowing offshore to foreign-controlled renewable companies, with limited transparency or return for Australian taxpayers.
• Environmental damage from large-scale wind and solar developments is being overlooked by major energy councils and environmental non for profits.
Major Signatories Include:
• Dick Smith, Australian Inventor, Entrepreneur, and Australian of the Year
• Dr Adi Paterson, Former CEO of ANSTO (Australian Nuclear Science and Technology Organisation)
• Steven Nowakowski, Conservationist
• Aidan Morrison, Energy Systems Expert
• David Scroggie, Business Leader
• Jennie George AO, Former President of the ACTU
Usable Quotes:
Dick Smith:
“Without nuclear energy, Australia faces economic catastrophe. Renewables alone cannot provide the reliable, continuous power we need. We are being led into a trillion-dollar disaster by ideology, not science.”
Dr Adi Paterson:
“Australia has the engineering expertise, natural resources, and capacity to deliver a balanced and responsible energy system which includes nuclear in a reasonable amount of time. Global evidence from democratic nations is clear: the most reliable, lowest-emission, and most affordable electricity systems always include nuclear.”
Steven Nowakowski:
“Environmental groups today oppose everything except industrial-scale renewables, even when it destroys the nature they claim to protect. It’s time to return to true conservation principles and achievable solutions.”
Aidan Morrison:
“The current energy plan and renewable energy targets haven’t been determined by science or expert analysis… it’s been determined politicians, and re-branded by institutions such as AEMO to make it appear as though it’s from the experts. The current plan will be unreliable, and economically and environmentally disastrous.”
The wind turbine projects being built on the tops of the Great Dividing Range have very little sediment control. Some of the roads are very steep. I wonder how much sediment is washing into the little streams that host endangered species like the Magnificent Broodfrog. How far does the fine sediment flow? Many of these projects lie in the Great Barrier Reef catchment. Farmers must meet tougher and tougher standards regarding their properties.
For years I worked on huge infrastructure projects in Asia. Sediment control was carefully planned and monitored.
A neighbour has recently had his driveway engineered. After a relatively light rain event up here in northern Queensland, I noted that fine sediment from his driveway washed down the drains and disappeared. Sand carried for tens of metres down the roadside gutters while gravel pieces moved several metres. Here are a few photos. Note the silt still remaining on the road itself. The driveway gently slopes down to the old road-side gutters with a narrow concreted steeper area just before the gutters.
Up here, we can experience rain intensities that wash roads away and roadside slopes collapse. How much sediment will move into streams into our heritage areas from the wind turbine projects? Who is monitoring it? No-one has an obligation to report it. Thousands of kilometres of roads are being built. What is the cumulative impact?
I fight to have wind turbines built where they do not damage the Australian Environment.
What are the effects of infrasound on our wild birds?
We have no idea. It has been known for many years that other forms of noise can impact the fitness and survival of birds.
Eggs and nesting baby birds exposed to moderate levels of anthropogenic traffic noise experience large, direct, and additive adverse effects on long-term development and fitness, according to a new study. The findings underscore the disruptive properties of noise on physiology, development, and reproduction, leading to lifelong fitness reduction. American Association for the Advancement of Science (AAAS) Science DOI 10.1126/science.ade5868 .
New wind turbines in Sweden may be responsible for the death of chickens while still in their eggs.
A Case Study
The Schwere family in Ljungbyholm, Sweden maintains a hobby flock with five different breeds. The normal hatch rate from 2009 to 2020 wasat least 95% successful hatches after 21 days of incubation. In 2021, a new wind power industry with 12 turbines of 4.5 MW each began operating about 1000 m from the farm centre. During the years 2021-2023, the hens stopped incubating after 16 days, leaving all the eggs dead. Even the few hens that went into the forest returned alone instead of returning with chicks as in previous years. The family’s adult son lives 3 km from the new wind industry also keeps free range chickens. From 2009 to 2023, the hatching success rate has been at least 90%. In 2022, the son moved three of these hens and a rooster to his parents’ chicken yard, 950 meters from the nearest wind turbine. These hens also stopped incubating after 16 days, leaving dead eggs.
Egg Mortality in the Coop During the Period May 1-21, 2023
Note: +1 indicates hatched malformed and died.
(Ref: Why Does Egg Mortality Increase Near a New Wind Industry? Published in “Svensk Veterinärtidning” No 5 June 2024 Vol. 75)
Turbines are getting bigger and produce more low frequency sound and infrasound
Infrasound is sound with a frequency below 20 Hz. It is normally not perceptible to the ear, but it can affect animals and humans (negatively) if the levels are sufficiently high. What makes infrasound special is that it travels very far, as it is barely attenuated by the atmosphere, ground, or walls. It can pass straight through walls without significant attenuation. Sounds with higher frequencies are attenuated by the atmosphere and bounce off walls. Even though we may not hear it, physiological responses have been measurabled.
Health risks with Infrasound – Research from Sweden
“The fact that most people don’t hear it doesn’t mean it’s harmless. It is a common misconception that you have to hear a sound in order for it to affect the body. There is research showing that infrasound affects the brain and the autonomic nervous system even at levels well below the limits used today. The problem is that we have an old view of noise, focusing only on what is audible. But the research has shown that even inaudible sound can have physiological effects. Infrasound can create stress reactions in the body, affect sleep and trigger migraines, and this is an area that should have been researched much more than it has been done.”
Several studies suggest that infrasound can cause a range of negative health effects such as insomnia, migraines and high blood pressure.
“Approximately 30% of the population has an increased sensitivity to infrasound, and these people can be hit hard. I myself have experienced the effects. After measuring at wind farms, I can’t sleep for several nights and get heavy migraines. It is the same symptoms that many residents close to wind turbines describe. We’ve been out talking to people who live close to these works, and we hear the same stories over and over again – people get headaches, they feel a pressure in their heads, some get palpitations and others can’t sleep. And this is the big problem: there’s no escaping from the infrasound, it goes straight through walls and windows, and no authority has taken this seriously.”
How far does the infrasound spread from the wind turbines?
One of the most worrying aspects of infrasound is its long range. Unlike audible sound, infrasound is not dampened in the same way by the atmosphere but can travel very long distances without reducing in intensity. depending on the conditions, it is possible for the infrasound to be louder at 150 km from the source than it is at distances of 20 to 100 km from the source. This is very different from audible sound, which gets attenuated proportionately with the square of the distance from the source. https://www.sciencedirect.com/science/article/pii/S2210670722006126#:~:text=2022)%20report%20power%20spectral%20density,shifts%20the%20frequencies%20slightly%20higher.
The Attenuation of Infrasound with Distance
Infrasound levels can be significantly higher from downwind turbines compared to upwind turbines.
Queensland is building wind turbines on the tops of the Great Dividing Range
How far will their effect travel? A few small turbines might be OK.
But the plans are for thousands to be built. We already know that some of our precious wildlife such as koalas and cassowaries communicate using infrasound. Their behaviour will be strongly affected and their ability to breed. Do we really know what will happen to humans?
Should we trust recent claims that low-dose radiation causes cancers? What is the truth? Do we really know?
Anti-nuclear groups in Australia have been given a new weapon for their arsenal of outdated fear campaigns. Recently published epidemiological studies linking cancers and heart disease to nuclear industry workers are being spread as established fact by Margaret Beavis, Climate Council, ACF and FOE and even the Labour Party.
So much damage has been done by those who instil fear of ionising radiation in others. The “holier than thou” attitudes developed during the cold war are now very outdated. There are well-meaning groups of scientists, particularly epidemiologists, environmentalists and regulators who find it in their best interest to hang on to outdated information. Paradigms about radiation that began in the 50s and 60s have not changed despite all we have learnt about biological repair mechanisms and low dose radiation. It is a bit like comparing the safety of a modern aeroplane with the Hindenburg hydrogen airship. Why does this happen?
What is a Paradigm?
A paradigm is an interlocking set of assumptions about the operation of a complex system. It is a model of how the system works. Once accepted by the scientific community, a paradigm tends to channel attention and research funding into “acceptable” directions. Observations that fail to fit the paradigm may be ignored or suppressed. This is not a conspiracy but, instead, a reflection of human nature. When we believe something to be true, we discount alternative statements that contradict the “truth” as we perceive it. In general, a paradigm must be conclusively disproved before a new paradigm can be accepted.
It can really hurt to find out your beliefs of decades are not true.
Even twenty years ago, there were over 3,000 scientific papers published in reputable journals concluding that low dose irradiation is stimulatory and/or beneficial in a wide variety of microbes, plants, invertebrates, and vertebrates. Using the parameters of cancer mortality rates or mean lifespan in humans, no scientifically acceptable study was found which showed that less than 100mSv was harmful. https://pmc.ncbi.nlm.nih.gov/articles/PMC2477686/
A reward was even offered for any one report in English with scientifically acceptable evidence of harm (increased cancer death rate or decreased average lifespan) from low dose irradiation in normal (not immune deficient) humans or laboratory animals. The reward was not claimed.
In this blog, radiation levels greater than 100 mSv are not considered to be low dose. In some medical literature the term low dose is used for much higher levels of radiation. High doses of radiation have very different effects on living entities and can harm and kill. Repair mechanisms are overwhelmed.
Epidemiological Studies
In a classic science experiment, only one variable is changed at a time. All other factors remain the same. BUT this is only possible when working with simple systems such as in some basic physics or chemistry experiments. The real world is very complex, and biological systems are extremely complex. It becomes impossible to control all influencing factors – “confounding factors”. When confounding factors have more influence on the result then the variable under consideration, scientific evaluation becomes extremely difficult. This is the reason why it took so long to prove that smoking could cause lung cancer. The more complex the system studied, the more complex the mathematical statistics used becomes.
There are many types of epidemiological studies. When there is no control population used, and the data is simply observational and collected after the effects, a retrospective cohort study is the only choice. Cohort studies can never prove causation. They can only suggest a hypothesis for more detailed study. If data are collected after the fact, a cohort study becomes even more unreliable. When a medical effect is very rare, very large numbers of people are required for the study and statements of relative risk become almost meaningless. Attempts to discount confounding factors may be made. It is simply impossible to deal with all confounding factors.
To try and obtain a result, many mathematical manipulations are undertaken on the data. In studies about radiation, different groups sometimes publish completely opposite results because the mathematical formulae used on same data set are different.
For over 70 years, radiation epidemiologists have fallen into 2 camps. Those that fully support the Low No Threshold (LNT) Hypothesis to explain radiation health effects and those that spurn its use or simply accept the status quo for now for regularity purposes.
The LNT Hypothesis
The LNT Model was formulated on data from the 2 atomic bombs dropped on Japan at the end of WW2. It is based on the following assumptions:
Radiation exposure is harmful.
Radiation exposure is harmful at all exposure levels.
Each increment of exposure adds to the overall risk.
The rate of accumulation of radiation exposure has no bearing on risk.
No Hormetic Effect:
The model does not consider the possibility of any beneficial effects (hormesis) or stimulatory effects from low doses of radiation. It assumes that any increase in radiation exposure, however small, is detrimental.
It Doesn’t Recognise Biological Repair Mechanisms:
Our knowledge of the biochemistry of molecule, cell and tissue damage and repair mechanisms has grown enormously since the 1950s.
Dr. Antone L Brooks, the Chief Scientist for the US Dept. of Energy’s Low Dose Radiation Research Program from 1998 to 2008 continues to publicize in his quiet manner that we knew better well over a generation ago that the assumptions of the LNT Model are not correct. He has stated many times that despite its simplicity when used for regulatory purposes, the LNT model overestimates the effect of radiation on living things and should not be used to estimate health effects. Many other voices say the same.
The LNT is used by many countries for regulatory practices. It is extremely conservative and hence standards for radiation protection are probably overly protective. For example, the US NRC and US EPA endorse the model, while other professional bodies such as the Health Physics Society and the French Academies of Science and Medicine deprecates it.
Unfortunately, this approach has led to unreasonable fear of radiation and excessive time and money costs. The LNT model works for high dose single exposures.
One of the organizations for establishing recommendations on radiation protection guidelines internationally, the United Nations Scientific Committee on the Effects of Atomic Radiation (UNSCEAR) that previously supported the LNT model, no longer supports the model for very low radiation doses.
The Australian Radiation Safety and Advisory Council in their Position Statement to ARPANSA on the use of the LNT model in ionising radiation protection states that:
“The appropriate use of the LNT model has enabled effective radiation protection systems. However, the inappropriate use of the LNT model has inadvertently increased community fear of ionising radiation. The Council advises that extremely low doses of ionising radiation may be associated with no or an extremely low risk of harm.
Incorrect emphasis on potential risks associated with low radiation doses and dose rates can have negative impacts as it can prevent health, medical, environmental, social and economic benefits being realised. In adopting the LNT model it remains essential to balance the low risks of low-dose ionising radiation exposure against the benefits of the radiation. https://www.arpansa.gov.au/sites/default/files/rhsac_-_position_statement_on_the_use_of_the_lnt_1_may_2017
Cellular Repair Mechanisms
When it comes to cancer, the main concern is DNA damage. Living tissue is made up of cells. Cells are mostly water. If a radioactive particle enters a cell, it transfers a portion of its energy to the cell mainly by breaking the chemical bonds that hold the water molecule together. This creates highly reactive, free radicals which can disrupt the cell’s chemistry including damaging the cell’s DNA. But do you realise that almost all free radicals are created by our use of oxygen to turn our food into energy?
Most of the DNA damage is single strand breaks, in which only one side of the double helix is disrupted. Single strand breaks are astonishingly frequent, >10,000 per cell per day. Almost all these breaks are caused by free radicals produced by the cell’s own metabolism. These are repaired almost automatically by the clever structure of the DNA molecule itself, with the undamaged side serving as a template.
But occasionally we get a double strand break (DSB). It’s the DSB’s that can start the process that may result in cancer. Cell metabolism generates a DSB about once every 10 days per cell. Average natural background radiation creates a DSB about every 10,000 days per cell.
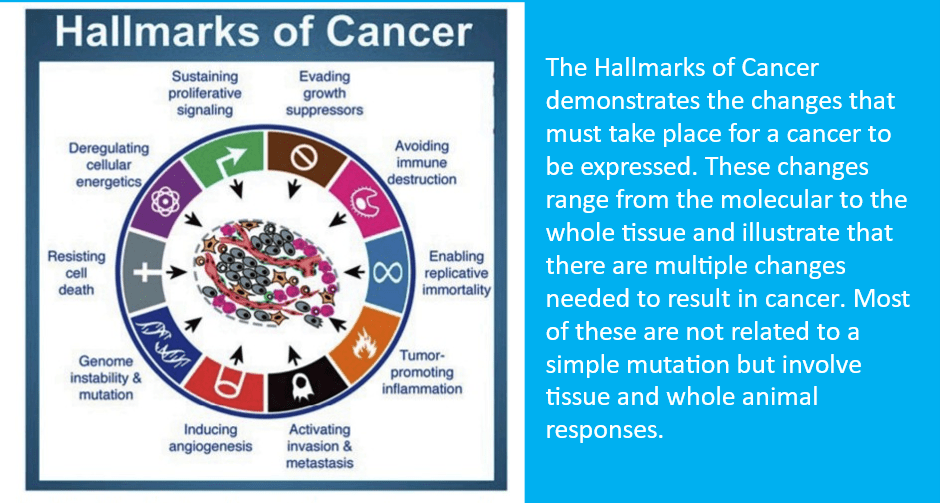
The Cellular Changes Needed to Initiate Cancer Have Not Been Observed at Low Dose Rates
At least 6 to 8 of specific cellular changes must occur for cancer to result. The “Hit Theory” of DNA mutation as a cause of cancer is way out of date.
These changes are only seen at single high doses of radiation.
Some of these hallmark changes include avoidance of immune destruction, deregulation of cellular energetics and resisting cell death. A simple diagram of the hallmarks of cancer is shown below. Knowledge of cancer mechanisms has progressed enormously since this diagram was first formulated.
The International Nuclear Workers Study (INWORKS) is a large series of international epidemiological papers on workers in the nuclear sector. It was launched in 2011 and coordinated by the International Agency for Research on Cancer (IARC). The study combines data from nuclear workers in the UK, US and France for pooled analysis. It seeks to gain greater knowledge relating to the risks of cancer and non-cancerous diseases linked to chronic exposure to low doses of ionising radiation at low dose rates.
INWORKS followed on from 15 Country Study published in 2007 https://pubmed.ncbi.nlm.nih.gov/17388693/ (Among 31 specific types of malignancies studied, it was concluded that a significant association was found for lung cancer and a borderline significant association for multiple myeloma with a strong healthy worker survivor effect in these cohorts.
The healthy worker survivor effect has been assumed repeatedly whenever an analysis has shown that the cohort studied indicated less risk to nuclear workers. Slight variations in the cohorts are analysed by different techniques or parts of the cohort left out of the calculations or different methods are used to define the radiation levels experienced by workers. Many confounding factors were not considered. One of the most important of these is the lack of consideration of different background levels of radiation. Nor were there records of medical exposure such as CT scans or cancer treatment.
Most of the graphs shown have huge error bars yet excess relative risk is quoted with up to four significant figures. The slope of the LNT model is even used in some calculations. Many of the dozens of papers published are in the form of minimum publishable units, which makes it hard to fully understand exactly how some of the final analyses were undertaken and the conclusions reached. The INWORKS consortium has recently stated that they will not release their basic data so others can analyse it independently, claiming confidentiality problems. One of the basic tenets of the scientific method is reproducibility by others.
It is the results on these studies that are being published ignoring the rest of the literature, particularly detailed criticisms of the work. The quoted error ranges are huge. Some of the graphs could even be used to suggest that low- dose radiation lowers the workers chance of cancer – a hormesis effect. For a more detailed critique of some of the studies see https://pmc.ncbi.nlm.nih.gov/articles/PMC5974569/pdf/10.1177_1559325818778702.pdf
Government websites simply republish the “results” without interpretation or perspective. Usually, the way the results in the papers are given would be meaningless to most readers. However, I did read in one abstract today that the radiation attributable absolute risk of leukaemia mortality in this population is low (one excess death in 10 000 workers over a 35-year period)https://pmc.ncbi.nlm.nih.gov/articles/PMC11626443/
So, should we trust recent claims that low-dose radiation causes cancers and other health issues? What is the truth? Do we really know?
Some epidemiologists have been trying to prove that low-dose radiation is harmful and that the damage does accumulate for decades, and they are still trying. It is certainly possible that a few people may be affected in some way, but the risk is so small, one must ask why not concentrate on protecting people in other industries where carcinogenic substances are far more common.
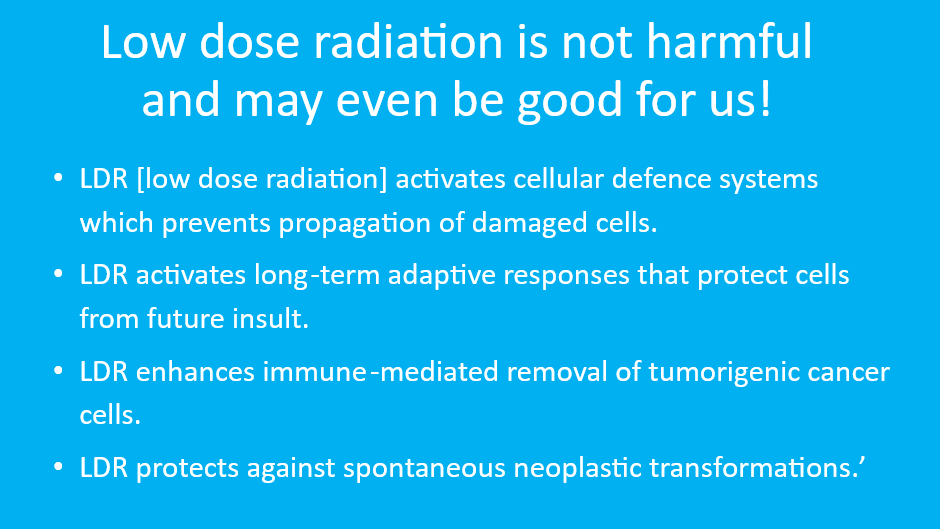
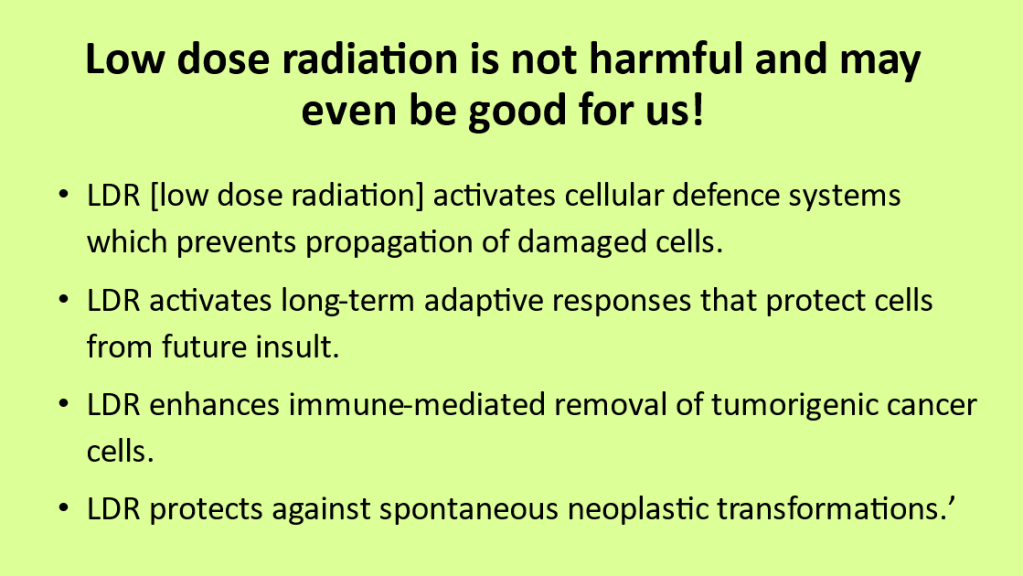
We do know that most cellular responses to low-dose radiation are protective and positive. There are a couple of changes that may be positive or negative depending on the state of a cell. Nothing in life is perfect but the more biochemistry we learn, the more impressive is the chemistry of life. It seems likely, based on recent research work that cells may even need some low-dose radiation to thrive. After all we did evolve with ionising radiation.
Is it time that we found a “healthy” middle ground?
Can you help or know anybody who can help me? Please save me and all the other koalas. Here are some actions that you may be able to do.
The following is a copy of a letter from Steven Nowakowski
Dear all,
This is a call to action to STOP THE DESTRUCTION OF THE CONNORS RANGE.
It’s disheartening to see conservation groups straying from their founding mission and neglecting the critical conservation values of our environment. Many seem unable to recognise the importance of maintaining our natural ecosystems and the vital role they play in climate action.
Additionally, we see environmental groups prioritise industrial interests over environmental protection.
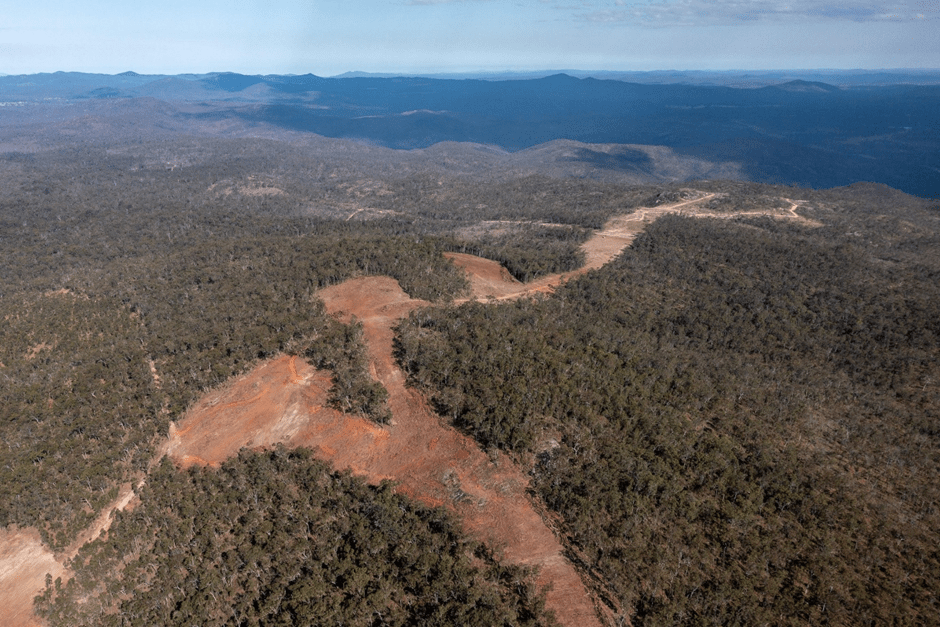
Here is our latest film of Lotus Creek Destruction, a 48,000ha high altitude climate refugia for vulnerable and endangered wildlife being sacrificed in the name of green energy:
This project has just commenced and will consist of 46 x wind towers and will provide 0.47% of electricity generation for Queensland (based on 30% capacity factor when the wind blows). The images here show clearing for the first 4 wind towers.
The project is situated on the magnificent Connors Range at 550m elevation directly west of the coastal community of St. Lawrence. The Connors Ranges are high elevation intact refugia forests containing some of the best koala and Greater Glider populations left in Queensland. This will adjoin the nearby Clarke Creek Wind Farm which stretches the full length of the Nebo-Connors Range with an additional 2,000ha being cleared there now.
101 koalas and 138 Greater Gliders were found in project area. The koalas on the Connors Range were recently listed as having the best genetic diversity of koalas in Australia.
957 Cycas terryana to be cleared (Cycad species only described in 2011 and only found at three locations along the Connors and Broadsound Ranges).
48 Sannantha brachypoda to be cleared.
No sediment or erosion controls along ridge lines with boulders pushed over edges. No idea what impact will be on amphibians? Also, no idea what impact low frequency sound will play in masking mating calls of mammals such as koalas and amphibians? Early science is showing koalas being pushed away from low frequency sound.
The offsets are a scam. Two parcels of land either side of the haulage roads are the offsets.
This should be Queensland’s great Koala National Park. Instead, its being turned into an industrial energy production wasteland.
Now is the time for action. We must call on the Crisafulli Government to halt this project and protect these critical areas. We cannot afford to sacrifice our high-altitude intact refugia forests on the Great Eastern Ranges. The Miles Government bought this project off Copenhagen Infrastructure Partners in its dying days in office for a staggering $1.3 billion!
Please share this message widely and urge others to take action.
HANDS OFF OUR REFUGIA FORESTS NOW!
Send an urgent email to the following addresses, demanding a stop to this project:
Moreover, the State Government has indicated that they are currently investigating breaches and non-compliance issues at the Lotus Creek site. This necessitates an urgent stop-work order and a cease-and-desist action. Please write to the relevant department to cease destruction of this vital climate refugia for koalas, greater gliders, birdlife, bats, and countless wild animals and plants.
For follow-up, here are contact details for the State Assessment and Referral Agency (SARA):
Steven Connor, Senior Planning: 0401 995 573
Geoff Broadbent, Senior Officer: 07 4616 7302
Kind regards,
Steven Nowakowski
Vice President Rainforest Reserves Australia
The bulldozers have been running for a while now.
As Australians we said we would protect
Labour promised to upgrade the EBPC Act. Instead they are turning this
into this: (photos by Steven Nowakowski)
A letter has been sent to the Minister listing all the breaches of the approval conditions for the project and of the EBPC Act itself. If you wish to receive information about the plight of the animals on the site and a pdf copy of the long letter sent to the minister, contact me on pameliza.jones@ gmail.com
Animals are being slaughtered! If you care, are you able to assist by direct action? Our Northern Koalas have the genetic diversity that may help them survive the future. Most Southern Koalas don’t. Save Refugia areas! When we lose our special mammals, they are lost forever!
‘Science nerd’ who ordered radioactive materials to his parents’ Sydney home spared conviction.
A “science nerd” who ordered uranium and plutonium to his parents’ apartment has escaped conviction and been given a two-year good behaviour bond.
Emmanuel Lidden, 24, admitted breaching nuclear non-proliferation laws by ordering various radioactive samples through the internet.
The package’s delivery sparked a major hazmat incident as Australian Border Force officials, firefighters, police and paramedics all combed the scene in August 2023.
But almost two years on, a judge on Friday spared Lidden a conviction and allowed him to walk from Sydney’s Downing Centre district court on a two-year good behaviour bond.
While his actions were criminal, judge Leonie Flannery found that the 24-year-old had mental health issues and displayed no malicious intent.
Speaking outside court after the sentencing, defence lawyer John Sutton said his client was relieved.
But the solicitor criticised border force for the way it had gone after the young man.
“It was an awful investigation for a whole range of reasons,” Sutton said.
Officers overreacted by storming Lidden’s Sydney home in hazmat suits when the amounts ordered were minuscule and harmless, he said.
“We could eat [them] and we’d still be perfectly fine,” he said.
“I’ve been contacted from scientists all around the world saying this is ridiculous.”
Prosecutors should have also questioned whether pursuing the case against Lidden in court was really in the public interest, Sutton said.
In a statement, border force Supt James Ryan called the multi-agency investigation against Lidden “extremely complex and sensitive”.
“The ABF remains committed to protecting the Australian community from all threats which can cross the border,” he said.
“I hope this example can be used as an education tool for people to be aware of the regulatory frameworks around what can and cannot be imported into Australia.”
Lidden is the first person prosecuted under Australia’s non-proliferation laws, aimed at preventing weapons of mass destruction and terrorism.
He ordered the items from a US-based science website and they were delivered to his parents’ home.
He pleaded guilty to two charges – sending nuclear material into Australia and possessing nuclear material.
At a sentence hearing in March, the lawyer described Lidden as a “science nerd” who committed the offences out of pure naivety.
“It was a manifestation of self-soothing retreating into collection; it could have been anything but in this case he latched on to the collection of the periodic table,” Sutton said at the time.
Nuclear materials can be imported legally by contacting the Australian Safeguards and Non-Proliferation Office for a permit first.
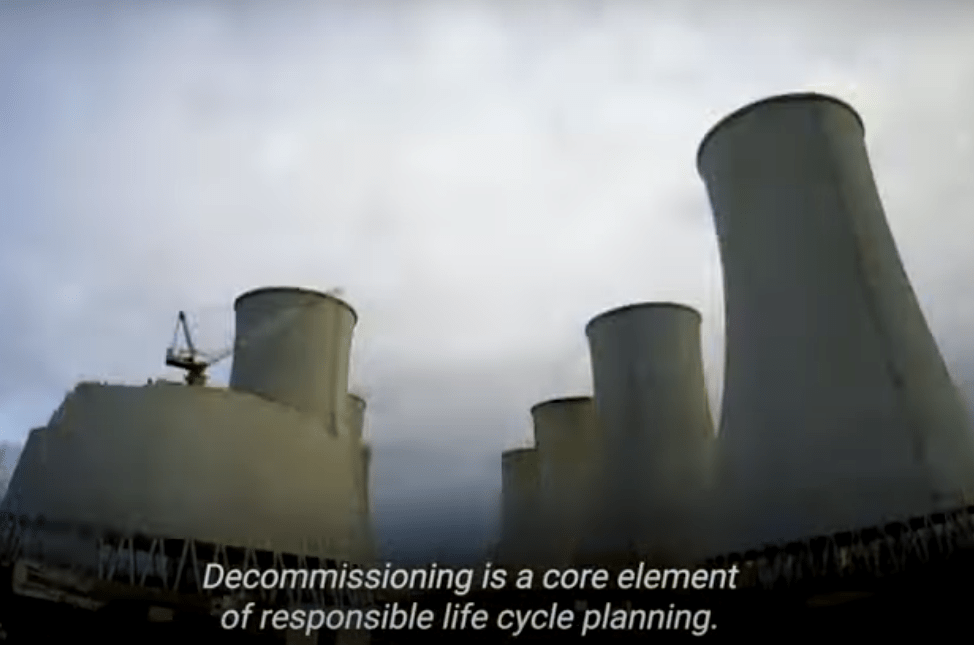
How can nuclear facilities be closed down in an environmentally friendly way once they have reached the end of their operating life? This video shows what it takes to decommission and restore a nuclear site.
As Kris Kolasinski and Martin Klingenboeck wrote in the IAEA news:
Planning and innovation play crucial roles when it comes to the end of a nuclear reactor’s life. Decommissioning activities, set to increase in the coming years as ageing nuclear power plants are retired, include decontamination and dismantling of structures, leading to the removal of regulatory controls so that a facility and site may be reused. In this video, you will learn how decommissioning activities are carried out effectively and safely, including the example of one such project currently underway in the French town of La Hague, where a former fuel processing plant is being decommissioned.
This video was first published in 2023 for the International Conference on Nuclear Decommissioning.
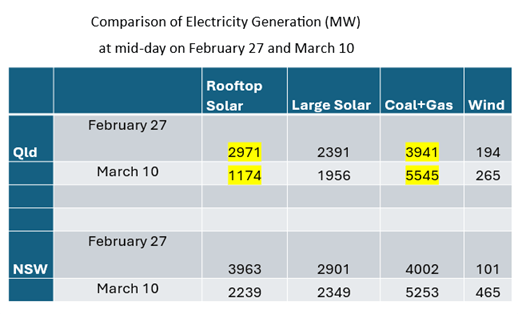
Cyclone Alfred was a 1 in 50y event that brought low grade cyclonic winds to southeast Queensland and northern NSW over a period of a week between March 4-11. However, it was the rain and associated flooding after the cyclone crossed the coast that caused the most widespread damage. The multi-day duration of cloud cover that the system brought is the basis of this blog.
Rooftop solar refers to solar panel on roofs, and this is dominated by residential (domestic) installations.
Currently more than 1-in-3 Queensland homes have rooftop solar, the highest rate of any Australian state or territory, with 6 GW having been installed by early 2024. Three quarters of the population of Queensland lives in the southeast corner of the state. Thus, three quarters of the dwellings with rooftop solar are located in this geographic region and account for the great majority of rooftop solar being fed into the grid during the day.
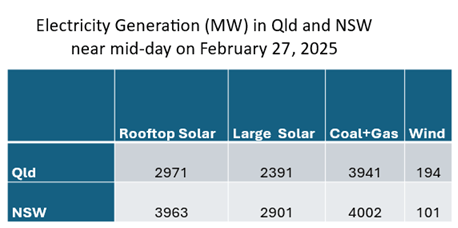
The table below shows the contributions of small (rooftop) and large scale (solar farms) inputs in MW to the Queensland grid in the middle of a typical bright sunny day. The electricity coming from coal and gas, and from wind are included for reference.
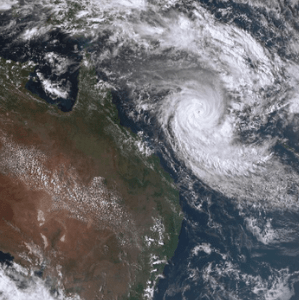
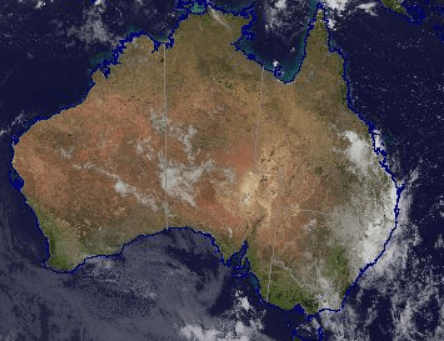
These figures were taken from the NemWatch site on February 27 when the cyclone and associated cloud was well off the coast (satellite image below) and the east coast was largely cloud free. I have also included the comparable figures from NSW for reasons that will soon become apparent.
For both states, solar was making by far the largest contribution to electricity generation.
Satellite Image (source: BOM) on February 27 showing cyclone Alfred and associated cloud well off the east coast.
The table below compares the data from February 27 with that at a similar time during the day on March 10 when there was extensive cloud cover over southeastern Qld and northern to central coastal NSW (see satellite image below).
What is immediately apparent from this table is the huge 60% drop (1800MW) in rooftop solar output seen on March 10. There is also an almost 20% drop in the output of large solar, but this is small in comparison. The 2200 MW loss from solar had to be made up by coal and gas generators.
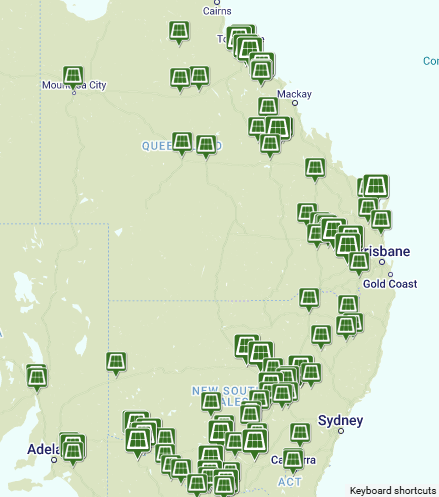
The question is why rooftop solar was impacted so much whereas large solar only suffered a modest decline. The reason is location! The locations of large-scale solar plants down the east coast of Australia are mapped below. What is immediately apparent is that in Queensland most of these are located further inland and north of the cloud covered area.
In New South Wales there was 45% drop in rooftop solar, and a similar 20% drop in large solar. Once again for similar reasons to Queensland where the cloud cover extended down the coast to the Sydney area which hosts the majority of rooftop solar in New South Wales. However, the drop wasn’t as big in Sydney because there was less cloud cover.
Satellite Image (source: BOM) on March 10 showing extent of cloud cover in southeastern Queensland and northern New South Wales.
This rooftop solar drought lasted for several days after Alfred, with coal and gas power continuing to make up the shortfall. Given that there is very little storage for the renewables component of the grid, this highlights the vulnerability of having the bulk of the rooftop solar generating capacity in the one geographic area. Even for those fortunate enough to have battery storage for their rooftop solar, this backup would not have been sufficient to last for the days of cloud cover.
This situation occurred again in March when a broad band of cloud blanketed much of southeastern Queensland for much of the month, extending across eastern New South Wales in the last week of March (satellite image for March 28 below). The solar output figures for Queensland and New South Wales at mid-day on March 28 are compared with the “reference” February 27 outputs below. The almost complete “collapse” of large-scale solar outputs in both Queensland and New South Wales was caused by the cloud extending much further inland in both states, and further north in Queensland than was the case on March 10. In both states, but particularly in NSW, the loss of solar was partly offset by an increase in wind generation.
What this shows is that the concentration of rooftop solar in the large coastal cities of Brisbane and Sydney exposes the vulnerability of the state’s solar generating capacity to cloud cover, especially during the summer season. This situation is likely to be worse in the coming years when it is likely that there will be increased southerly excursions of warm moist air from the tropics. These periods can last for days at a time and highlight the critical need for much more medium and long duration storage to firm even the current penetration of renewable generation.
This is a copy of a Substack article by Robert Hargraves on April 6. The full essay will be posted in several parts. https://substack.com/@roberthargraves1
Abstract
The root cause of nuclear power cost and opposition is excessive fear of radiation. This essay explores true observed radiation, effects, harm, and benefits, summarized here, proven later.
Doesn’t radiation from nuclear power plants causes cancer?
No, its radiation damage rates are slower than biological repair rates.
Isn’t the nuclear waste harmful to future generations?
No, we can store used fuel in ground-level casks as penetrating radiation decays away. You’d then have to eat the waste to get sick.
Don’t nuclear power plants cost too much?
Yes, because regulators’ rules were written using the precautionary principle, not today’s scientific observations.
Full Essay
Radiation is a weak carcinogen. After the WW II atomic bombings of Japan we all feared globally destructive nuclear war. To intensify that fear NGOs and nations exaggerated geneticists’ idea that even trivial amounts of radiation constantly degraded human genes through generations, even to birthing three-eyed monsters. When that fiction was disproven, the radiation fear of choice became cancer.
Governments and regulators strove to protect voters from the vague harm of invisible radiation, creating rules and procedures to keep people away from any radiation from nuclear power. These rules constantly became more strict and cumbersome.
These radiation exposure rules from worldwide regulators such as the US Environmental Protection Agency and Nuclear Regulatory Commission created the problem of high cost and long build times, making new nuclear power too expensive. In reality, nuclear power can be the least expensive reliable energy source, at $0.03/kWh, if we educate the public, politicians, and regulators.
Fear can kill. Radiation from the triple Fukushima nuclear reactor meltdown killed no one, but Japan’s fearful government killed over 1,600 people with hasty, unnecessary evacuations.
Nuclear power optimism is on the rise. Will people return to nuclear fear after the next failure leaks some radioactive material out? Perfection is impossible. Radiation releases will happen. Airplanes do crash. People still fly. They understand authentic risks and benefits.
Two Westinghouse AP1000 nuclear power reactors has been powered up in Georgia. Will these be the last commercial US nuclear power plants?
Radiation fear
Wisdom of a woman awarded two Nobel prizes.
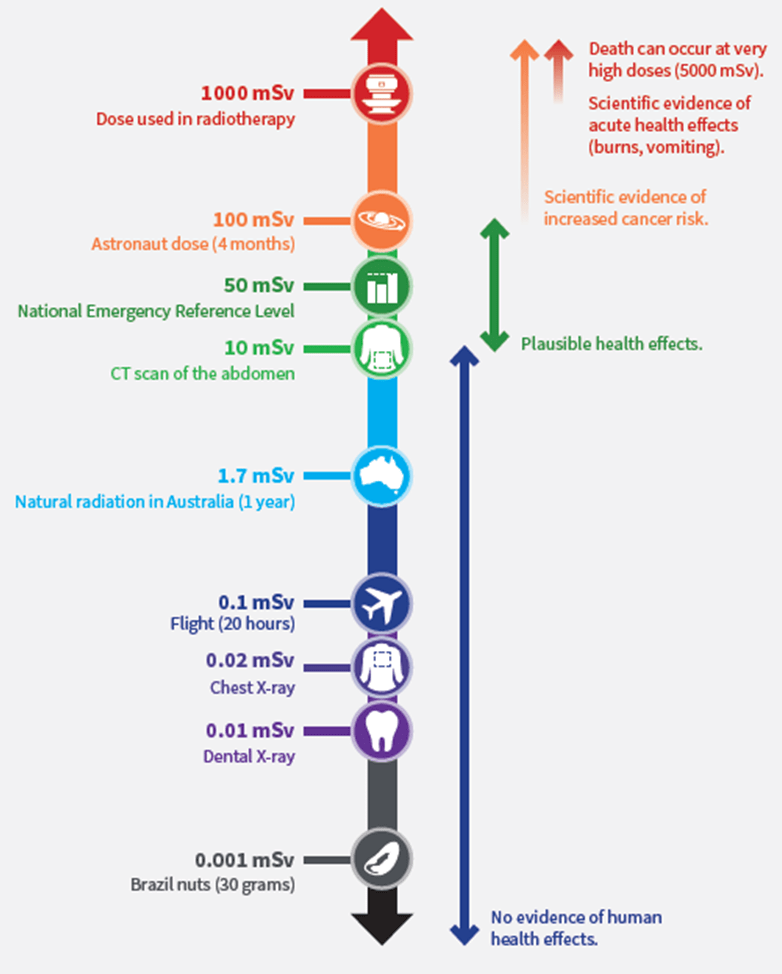
Ionizing radiation harms by displacing electrons, breaking molecular bonds in cells. Radiation dose is measured in Sieverts (Sv) or Grays, which are watt-seconds (joules) of energy absorbed, per kilogram of tissue. These are the effects of intensive, brief absorbed doses of radiation.
10 Sv is deadly,
1 Sv risks non-fatal acute radiation sickness,
0.1 Sv slightly increases future cancer risk.
Regulators mistakenly claim any radiation exposure is potentially harmful, so set unreasonably low limits, hoping to calm fearful people. Media headlines frighten people about any radiation leaks, no matter how small, in order to gain attention with headlines.
Nuclear power growth, now in vogue, will end with the next radiation release unless we replace today’s regulators with institutions that balance benefits against quantified radiation doses and observed effects.
The near century of concessions lowering 1934 radiation limits from 0.002 Sv per day to 0.001 Sv per year has not reduced harm. Lowered limits have increased public fear, along with evidence-free rulings that all radiation is potentially fatal.
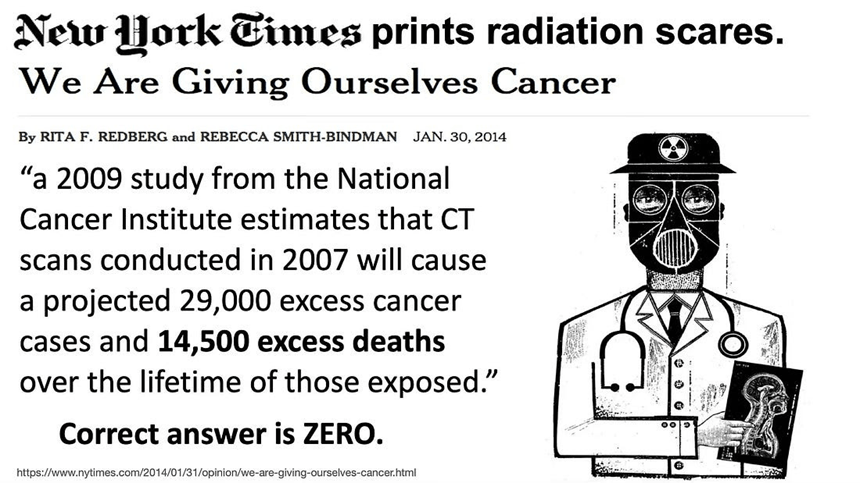
Newspapers often highlight unsubstantiated claims of radiation harm, such as this New York Times fright about CT scans, “a 2009 study from the National Cancer Institute estimates that CT scans conducted in 2007 will cause a projected 29,000 excess cancer cases and 14,500 excess deaths over the lifetime of those exposed.” The correct number is likely zero.
Atomic bomb survivors
After the 1945 atomic bombing of Hiroshima and Nagasaki, people and nations became concerned about the destruction of possible world-wide nuclear war. In 1950 began a studies of the health of the atom bomb survivors. The work was undertaken to make people more aware of the possible long term effects of radiation on genetics, and to increase fear of nuclear warfare. The Radiation Effects Research Foundation (RERF) maintains the data and publishes papers that explore linkages between cancer and radiation exposure. Radiation doses, by individual, were estimated after asking people where they were at the time of the bomb explosions, five years before.
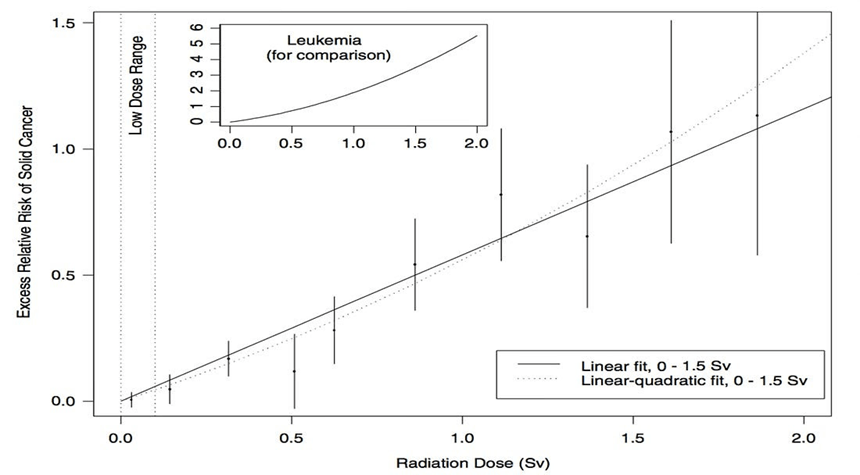
The US National Academies used REFR data to claim that the risk of solid cancer is directly proportional to absorbed radiation dose. They promote the LNT (linear no threshold) model of health effects of radiation, which maintains the chance of cancer is directly proportionate to radiation exposure, and thus there is no safe dose of radiation. They published this following chart of cancer risk for bomb survivors.
Excess cancer risk for people irradiated by the atomic bomb
However, the data point in the low dose range of exposures less than 0.1 Sv does not show evidence that such low doses case cancer. Few in the radiation science community endorse this LNT model of low dose radiation effects, but LNT remains the official policy of the US EPA, NRC, and many other organizations in the radiation protection industry.
National Council on Radiation Protection hides data refuting LNT.
A 2001 article by Jaworowski and Waligorski illustrated how many scientists were misinforming governments with information tailored to continue the simplistic LNT model. They misled people into fearing that even low level radiation was potentially deadly. The right side of their graphic shows the NCRP’s (National Council on Radiation Protection) seemingly linear relationship between leukemia mortality and radiation exposure for survivors of the atomic bombing, evidencing their support for LNT.
The left hand side shows the UNSCEAR (United Nations Scientific Committee on the Effects of Atomic Radiation) with much more detailed information about the effects of low dose radiation. There is clearly no evidence of increased leukemia mortality from radiation doses under 0.1 Sv (100 mSv). Clearly the LNT model is wrong.
A-bomb survivors’ exposures < 0.1 Sv caused no excess cancers.
The chart above uses bomb survivor cancer data to display that cancer rate increases from radiation, if any, are unobservable at doses < 0 .1 Sv. The leftmost, blue bar represents residents who happened not to be in the cities when the two atomic bombs exploded.
Part 2 will discuss regulation of nuclear facilities
It was our wonderful natural land that acted as a giant carbon sink squirrelling away almost all the carbon dioxide we produced on our land.
Bushfires caused half of that carbon dioxide we produced.
It did not include our fossil fuel exports or our imports of so many goods such as solar panels that are made using fossil fuels.
Sadly, the infographic was changed a few years later, hiding the bush fire source of CO2 by lowering the extent of the ecosystem role. Isn’t it better that we help natural systems and appreciate how much they do for us?
In many parts of Australia, when bushfires start, we simply let them burn. Most firefighting is done by an ageing voluntary fire service with little equipment and even this equipment is old and often no longer safe.
As the climate gets hotter, the potential damage done by bushfire in Australia will increase dramatically unless we do all we can to protect our land from fire and fight fires quickly and effectively when they do start. It has already been shown that access to water bombing helicopters can result in a fire being stopped very quickly. Timing is critical – the sooner a fire is reached and action taken, the less the damage. Too late is too late. Too late is too late!
A First Nations man told me recently that Australia spends less than 5% on fire management and 95% paying for the damage afterwards. He wanted to know why we had it so backwards.
We are spending billions of dollars to reduce the emission of carbon dioxide when we produce electricity. Yet, fire releases far more carbon dioxide and has the potential to become much worse. If we stay on our current pathway, we will destroy the ability of our land to be a carbon sink. Modern technology can tell us in minutes where and when fires start. Let’s start prioritizing the funds we have in our battle against global warming.
Many press stories were published onFri 21 Mar 2025 including this extract from Australian Associated Press.
“Homegrown scientist faces 10 years’ mail for importing plutonium. His package delivery locked down his street as special agents in hazmat suits swooped. Now he will be the first person ever to be sentenced under a decades-old law.
Sydney ‘science nerd’ may face jail for importing plutonium in bid to collect all elements of periodic table
Emmanuel Lidden, 24, to learn fate after breaching nuclear non-proliferation laws by shipping samples of radioactive material to parents’ suburban home.
A “science nerd” who wanted to collect all the elements of the periodic table could face jail time after ordering radioactive material over the internet.
But Emmanuel Lidden, 24, will have to wait to learn his sentence after breaching nuclear non-proliferation laws by shipping samples of plutonium to his parents’ suburban Sydney apartment.
Lidden pleaded guilty to offences under Australia’s Nuclear Non-Proliferation Act that carry a possible 10-year jail sentence and is due to receive his sentence from the judge Leonie Flannery on 11 April.
The importation sparked a major hazmat alert, with Australian Border Force (ABF) officials, firefighters, police and paramedics all attending the scene in August 2023.
Far from there being any intention of building something nefarious like a nuclear weapon, Lidden’s lawyer John Sutton described his client as an “innocent collector” and “science nerd” who had been left flipping burgers after being sacked from his job because of the investigation.
“He did not import or possess these items with any sinister intent … these were offences committed out of pure naivety,” Sutton told Sydney’s Downing Centre district court on Friday.
“It was a manifestation of self-soothing retreating into collection, it could have been anything but in this case, he latched on to the collection of the periodic table.”
Lidden had also been a keen collector of stamps, banknotes and coins.
But prosecutors said describing the young man as a simple collector and science nerd was a mischaracterisation.”
David Southwell’s article for the Daily Mail Australia was published on 15 December 2024.
“A science enthusiast is facing 10 years’ jail for importing nuclear material even though it was found to be harmless.
Emmanuel Steven Lidden, 24, was arrested in August 2023 when officers in full hazmat suits swooped on his parents’ Arncliffe unit in southern Sydney, blocking off the street and evacuating neighbours.
They confiscated plutonium and depleted uranium in decorative vials and polymer cubes that Lidden kept by his bedside after buying from a US science collectables website to complete a real-life periodic table.
Scientists found the samples were harmless, but Lidden pleaded guilty to importing nuclear material into Australia and possessing nuclear material without permission, which could land him in prison for over 10 years.
Lidden’s lawyer John Sutton said the anti-terror laws were clearly not aimed at people like Lidden.
‘These laws were created to protect society from terrorists and people who intend to cause mass destruction, not naive young science fans,’ he told the Daily Telegraph.
The laws were created in 1987 and Lidden is the only person to have been prosecuted under them.
Asked about the appropriateness of pursuing Lidden, a Commonwealth Director of Public Prosecutions spokeswoman said it ‘conducts all prosecutions in accordance with the Prosecution Policy of the Commonwealth’.
Lidden ordered the materials from an online store in the US. As the online store says Collecting elements is a fun way to learn about chemistry and nature in general. They have a range of display cases and element samples made to fit the different display cases. The cheapest one is shown below.
Originally, five radioactive elements were available for sale. The site warns – Don’t worry about their safety. Because of the small size samples their level of radioactivity is far too small to be hazardous to health so long as you keep these well out of the reach of children. Accidental ingestion, or particulates which are allowed to become airborne where they could be breathed in, do pose a serious health risk.
The more expensive kits use lucite cubes or glass vials. The containers used to hold the samples would have stopped any alpha rays. The uranium would have looked like this:
Many Elements are Radioactive
Most elements have one or more radioactive forms that occur naturally as a percentage of the whole. For example, potassium – 40 makes up about 0.012% or 120 parts per million of natural potassium. All our food is radioactive as are our bodies. Sleeping next to your spouse provides you with more background radiation. Potatoes are radioactive as are bananas. For more information on background radiation see my blog post. https://onewomanjourney.com.au/2024/12/30/background-radiation-how-much-radiation-do-we-experience-on-earth/
Interestingly, bismuth is not classified as radioactive and is sold as a treatment for travellers’ tummy wogs. Actually, it has no stable isotopes and a very, very long half-life.
Is Plutonium the Most Dangerous Substance on Earth?
As the late John Fremlin, professor of radioactivity at Birmingham University, famously advised a public inquiry, plutonium can be sat upon safely by someone wearing only a stout pair of jeans. At Harwell in the 1950s the newly-crowned Queen Elizabeth was handed a lump of plutonium in a plastic bag and invited to feel how warm it was. https://www.neimagazine.com/uncategorized/the-drama-of-plutonium/?cf-view
Plutonium is radioactive, but it doesn’t seem that harmful at first glance. It looks like any other metal, with a silvery sheen that turns dull in contact with the air. Queen Elizabeth II held a piece during a visit to Britain’s Atomic Energy Research facility at Harwell in 1957. It was warm to the touch, but it didn’t hurt.
According to some references the incidence happened in 1956 at the opening of the Calder Hall UK. A young Queen Elizabeth was invited to handle a lump of plutonium and feel the warmth of the extraordinary material, which she did. The shielding was a plastic bag and I presume the royal gloves. The Queen outlived almost all her contemporaries. (D Fishlock. ‘The Last Retort.’ Chemistry World 99, March 2005.)
Galen Winsor worked with plutonium for over 3 decades in the US. In the video below he talks about his experiences. Then he talks about his utter dismay when the Hi-Level Waste Disposal Act of 1982 was passed as part of “The Nuclear Scare Scam”- (about 26minutes into the video). This is a fascinating video for those interested in plutonium.
It is time Australia dealt with real risks appropriately rather than over-reacting to trivial issues.Fear of radiation is both costly and ignorant of the science.
I began my last blog by noting that sufficient storage, especially medium to long term storage will be critical to ensuring reliability for a renewable dominated grid. Here I will be discussing battery storage from home to utility scale, and the critical role that pumped hydro must play for long duration storage.
Batteries
The big benefit of batteries is their flexibility. Energy stored in batteries can be discharged quickly when needed. However, individual battery systems of the Lithium-ion (Li-ion) type can only currently provide about 2-4h of backup supply at full discharge rate. Below I discuss separately battery use for rooftop and large scale solar and wind.
Rooftop (Small) Solar
At the end of 2024 there were almost 4 million rooftop solar photovoltaic (PV) installations in Australia on 1 in 3 homes, totalling about 25 GW of nameplate capacity. This sounds like a lot and indeed in the middle of the day this is the biggest single source (up to 40%) of the electricity entering the grid in Qld, NSW and Vic. Installations are increasing by about 350,000 annually However, this situation is starting to lead to serious problems with maintaining 24/7 stability of the grid, largely because only 1/14 of the millions of rooftop solar installations have any associated storage! One of the major reasons for this situation has been the high cost of batteries which has made them economically unattractive for most homes.
“But when your power is coming from the sun, there’s no fuel. We’re not short of sun. It’s not really wasting it.
“Worrying about wasting surplus solar energy is kind of like worrying about the rain coming out of the sky when your rain tanks are full.”
I contend that this is a perverse statement. The reason being that while the energy from the sun might be free, the solar panels that convert the light to electrical energy require a lot of energy (mainly from coal) and material inputs to manufacture them. So, spillage effectively amounts to a decrease in the emission savings that can be attributed to solar. And no one is taking that into account!
There are proposals to install larger scale community batteries to take some of the daytime solar surplus, but the issue of who will pay for these initiatives beyond a few government-subsidised trial locations remains to be seen. Likewise daytime charging of electric vehicles may ultimately take up some of the rooftop solar surplus, but that is contingent on many more EVs entering service and charging stations being installed.
There is also the (policy) expectation that the batteries in EVs will be able to act as storage systems for the home (an EV battery is often 4-5 times bigger than a typical 12-14kWh home storage battery), and that this will ultimately make up a substantial proportion of short-term storage for the grid. However, as of the end of 2024 South Australia was the only state that allows bidirectional chargers to be installed in homes. Bidirectional chargers are also expensive, costing around $10,000, and the payback time for households is still more than ten years. https://www.mynrma.com.au/open-road/advice-and-how-to/what-is-v2l-v2h-v2g
Utility (Large) Batteries
There is currently about 18GW of large solar PV and 11 GW of wind power in Australia. However, very few of these projects currently have significant co-located storage.
Li-ion
The so-called “big” batteries are being installed to store surplus power from the renewables. About 8GW of largely Li-ion storage, typically with a duration of 2-4 hours, is currently under construction and being commissioned.
To meet projected grid storage requirements there will need to be 7 GW of battery type storage installed every year.
Decommissioned coal-fired power plant sites have been preferred locations for large-scale battery projects due to their existing electricity transmission infrastructure and previous industrial usage. AGL is building the 500MW/ 1GWh Liddell Battery Project in New South Wales. In May 2024 Queensland announced it was doubling the size of its Stanwell Clean Energy Hub battery, to 300 MW/1200 MWh. A battery at Collie in Western Australia will have a 219 MW/877 MWh first stage, with potentially up to 1000 MW/4000 MWh. To put these examples of current projects into context the initial “big” battery in South Australia had a capacity of only 130 MWh.
However, even the biggest of these batteries, is “small” compared to what will be needed. Not only that but typically they can only provide 2-4h storage. So, a 500MW battery might sound large but typically it can only provide full power for 2-4h (ie 1000-2000 MWh). We are going to need a lot more of these batteries if the 2030 renewables target is to be met.
One advantage that batteries have over pumped hydro is that they can be installed relatively quickly.
Like solar panels, the operational lifespan of current Li-ion batteries is relatively short, needing to be replaced around every 15 years. This presents a challenge for Australia’s net zero ambitions, as batteries that have been installed through the 2020s are likely to be need to be replaced in the 2040s – when the transition to net zero by 2050 will be imminent.
One critical aspect of Li-ion batteries that is rarely mentioned when the capacity of utility batteries is stated is that unless they are operated routinely between 20-80% of capacity then their life can be substantially shortened. This will constrain the effective supply capacity of a battery system if lifetime is to be maximised.
Flow Batteries
The other type of utility scale battery that is starting to emerge are flow batteries. These function a bit like pumped hydro because they work on the principle of the electrolyte fluid being circulated from charge to discharge tanks. Unlike Li batteries they can be made very large, and can be easily scaled up by increasing the capacity of the electrolyte storage tanks. They also have potentially a very long life, they cannot catch on fire, and the components are easy to recycle. They are ideal for large stationary utility storage. Vanadium flow battery technology was originally developed at the University of NSW in 1980s.
This is a schematic of a Vanadium flow battery, showing the different charged states of the Vanadium.
The largest commercial vanadium flow battery project is currently in China with a capacity of 175 MW/700 MWh. Australia has the third largest vanadium resource in the world so is potentially ideally placed to capitalise on this technology for future storage requirements. A potential 100MW/400GWh battery project is currently undergoing commercial evaluation in Perth. (https://www.ess-news.com/2024/11/06/australian-made-vanadium-flow-battery-project-could-offer-storage-cost-of-166-mwh/)
Pumped Hydro
The key difference between a pumped hydro scheme and a traditional hydropower operation is that pumped hydro is not a net generator of electricity. It is both a load and a generator, at different times, as needed. There are over 120 operating hydroelectric power stations in Australia, large and small, mostly located in south eastern Australia. In contrast, there are currently only 3 operating pumped hydro systems.
RTE measures the effectiveness of a storage system by measuring the ratio of energy output to energy input during a full charge-discharge cycle. The higher the RTE, the lower the losses and therefore higher the efficiency. Even more compelling is that the return on energy invested compared with return over its lifetime (EROI) for pumped hydro is almost 30 times higher than Li ion batteries! Pumped hydro projects also use very well-known and tested technologies and infrastructure that can last 50 to 100 years or even longer, compared to the much shorter (15-20 years) lifespan of batteries.
There is another compelling attraction for pumped hydro. Hydropower systems are synchronous generators. That is, they are similar to coal and gas fired thermal power stations running large turbines and do not require the elaborate stabilisation and conditioning (with associated costs) needed for direct inputs from solar and wind.
However, there is a major problem with pumped hydro compared with large battery systems that can be installed in months following delivery of the components. Pumped hydro systems are big infrastructure projects with long timelines required for environmental approvals, site characterisation, and construction.
So, what pumped hydro capacity does Australia currently have? The fact is that there has been very little hydro development in Australia since the 1970s. The plot below shows the annual output of hydro schemes in Australia from 1970 to 2021. In essence it has flatlined since 1970.
Data Source: Department of Climate Change, Energy, the Environment and Water, Australian Energy Statistics, Table I, September 2022
There is currently only 1.4 GW of operational pumped hydro capacity in Australia, with none having been commissioned since Wivenhoe in 1984. A further nominal 2GW is currently under construction as part of the much delayed and cost escalating Snowy Hydro 2 scheme.
Pumped Hydro (existing and under construction) in Australia
However, there is absolutely no doubt about the cost effectiveness of the Snowy project, even at the current estimated cost of $12Bn. For comparison, it would cost hundreds of billions of dollars using Li-Ion batteries to provide the equivalent amount of long duration storage.
Until the end of 2024 the 5GW Pioneer Burdekin pumped hydro scheme was being proposed for Qld. This would have been the largest pumped hydro scheme in the world, at an estimated cost of $20-30Bn. However, this project was terminated following the Qld State election and change of government, in favour of a number of smaller schemes, including the 2GW Borumba project. However, even the Borumba project may be scaled back to 1.5GW. Each of these pumped hydro schemes will require years to fully plan, obtain environmental approvals, and construct. There are other pumped hydro projects that are being considered but they are too early in the planning and approvals process to be mentioned here. https://www.allens.com.au/insights-news/insights/2025/02/pumped-hydro-current-projects-in-development-across-australia/
It is clear that there is no way that sufficient long duration storage is going to be in place by 2030-2035 when the current national policy settings require the 80% renewable electricity target to be met, as major coal-fired generators are scheduled to be phased out.
In my next instalment I will discuss what Cyclone Alfred has taught us about the vulnerability of electricity supply from rooftop solar in Queensland during adverse climate events in the southeast of the state.
In my last instalment I explained that Australia is going to need at least seven time more energy storage if we are going to have a chance of achieving a reliable and stable 80% renewables target by 2030. I will be upfront here and state that I don’t believe that that this notional target can possibly be met – with medium to long term storage being the big elephant in the room. The reason for this is that pumped hydro is the most critical component needed for large-scale long-term storage. The environmental approvals alone can take years before construction can even start so it is naïve to think that the quantum of required storage can be brought on line before the early 2030s. The current experience with Snowy Hydro 2 provides an object lesson.
Storage Basics
The basic unit of power for energy generation or storage is watts. Typically, we refer to large scale energy systems having a capacity of mega (million) watts or giga (1000 million) watts. In my last blog I noted that Australia is going to need about 22 GW of storage by 2030 to balance the grid. HOWEVER, I did not clarify what this means in terms of duration of storage, and how generation and storage must be matched to ensure we have a 24/7 electricity supply. This critical issue was picked up in some of the comments I received.
So, firstly a primer on energy storage systems (ESS). ESSs are not primary electricity generators. That is, they do not generate electricity from a fuel such as coal or gas, or from a solar PV system. They must use electricity supplied by separate electricity generators or from an electric power grid to charge the storage system, which makes ESSs secondary generation sources. ESSs use more electricity for charging than they can provide when discharging and supplying electricity. This is contrary to what many people believe because the perception is that the commonly used rechargeable power sources are actually power generators. They are technically “power banks”.
The Power capacity of an ESS is the maximum instantaneous amount of electric power that can be generated on a continuous basis and is measured in units of watts – megawatts [MW], or gigawatts [GW])
The Energy capacity of an ESS is the total amount of energy that can be stored in or discharged from the storage system and is measured in units of watthours – megawatt hours [MWh], or gigawatt hours [GWh])
A battery (eg Li Ion) can be built with an instantaneous capacity of 100MW, BUT it is typically only capable of maintaining this for 2 hours. Thus, you will see this battery being described as 100MW/200MWh. This time rating is somewhat analogous to the capacity factor concept for power generation that I have discussed previously
To put this into practical context such a battery would last for a maximum of 2 hours at full discharge load to supply about 30,00 homes. This would tide the consumers over the 2h peak period in the evening but no more. At least 6 of these batteries would need to be fully charged and ready to go to supply the rest of the night, and the low solar dawn and dusk periods, assuming no other source of power (eg coal, gas, wind, hydro). This is a simplification but what it does show is that a LOT of storage is going to be needed to keep a renewable-based electricity system running 24/7, given that solar can only supply for 7 to 8 hours on a good day, and the intrinsic variability of wind.
To put this number into context, the first of the so-called big batteries installed (in South Australia) has a capacity of only 0.13GWh, and the current total system storage is about 20GWh.
I have constructed the figure below from the data provided in the ISP 2024 to more clearly show the magnitude of the task ahead over the next 5 years. The use of the word “significant” by the authors of this plan doesn’t even come close to describing the order of magnitude increase in storage capacity that is going to be needed.
Storage Duration
Different forms of storage are needed to firm both consumer-owned and utility-scale renewables at different times of the day and year. These vary according to the length of time that electricity can be discharged at maximum output before they are exhausted. https://www.energycouncil.com.au/analysis/battery-storage-australia-s-current-climate/
Li-batteries are only capable of providing short duration storage of 2 to 4 hours, compared to a typical stockpile of coal providing a one-to-two-month buffer at a coal fired power station. As mentioned in my last blog it is somewhat perverse that coal-fired power stations are effectively providing the night time storage in energy supply to keep the electricity system in this country running through the night!
The next in line proven and commercially available technologies to provide medium duration storage (4-10 hours) for electricity from renewables are flow batteries – with the Australian developed vanadium flow battery technology being an example. Compressed air storage and solar concentrator/molten salt are others. These storage types can typically last up to 10h. The medium duration storage can also be provided by pumped hydro.
Even the largest utility-scale battery installations, cannot yet provide the deep or long-duration storage for many hours, or even multiple days that the grid of the future will need as renewables start to take up an increasing proportion of the generation mix.
In my next instalment I will be taking a deeper dive into batteries and pumped hydro, looking at their strengths and weaknesses and summarising where Australia currently sits in the deployment of these technologies.
It’s nuclear or nothing if we wish to be a reasonably self-sufficient country. With no merchant navy at all, we are very vulnerable from a security viewpoint if we rely on the import of all our fertilizers, most building materials and chemicals.
“Australia’s last major plastics manufacturer, Qenos, closed last year due to high energy costs. Now, Australia is wholly reliant on imported plastics from China.
In February, Australia’s only architectural glass manufacturer, Oceania Glass, collapsed after 169 years of operation, amid soaring gas costs.
Oceania Glass was Australia’s only manufacturer of architectural flat glass, producing and distributing format glass for use in Australian homes and buildings.
According to the company’s website:
“We have a proud heritage serving Australia, having sold our very first glass in 1856 and are the only architectural glass-maker in Australasia”.
“Our glass is featured in many of Australia’s most iconic buildings, including the Australian Parliament House”.
Oceania Glass required large amounts of energy, particularly gas, to maintain the 2000-tonne furnace at the heart of its operations.
“Certainly, for us as glass manufacturers, there are no real current alternatives for glassmaking outside of natural gas or other carbon fuels”, Oceania Glass chief executive Corné Kritzinger stated in January 2022.
Oceania Glass officially shuttered on Monday 3 March, and CEO Corné Kritzinger left the following heartfelt message on LinkedIn:
On Monday, 3 March 2025, Australia lost another critical manufacturing capability—architectural float glass. The closure of the country’s last remaining float glass plant was a quiet event, attended only by employees. This stood in stark contrast to its grand opening 51 years ago, when political and business leaders gathered to celebrate a milestone in Australian manufacturing.
There was no media coverage, no public acknowledgment—most Australians remain unaware that an entire industry has disappeared from their own backyard.
For the past 11 years, Australia had just one operating float glass plant. Now, there are none. We are entirely dependent on imported glass.
The reasons behind this closure are complex, but they boil down to one fundamental issue: Australia’s economic and regulatory environment is increasingly unfavourable to manufacturing. The challenges were insurmountable.
This business had a long and proud history. It began in 1856, importing glass into Victoria. In 1931, the first manufacturing plant opened in Sydney, producing patterned glass and shortly thereafter sheet glass. A drawn sheet plant- the predecessor to float glass – commenced in Dandenong, Victoria in 1962. Then, in 1974, Australia’s first float glass line, and the first in the Southern Hemisphere, was established in Dandenong. This investment drove rapid growth, leading to a second float line in Ingleburn, Sydney, in 1988 during Australia’s Bicentenary.
Float glass production is both an art and a science. It requires precisely blending seven raw materials and melting them in a furnace at a staggering 1600°C—comparable to the belly of a dragon.
Natural gas fuels this intense heat, triggering complex chemical reactions that transform raw ingredients into perfectly smooth, crystal-clear glass.
But now, that dragon’s fire has been extinguished—permanently.
To all who have worked for and alongside this business over the past 169 years, thank you. Your contributions and dedication have shaped an industry that, though gone from our shores, will not be forgotten.
Obviously, the hyperinflation of East Coast gas costs made Oceania Glass unviable.
These costs are certain to soar even higher once LNG import terminals are built in NSW, Victoria, and South Australia, thereby locking in import parity prices at the same time as nearly three-quarters of East Coast gas is exported, mostly to China.
So, while Australia exports most of its East Coast gas to China, it will now import plastics, glass, and nearly every other manufactured good from China, thanks to expensive energy costs.
All of Labor’s fantastical 1.2 million housing construction target will now rely on imported windows. We are not a serious country.” End of article.
It is worth noting that the use of gas instead of coal reduces CO2 emissions by half. Come on Australians, we can do better than this!
All our mammals are precious. Read about Cecil’s adventures. Learn about barotrauma, bats and wind turbines.
Cecil was raised in our old Queenslander on the Atherton Tablelands but he tried to fly before his wings were developed enough. He made it all the way to our shed and tangled himself in the netting we use on some of our fruit trees. Luckily we heard his cries for help but only after a night and part of a day. He was badly dehydrated. We had rescued younger baby microbats before, put them in a box and the mothers came and took them home soon afterwards. Cecil was too sick.
Atherton has a wonderful Bat Hospital which rescues about 1000 bats of many types each year. It is run by the founder Jenny Maclean and all her volunteers. The Hospital is now a tourist and education centre as well and the funds from tourism help to keep the hospital running. Jenny started caring for bats in 1990, setting up the hospital on her own property. https://tolgabathospital.org/bats/special-microbats/
When I rang Jenny, she came quickly to Cecil’s rescue but she couldn’t rehydrate him in a simple manner either. So off to hospital he went. A week or so later, Jenny brought him home and he flew off with his “clan” when they appeared at dusk to go hunting for insects. He can eat over 1,000 mosquitoes a night.
I assume Cecil is a common microbat the Eastern Free- Tail Bat (Ozimops ridei). This species is easy to raise as an orphan but the adults are hard to feed. Five different species of microbat come into the hospital – between 20 and 40 a year.
Most of the bats helped are the important Spectacled Flying Foxes that are critical for the pollination of the trees in our World Heritage Forest. In recent years the number of these flying foxes has dropped alarmingly. They get caught on barb wire fences and can die from tick infestations. They are killed by excess heat events and by wind turbines. It is the change in air pressure from the moving turbine blades, known as ‘barotrauma’, which is most deadly to bats. This phenomenon causes the small blood vessels in the lungs of bats to explode, killing them instantly. Some do collide with the blades.
It is only the microbats like Cecil that can use echolocation. The big bats have to depend on sight and smell contrary to common belief.
Germany has more radon baths than any other country. Yet they fear nuclear power plants. They closed them down and opened up coal mines knocking down ancient forests in the process. Medical benefit payments are paid out to people who attend the radon spas for relief of muscular-skeletal ailments. The medical fraternity warns of the dangers of radon yet people in pain still seek relief.
People have been using radon baths for thousands of years. Low dose radiation seems to lessen the pain and immobility of osteoarthritis. But not every patient benefits.
Many studies have shown that the more low dose radiation a population receives, the less cancer there is in the population. This effect is known as hormesis. I can also find studies that state that low dose radiation causes cancer.
Is anything black or white or just shades of grey? Is anybody totally truthful? We all have our biases. To get a message across about cognitive dissonance I wrote “Low Dose Radiation is not Harmful and May Even Be Good for Us!Nobody Died from Radiation at Fukushima”
But panic and fear of radiation caused the unnecessary deaths of over a thousand Japanese people following the evacuation.
Every decision we make in life rests on our perception of the risk involved versus the benefits. That balancing act changes with circumstances. For example, the amount of radiation used for cancer treatment is huge. None of us would want to receive that much in ordinary circumstances. A medical specialist tells us it is our best chance of beating deadly cancer and we accept the treatment for 2 reasons. Firstly, the radiation will be applied under very controlled conditions to a limited area. Secondly, the whole balance of the situation has changed.
A few years ago, I didn’t agree that Australia should have a nuclear power industry. Did we plan long term enough? Did we plan carefully? Were we just too Gung-ho?
I am now watching the destruction of Australia’s wonderful unique biodiversity as we lose forest and mountain ridges to wind turbine projects in Queensland in the “fight against climate change”. Is the balance, right? Do we have to destroy nature to save the planet?
Ecologists, Barry W. Brook and Corey J. A. Bradshaw ranked 7 major electricity-generation sources (coal, gas, nuclear, biomass, hydro, wind, and solar) based on costs and benefits. They published a paper in 2014 called: Key role for nuclear energy in global biodiversity conservation. https://conbio.onlinelibrary.wiley.com/doi/full/10.1111/cobi.12433.
This study still stands out. It used multicriteria decision-making analysis and ranked 7 major electricity-generation sources based on costs and benefits. It then tested the sensitivity of the rankings to biases stemming from contrasting philosophical ideals. Irrespective of weightings, nuclear and wind energy had the highest benefit-to-cost ratio.
The Integrated Life-cycle Assessment of Electricity Sources undertaken by the United Nations Economic Commission for Europe which concentrated on Carbon Neutrality in the UNECE Region has been extensively quoted by Oscar Martin on LinkedIn. https://digitallibrary.un.org/record/4020227?ln=en&v=pdf
Nuclear scored far better than wind power (and all other electricity generation types) on nearly all rankings with the exception of water use and of course radiation. Public and occupational exposures to radiation from electricity generation was far higher from coal and even geothermal systems than from conventional nuclear power plants. Likewise, every other of 22 assessed electricity generation types were more carcinogenic than conventional nuclear power.
Potential impacts such as specific biodiversity-related impacts, noise or aesthetic disturbance were not assessed under the land use analysis. Nuclear had the lowest lifecycle impacts on ecosystems, followed by various forms of wind and solar power. Under the land use assessment, renewable technologies were assumed to be readily built on various land types without heavy modifications such as land sealing, mountaintop removal, and flooding.
The assessment of land use which was used in the assessment of ecological impact for wind projects only considered the directly disturbed land (turbine pads, access roads) and assumed the surrounding land could be used for other purposes such as agriculture. For disturbed forests this leads to massive underestimation of the impact. Research in far northern Queensland is finding that impacts from wind turbines on some species in forests can extend 3 km or more from a turbine.
Nature is doing over half the work of reducing carbon dioxide levels worldwide. We can save nature and the planet. With a carefully planned mix of nuclear and other energy sources, we can preserve our biodiversity.
Yes, nuclear power is not 100% safe and clean. Nothing ever is. The benefits to humanity and nature are too great to ignore and far greater than the risk.
A magnitude 9.0 earthquake, centred to the east of Sendai caused a wave 10m high travelling at 800 kph . The highest wave hitting the coast of Japan was 23m. It travelled inland for 10 km in some places. The Hawaiian Islands had waves over 3 metres high. As many as 19,500 lives were lost from both the earthquake and tsunami.
Misinformation
The following figure, with the added title “FUKISHIMA RADIATION HAS CONTAMINATED THE ENTIRE PACIFIC OCEAN AND ITS ONLY GOING TO GET WORSE!” was repeated over and over again on the web by various “green” groups.
Yes, the figure was produced by NOAA (National Oceanic and Atmospheric Administration of the US Government). BUT it is a graph of WAVE HEIGHTS after the tsunami. NOAA does not measure radiation levels.
A similar graph has been used for years by Helen Caldicott including during a presentation to Teals before the last election. Helen’s graph had a logo from a company in Australia that does undertake radiological measurements. The company stated on their website that it was not their work and that their logo was falsely included. She must have known for nearly ten years that the graph was false. I am also horrified by nuclear war and nuclear bombs and admire her work in this area but not at the cost of truth about low dose radiation.
Nuclear power plants and nuclear bombs are very different. I hate nuclear weapons. However, the use of falsified information when advocating for the banning of nuclear weapons or nuclear power is not OK. It is particularly abhorrent when scientific data is used in a way that the author knows to be untrue. I was told to use this technique in an environmental campaigning course by a famous international “Green” organisation.
These types of fear peddling are totally unethical, particularly when they pretend to be scientific in nature.
Why Do the Media call the Tsunami, the Fukushima Nuclear Disaster?
How many deaths could have been avoided if suggestions for evacuation or shelter in place standards suggested by the IAEA had been used. But Fear and Panicked Evacuation of about 100,000 people was responsible for 2313 disaster-related deaths among evacuees from Fukushima prefecture.
An old nuclear power plant overdue for decommissioning was damaged at Fukushima Daiichi by a wave 13-15m high. The placing and tsunami protection of the Daiichi plant assumed a 3m wave.
Eleven reactors at four nuclear power plants in the region were operating at the time and all shut down automatically when the earthquake hit. Subsequent inspection showed no significant damage to any from the earthquake itself.
The residual heat cooling systems worked for 8 out of the 11 power plants. At Fukushima Daiichi, electrical power from all 6 external sources stopped and the generators turned on until the tsunami flooding disabled 12 0f 13 backup generators running the cooling systems. Switching gear was also damaged.
Heat built up causing steam in the cooling systems. Hydrogen was produced by the steam reacting with exposed Zircaloy cladding. The containments were filled with inert nitrogen, which prevented hydrogen from burning in the containment. However, the hydrogen leaked from the containment into the reactor buildings, where it mixed with air and exploded. 3 of the 4 reactor buildings were damaged by hydrogen explosions. This was not a nuclear explosion. It was simple chemistry. To prevent further explosions, vent holes were opened in the top of the remaining reactor buildings. All reactors were stable within 2 weeks.
Three Tepco employees at the Daiichi and Daini plants were killed directly by the earthquake and tsunami. There have been no deaths or cases of radiation sickness from the nuclear power plant incident. One man from the plant died of cancer died soon afterwards but it is thought to be unrelated.
But in contrast there were 2,300 deaths caused by fear of radiation that triggered the evacuation.
Government nervousness to this day has delayed the return of many evacuees to their homes. Concerns about radiation in the sea caused panic even in the USA and some people made themselves sick with overdoses of iodine.
Tritium.
About 18 months ago, South Korea and China advised their citizens to stop eating seafood. Water used to cool the Fukushima reactors had been decontaminated and stored in large tanks and was finally to be released to the sea by Japan. The IAEA carefully monitored the releases. Korean fishermen were suffering loss of income as a result of the bans. After Korea monitored the sea water, they reversed their advice. China has only recently lifted their ban as they could not detect any contaminants. I followed the data for a while. Sometimes the tritium levels were so low in the discharge, the discharge water was diluting the tritium levels in the the sea water.
Tritium is created every day in our atmosphere and comes down in the rain, ending up in the sea. This natural process is the overwhelming source of tritium in the ocean.
In 2008, David presented a paper in the International Mine Water Association conference in Karlovy-Vary (Karlsbad, Czech Republic). As part of our conference trip, we included a field trip to Hamr-Stráž, an area where uranium deposits had been exploited by the USSR with little regard for the environment or the health of workers. As part of the field trip we learnt about one of the huge legacies left for the Czech people to clean up. Technical details of the current chemistry and radiology were presented along with technological details needed for the rehabilitation of the ground water. Following the presentation we visited the extensive site where I spotted wild strawberries.
I decided to eat some and bent down and picked a few. Suddenly, I was the centre of attention. “Do you think you should eat them. Aren’t you scared of the radiation in the strawberries?” I looked at the men around me and said “You have seen the data, yes I will eat them.” Once I ate one, suddenly the atmosphere changed and many others joined me. The strawberries were wonderful. We had been given much more data than appears in the reference below yet fear came first, not data and rational thinking.
The cost is more than money. We blithely talk about protecting biodiversity in Australia. Are we doing so? What is the true impact on Climate Change when we buy renewables made overseas using coal fired power? Greenhouse emission data commonly quoted do not apply as they were calculated using nuclear and renewable energy for their production in Europe.
The Chernobyl liquidators are the people who were called in to deal with the immediate aftermath of the Chernobyl nuclear disaster in 1986. They lived in tents close to Reactor 4 and did so much work to keep the site safer and cleaner than it would have been. They are the firefighters, the men who cleaned off the burnt material on the roof of the reactor building. They built the sarcophagus, worked in the power stations, buried parts of the red forest and buried topsoil and nearby villages.
“An estimated 350 000 clean-up workers or “liquidators” from the army, power plant staff, local police and fire services were initially involved in containing and cleaning up the radioactive debris during 1986-1987. About 240 000 liquidators received the highest radiation doses while conducting major mitigation activities within the 30 km zone around the reactor. Later, the number of registered liquidators rose to 600 000, although only a small fraction of these were exposed to high levels of radiation.” https://www.who.int/docs/default-source/documents/publications/health-effects-of-the-chernobyl-accident.pdf
The majority still live in Russia, a few thousand still live in Estonia, many live in Slavutych and about 1500 moved to Israel. Chernobyl has been a Jewish enclave down through the centuries. The original liquidators were given little protection in very highly radioactive situations. My surprise is that some staff from Reactor 4 and some of the firefighters that crucial night are still alive. Depending on their country of residence, some of the liquidators receive pensions and/or have received compensation payments.
In the years before and after the Chernobyl Accident, the people of the USSR and later the independent states went through a period of poor nutrition and absent or very inadequate medical facilities. The average life span of men in these countries has increased dramatically as living conditions have improved. For example, people in Russia only had an average life span of 65 in 1993 and a life span of 73 in 2022. I saw one figure of only 53 years in the 1980s. In 2022, Ukrainians still only had a life span of 69 years. Smoking and drinking vodka were frequent pastimes during the hard years.
In 2006, Opinion was Divided over Chernobyl’s True Toll
The World Health Organisation and UNSCEAR (The United Nations Scientific Committee on the Effects of Atomic Radiation) both published reports in 2005. A fierce debate broke out fueled by scientists in Ukraine, Belarus and Russia as well as entities like Greenpeace that felt that the health impacts of Chernobyl were badly underestimated by WHO and UNSCEAR. The WHO and UNSCEAR reports claimed that fewer than 50 people died as a result of radiation from the Chernobyl Accident. Other estimates of the number of deaths so far in the former Soviet countries range as high as 50,000, reflecting deep splits in opinion over the appropriate way to evaluate the long-term effects of the tragedy. https://www.thelancet.com/action/showPdf?pii=S0140-6736%2806%2968559-0
There is no doubt that evacuation, dislocation and treatment of the liquidators led to severe mental illness in many people. Fear and stress can cause many illnesses. Claims by a Russian scientist of genomic instability is concerning. Genomic instability is only one of the many factors needed for cancer to manifest.
Unfortunately, many of the higher estimates from epidemiological modelling are based on the LNT Model formulated after WW2. It is now known to overestimate the potential impacts of low dose radiation.
Experts talk About the Health Effects of Chernobyl
“Being exposed to the sort of doses that come out of nuclear power plant accidents is far less dangerous than going sitting on a beach in Australia.” – Jerry Thomas
It was the Number Four RBMK reactor at the nuclear power plant at Chernobyl, Ukraine that caught on fire on April 26, 1986 demolishing the reactor building and then releasing large amounts of radiation into the atmosphere. The other 3 reactors kept operating, the last of them closing on December 15, 2000, and finally the decommissioning phase began.
Construction of the new city of Slavutych started in 1986, and the first inhabitants settled in October 1988. This new city was intended to replace the ghost city of Pripyat. Slavutych is sited on the left bank of the Dnieper River about 30 miles east of the Nuclear Power Plants (NPP). It is mostly home to survivors of the disaster who had to be relocated from Pripyat, among them about 8,000 people who were children when the disaster occurred. Many inhabitants still work at the site of the former plant for monitoring, maintenance, or scientific purposes. They commute to the zone on a regular basis. A rail line (twice crossing the international border with Belarus) runs directly from the city to the site of the NPP.
In 2021, of the approximately 7,000 people who came in and out of the CEZ to work, more than 4,000 had shifts of either 15 days a month or four days a week—schedules devised to minimize exposure to ionizing radiation. They are security guards, firefighters, scientists, decommissioning workers or those who maintain the infrastructure of this unique community. Many lived part-time in the ancient city of Chernobyl occupying some of the rooms and apartments that were evacuated in 1986. A few even lived in Pripyat.
About 70,00 tourists visited the inner zone of the CEZ prior to the war.
On 24 February, 2022 Russia invaded Ukraine and took over the CEZ. Ukrainians were allowed to keep doing work essential to the safety of the site under Energoatom but the rotation system broke down. On March 20 roughly half of the staff who were on shift when the Russians took over, were allowed to return home to Slavutych for the first time. The second rotation was allowed on 11th April. The Russian military controlled the CEZ for five weeks until they withdrew on 31 March. But roads had been made impassable and workers had to be brought via boat down the Dnieper River. The CEZ has remained in Ukrainian control since.
It has been reported that the Russians looted and destroyed a lot of equipment including 1000 computers and firefighting equipment. They laid mines but I have just read that the Ukrainians say they have cleared these.
Tanks and Russian Armed Forces caused a lot of harm to infrastructure and to the Red Forest area. It was claimed that an enormous spike in radiation (even in Chernobyl city) measured at the time by the gamma dose rate monitoring network in the CEZ was caused by tank movements disturbing the soil.
Beresford et al think that the effect was temporary and the high readings may have been due to military electro-magnetic frequency interference causing reporting anomalies from the detectors. https://pubmed.ncbi.nlm.nih.gov/37352719/ .
They have also published https://pubmed.ncbi.nlm.nih.gov/35196340/Current ionising radiation doses in the Chernobyl Exclusion Zone do not directly impact on soil biological activity.
What is Happening to Slavutych and the City of Chernobyl?
Slavutych is often cut off from the rest of Ukraine, and Belarus is hostile now. Bombing occurs and many people have fled. Even so, civilians with children have settled in Chernobyl as the housing is cheap. Slavutych was seen as a wonderful place to live but the population is dropping, noting that parts of Eastern Ukraine have lost half their population due to the war. With time the well paid work at the NPP is becoming less.
Decommissioning the NPP
The work is being funded by the Ukrainian Government, the European Bank for Reconstruction and Development and Other International Private Donors. (I ask why aren’t the Russians paying?)
The stages and actions are:
• Shut down: The last reactor at the plant was shut down in 2000. • Remove fuel: Nuclear fuel was moved to a storage facility in the first stage of the decommissioning process. • Deactivate reactors: All reactors will be deactivated in the second stage. • Maintain reactors: The reactors will be maintained until radiation levels drop to an acceptable level. • Dismantle reactors: The reactors will be dismantled and the site cleared. • Decontaminate: The plant and surrounding area will be decontaminated, including any radioactive soil and water. • Restore environment: The site will be restored to an environmentally safe state.
The first waste canister containing highly radioactive spent nuclear fuel from the Chernobyl nuclear power plant in Ukraine has been successfully processed.
There was a sarcophagus rapidly put in place on Reactor 4 as an emergency solution. It was starting to disintegrate. Better containment has always been needed.
Chernobyl’s New Safe Confinement
Chernobyl’s New Safe Confinement (NSC) is a design and construction project unprecedented in the history of engineering. Never before has such a huge structure been constructed at a heavily contaminated site.
It was started at the site in late 2010 and the structure was moved into position on Reactor 4 in November 2016. Following systems installation, testing and commissioning the New Safe Confinement has now been handed over to the Ukrainian authorities and the Chernobyl Shelter Fund was closed in late 2020. https://www.ebrd.com/what-we-do/sectors/nuclear-safety/chernobyl-new-safe-confinement.html
The Health of Workers of Slavutych
City authorities for Slavutych have stated that there is less cancer and heart problems than in other cities in Ukraine. This is interesting as many of the “Liquidators” still live in Slavutych. There are also claims that fertility levels in Slavutych are higher than in similar cities in Eastern Europe. Unfortunately references I saved from a few years ago, even if they are still on the web, have become impossible to translate. I would love more data. The effects of the war will probably confuse health data. People are fleeing due to bombing and isolation from the rest of Ukraine.
Current Radiation levels in the CEZ
In 2022, the German entity, the Federal Office for Radiation Protection (BfS) published the first area-wide radiological mapping of the exclusion zone in over 30 years at the request of the Ukrainian Government. BfS works for the safety and protection of man and the environment against damage due to ionising and non-ionising radiation.
In 1986, 115,000 people were forced to leave “for 3 days and no more” starting 36 hours after the Chernobyl explosion including the inhabitants of 81 villages. After 1986, another 200 000 people from Belarus, the Russian Federation and Ukraine were relocated. If you really wish to visit this period again this website will bring you almost up-to-date. https://world-nuclear.org/information-library/safety-and-security/safety-of-plants/chernobyl-accident .
Some of the residents started to return to their villages within weeks. These waves continued for about 4 years despite efforts to stop them. “Samosely” or selfsettlers are still residents of the Chernobyl Exclusion Zone – mostly Babushkas. By 1987, 1200 people had returned to live in their old homes. Eventually women past child-bearing years were allowed to stay. That means that nearly 40 years later the surviving residents have to be at least 90.
Today, there are about a 100 still surviving. This number has dropped from about 250 only a few years ago. They live off the land, growing their own food and picking Cesium 137 laced mushrooms. They have foraging pigs and chickens.
Hanna Zavorotnya and a pig in front of her home in the CEZ. Photo: Rena Effendi
Hanna is one of the 3 stars in the 2015 documentary “The Babushkas of Chernobyl“. It can still be viewed or bought on the web from various sources.
The Samosely have lived hard lives and remember so much: the starvation of 1932 under Stalin when millions died, the brutality of Nazi occupation then forced eviction from their Motherland. Now they fight to keep their crops from wild animals. Finally, the Russians took over the area again for a time following years of Ukrainian independence. The war continues. For a time, landmines were in parts of the forests.
The Joy of Harvest: Photograph by Yuli Solsken
Photo by Jorick de Kruif in 2018: Ivan Semenyuk was 82 years old and lived in the house he built in the 1950s in the village of Paryshev.
When interviewed in 2018, Ivan was growing cabbages, tomatoes, cucumbers, carrots, shallots, potatoes and beans on his allotment. He loved to fish and gathered mushrooms, berries and medicinal herbs in the forest. A mobile shop, which was supposed to visit every Friday, brought food, household chemicals and basic necessities, which he could buy with his pension which is delivered to him and other elderly inhabitants of the zone. Ivan has mains electricity, and recalls that they did not have to pay for it for two years after he returned. He draws water from his own well on his land. He has a mobile phone, television and radio, and keeps in touch with the outside world between visits from his son.
Like other inhabitants Ivan had trouble with wild animals destroying vegetables growing in his garden. He respected radiation but greatly feared the packs of wolves and the snakes. He and his dogs had been attacked by large packs of wolves, 6 dogs being killed in one week. Eventually, the authorities permitted him to shoot wolves.
What of the radiation? Ivan explained how men with dosimeters checked levels in his well and land. He stated that there was now no radiation in the village. (Visitors are warned not to eat anything in the zone.)
There is no doubt that like the animals of the CEZ, the Samosely experienced higher levels of ionising radiation than the normally accepted levels for humans. However, I suspect that the levels were in the low dose range. Yet these people seem to have outlived those of similar age and background who left their “MotherLand” and lived elsewhere. I would like to have seen better radiological data.
Next time: thousands still work at the nuclear power stations. A few people live in the ancient city of Chernobyl.
China has been doing an astounding job of reducing the use of fossil fuels for transport. Australia is lagging so far behind.
I am jealous that I can no longer be part of China’s advances. I was involved in the very early stages of China’s electrification and construction of its high speed rail system. It has been quicker and cheaper to catch a train between many Chinese cities than to catch a plane for many years now. I left Hong Kong and China where I had been leading the environmental planning of many major projects because I was smashed by a taxi running a red light on a pedestrian crossing in Paris. Unable to dress myself for 12 months I returned to Australia.
A little memento of my time at a celebratory dinner about the start of China’s high speed rail system is pictured below.
In the first few years after the Chernobyl Catastrophe, most of the attention was focused on human health. The general impression was that any animals living nearby were either killed or badly maimed and the forest was quiet. Some farm animals were born malformed with extra limbs and a few forest creatures were also seen to be mutated. It is no surprise that in those early years very high levels of radiation either killed or maimed. Creatures in utero or in the period of rapid cell growth and organ differentiation were particularly vulnerable. Expectations for the future were very pessimistic.
Few researchers expected what then happened!
Ecologists have found the land surrounding the damaged nuclear power plant, which has been largely off limits to humans for three decades, has become a haven for wildlife, with lynx, bison, deer and other animals roaming through thick forests. This so-called Chernobyl Exclusion Zone (CEZ), which covers 2,800 square km of northern Ukraine, now represents the third-largest nature reserve in mainland Europe and has become an iconic – if accidental – experiment in rewilding.
Contamination Levels in the CEZ
The contamination levels within CEZ vary considerably. The highest levels are in the “Red Forest”. Around the destroyed nuclear power plant and in the nearby city of Pripyat, the radiation caused the leaves of thousands of trees to turn a rust color, giving a new name to the surrounding woods. Workers eventually bulldozed and buried the radioactive trees. What these levels actually are vary from source to source but they are still very high.
The levels of contamination by iodine 131 dropped quickly in the first year as it has a half-life of 8 days. Similarly cesium 134, with a half-life of 2 years, has almost disappeared. The isotopes cesium 137 and strontium 90 remain mostly tied up by the clay in the soil. Fungi can have relatively high levels of cesium 137. Recent radiation levels in most of the CEZ vary from less than 1 to over 800 mSv /year.
Cesium 137 and strontium 90 have half-lives of about 30 years. Thus the radiation levels will have now halved since the disaster. In about 200-300 years there will be very little radiation left. Cesium is not easy to absorb. Clay binds to it strongly. The cesium that is absorbed has a biological half-life of 90 days. Similarly strontium is also bound to clay but once in a vertebrate, it is bound into bones and stays there for a long time as it is not excreted. It should also be remembered that both isotopes are toxic chemically as well as being radioactive.
The Animals of Chernobyl
Top predators like wolves that ate other contaminated animals were assumed to be particularly vulnerable.
The reality has been that larger mammals have thrived. These include Eurasian lynx, gray wolf, wild boar, brown bear, European bison, elk, red deer, red fox, roe deer, raccoon dog, and Przewalski’s horse. Thirty horses were introduced in the late 1990s. Cameras traps now indicate that there are over 100 of this special breed.
Top: European Lynx (U.K. Centre for Ecology and Hydrology), Brown Bear and Bison (Sergey Gaschack), then below Fox (AP PHOTO / Sergui Chuzavkov), Black Grouse (Nick Beresford), Raptor (REUTERS/Vasily Fedosenko).
Other commonly observed animals include moose, black grouse, snakes, owls, raccoon dogs, foxes, pine martens, and badgers. There have been suggestions that foxes may not be reproducing as fast as other animals. Perhaps the lack of farmers’ chicken pens has reduced their feed source!
Domestic cats have now bred for many generations without the presence of farming families. There are lots of rodents as a food source. Dogs left behind vary in their quality of life with the situation being complicated by human activities.
The monitoring of animals has become much more sophisticated and some creatures are now being tagged. Recent work includes genetics, and biochemistry of blood and tissue samples.
I have included the following video. The story is great and the animals shown wonderful. Some of the ideas may be outdated but the video is fascinating. I loved watching it. There are lots of other videos on the web. They vary in quality and degree of bias. The pictures of mutated animals appear to have been taken prior to 2000.
Ecological Studies
Unfortunately no scientists or other visitors are allowed to enter the CEZ at the current time due to the war. So studies are on hold. Scientists tend to be very conservative and continue to ask each other difficult questions. Early studies did not examine the health of the animals seen.
Two evolutionary biologists teamed up to study the area’s birds. They were Anders Møller of University Paris-Saclay in France and Timothy Mousseau of the University of South Carolina. Their early surveys showed that certain bird species tended to have more genetic mutations, smaller brains and less viable sperm in sites with higher radiation levels. And in 2007, they counted 66 percent fewer birds and 50 percent fewer bird species in highly radioactive places compared to background-level sites.
In dozens of studies, the pair also documented that, with higher radiation levels, there were significantly lower numbers of soil invertebrates and a lower abundance of certain insect species and such mammals as hares and foxes. Working with collaborators in Finland, they also documented a range of health effects in bank voles.
Over the last 10 to 15 years much more detailed studies have started and early pessimistic authors are now also finding that the creatures are adapting well to higher levels of radiation including Møller and Mousseau. By 2014, in a paper they published with others: Chronic exposure to low-dose radiation at Chernobyl favours adaptation to oxidative stress in birds.
We found a pattern radically different from previous studies in wild populations, showing that GSH levels and body condition increased, and oxidative stress and DNA damage decreased, with increasing background radiation. Thus, when several species are considered, the overall pattern indicates that birds are not negatively affected by chronic exposure to radiation and may even obtain beneficial hormetic effects following an adaptive response. Analysis of the phylogenetic signal supports the existence of adaptation in the studied traits, particularly in GSH levels and DNA damage. https://besjournals.onlinelibrary.wiley.com/doi/full/10.1111/1365-2435.12283
Attitudes were changing.
When other scientists reanalyzed early data by Møller and Mousseau on a dozen mammal species, they found that radiation had indeed caused declines in abundance, but only at higher doses than the pair had originally reported. No account had been made of the radioisotopes already within the bodies of the mammals. This is Science in action.
Dr Ismael Galván, of the Spanish National Research Council said “Previous studies of wildlife at Chernobyl showed that chronic radiation exposure depleted antioxidants and increased oxidative damage. We found the opposite – that antioxidant levels increased and oxidative stress decreased with increasing background radiation.” The species surveyed were: Red-backed shrike, great tit, barn swallow, wood warbler, blackcap, whitethroat, barred warbler, tree pipit, chaffinch, hawfinch, mistle thrush, song thrush, blackbird, black redstart, robin and thrush nightingale. “Chronic exposure to low-dose radiation at Chernobyl favors adaptation to oxidative stress in birds.” https://besjournals.onlinelibrary.wiley.com/doi/10.1111/1365-2435.12283
A Recent Study on Wolves
So far the findings from this important study are only available as an abstract from 2024. A full paper has not yet been published, probably because of the pause in research. Polygenic adaptation and co-regulatory dynamics in Chernobyl wolves: Unveiling immune and oncogenic stress interactions with implications for human cancer resilience. https://doi.org/10.1158/1538-7445.AM2024-7322
Gene signature variations in CEZ wolves reveal a distinct immune profile, likely shaped by prolonged radiation exposure. These findings, along with evidence of polygenic selection, suggest adaptation to multigenerational radiation exposure (an oncogenic stress). Notably, the enrichment of genes with positive prognosis in human cancer overexpressed in CEZ wolves present a valuable model to explore genetic underpinnings of cancer immunity and advance our understanding of cancer resilience in humans.
In other words, the wolves in the CEZ are a unique population of gray wolves that have adapted to survive levels of radiation six times higher than the legal limit for humans. They are the subject of scientific research that aims to understand how animals can survive in these conditions. The research so far suggests that the wolves have developed genetic mutations that make them resistant to cancer. The wolves are thriving. Their population in the CEZ is seven times denser than in low radiation protected areas in Belarus.
Next time: what has happened to the humans that live and work in the CEZ?
Firstly, I will summarise where our electricity and energy (the “power” to run things) currently comes from. Secondly, point out the “elephant in the room” which is the fact that much of Australia’s income (our economic “power”) comes from the export of fossil fuels and is sustaining a large part of our economy and lifestyle.
Australia’s Current Energy Mix
In 2022-2023 fossil fuels (coal, oil and natural gas) accounted for almost all (91 per cent) of Australia’s primary energy mix, and 2/3 (65%) of our electricity. While the percentage contribution by renewables to electricity generation has been steeply rising over the last ten years it still has a very long way to go if the Australian Government’s target of 82% of the electricity is to be provided from renewables by 2030.
Australia’s Energy Exports
The export of fossil fuels (coal and gas) is the largest contributor to Australia’s foreign income. That is, they are the source of much of our economic “power”. It is this income that provides much of the funding for our social security, health and education systems, and perversely for the government’s funding initiatives to facilitate the energy transition. So, the question is what will replace this income stream? This is an existential issue that will need to be addressed sooner rather than later by our Federal and State Governments.
It is well known that Australia is an energy-rich country with large reserves of coal, gas and uranium. In fact, we are the largest exporter of primary energy sources in the world, holding the following rankings: • Metallurgical (Coking) Coal (for steel making) – No 1 • Thermal Coal (for electricity generation)– No 2 after Indonesia • Liquefied Natural Gas (LNG) – No 1 or 2 after Qatar or the USA • Uranium – No 4
So, can it be concluded that since we produce so much coal and gas that we are making (directly or indirectly) a major contribution to the world’s carbon emissions?
World Production Of Coal and Gas
No – not on a world scale where the total amounts of coal and gas produced in Australia are only small fractions of the totals that are being produced elsewhere. Apart from Indonesia, most of the coal produced is used internally by the countries that mine it.
The situation is remarkably similar for natural gas. However, in this case it is the USA and Russia that are by far the dominant producers. Australia ranks a long seventh in the production statistics accounting for about 4.6% of the world’s production. About 70% of the gas produced in Australia is exported as liquefied natural gas (LNG).
The energy content and monetary value of Australia’s energy exports for 2021/22 are summarised in the table below. In this table I have shown coal exports (thermal and coking) in aggregate and separately. The reason for this is their different uses- thermal for electricity generation and coking for steel production. It is really important to distinguish between these two uses, since while renewables can potentially replace thermal coal for power generation over the intermediate term such is not the case for steel making where the majority of steel will continue to be made for some time using coke (https://www.aspistrategist.org.au/throttling-australias-coking-coal-exports-wont-help-world-decarbonise/ )
So how much foreign income does Australia get from the export of these energy commodities? In 2021/2022 fossil fuels totalled $183Bn! This is just over one-quarter (25%) of the country’s total income. For interest, the number 1 contributor to our foreign income is iron ore, which accounts for one-fifth (20%).
One of the most important things to take from this table is that although uranium was worth only a fraction of the amount received for coal, the equivalent thermal energy embodied in that uranium is huge. In fact, on a per tonne basis uranium contains 70,000 times the amount of energy as coal. To put it another way that tiny (comparatively speaking) tonnage of U contained 40% of the energy embodied in the total mass of thermal coal that was produced in 2021/22. This partly explains why the fuel is such a low % of the overall cost of constructing and operating a nuclear power plant. It is the other way round for a coal (or gas) power station.
In summary, most of Australia’s energy supply continues to be provided by fossil fuels. Moreover, the export of coal and gas provides the single largest contribution to our foreign income. Reducing the production and export of fossil fuels will require a corresponding increase in foreign income from other sources. This is a major challenge that must be addressed by future governments or else our national per capita income will continue to decline.
In my next instalment I will be taking a closer look at our current sources of electricity.
Photo taken in Nagasaki Atomic Bomb Museum in May 2024 by my husband Dr. David Jones
The Bombing Of Japan in 1945
On 6 and 9 August 1945, the United States detonated two atomic bombs over the Japanese cities of Hiroshima and Nagasaki. Japan surrendered to the Allies on 15 August, six days after the bombing of Nagasaki and the Soviet Union’s declaration of war against Japan and invasion of Japanese-occupied Manchuria. The Japanese government signed the instrument of surrender on 2 September, effectively ending the war.
The firebombing of Tokyo, on 9–10 March, killed an estimated 100,000 people and destroyed 41 km2 (16 sq mi) of the city and 267,000 buildings in a single night. Firebombing then switched to smaller cities. According to Yuki Tanaka, the U.S. fire-bombed over a hundred Japanese towns and cities. (Tanaka, Yuki; Young, Marilyn B. (2009). Bombing Civilians: A Twentieth Century History. New York: New Press, and Kerr, E. Bartlett (1991). Flames Over Tokyo: the US Army Air Forces’ Incendiary Campaign against Japan 1944–1945. New York)
Two Atomic Bombs Were Dropped
These are the only nuclear weapons to ever be used. All war is horrific. Nuclear weapons should not be used. A uranium bomb was dropped on Hiroshima and a plutonium bomb on Nagasaki.
An estimated 90,000 to 166,000 people in Hiroshima (between 26 and 49 percent of its population) and 60,000 to 80,000 people in Nagasaki (between 22 and 32 percent of its population) died in 1945, of which a majority in each case were killed on the days of the bombings, due to the force and heat of the blasts themselves. Nearly all of the remainder of victims died within two to four months, due to radiation exposure and resulting complications.
Cancer
Cancers do not immediately emerge after exposure to radiation; instead, radiation-induced cancer has a minimum latency period of some five years and above, and leukemia some two years and above, peaking around six to eight years later. Almost all cases of leukemia over the following 50 years were in people exposed to more than 1Gy (1000mSv).
TheHibakusha
The survivors of the bombings are called hibakusha (被爆者), a Japanese word that translates to “explosion-affected people”. The Japanese government has recognized about 650,000 people as hibakusha. As of 31 March 2024, 79 years later, 106,825 were still alive.
Hibakusha and their children were (and still are) victims of fear-based discrimination and exclusion for marriage or work due to public ignorance. So they married each other. Some of the public persist with the belief that the hibakusha carry some hereditary or even contagious disease. This is despite the fact that no statistically demonstrable increase of birth defects/congenital malformations was found among the later conceived children born to survivors of the nuclear weapons used at Hiroshima and Nagasaki, or has been found in the later conceived children of cancer survivors who had previously received radiotherapy. The surviving women of Hiroshima and Nagasaki, who were exposed to substantial amounts of radiation, had children with no higher incidence of abnormalities/birth defects than the rate which is observed in the Japanese average.
Talking to residents in Nagasaki last year, we found very varying views. One tourist operator claimed she was scared to work in Nagasaki as you couldn’t believe what the Government tells you and fears that Nagasaki is still radioactive. She did not live there. Another resident loved living in Nagasaki and said, “what radiation?”.
LNT: Linear No-Threshold Model
A great deal of research has been undertaken about the effects of radiation from the use of the 2 bombs. Research still continues particularly on the offspring of survivors. Some of the early results led to the creation of the LNT which has been used extensively ever since.
The Linear No-Threshold Model describes the relationship between the amount of exposure to ionizing radiation and the risk of harmful effects. It is graphed as a straight line and passes through zero despite the fact that there is no data in the low dose region. This assumes that even low levels of radiation exposure are harmful.
LNT is used to set radiation standards. The LNT model remains a prudent basis for radiological protection at low doses and low dose rates. It is simple to use and is strongly protective and conservative. However, there is increasing evidence that it is overprotective and leads to massive unnecessary costs.
The LNT does not take into account 2 important facts about low dose radiation. Firstly, it assumes radiation is accumulative and takes no account of the fact that all cellular living things have repair mechanisms. Secondly, it does not differentiate between total dose and dose rate. However, attempts to further lower the standards must be carefully justified and based on thorough research.
However, when collective dose is combined with a linear dose-response coefficient to predict risk in large populations exposed to low doses, the number generated will overestimate real risk. The slope of the graph is often used in epidemiological studies to calculate risk and relative risk thus assuming the risk to calculate the risk. This is biased thinking and may even lead to fear mongering.
No radiation-induced genetic (= hereditary) diseases have so far been demonstrated in human populations exposed to ionizing radiation. (HEREDITARY EFFECTS OF RADIATION United Nations Scientific Committee on the Effects of Atomic Radiation UNSCEAR 2001 Report to the General Assembly, with Scientific Annex) https://www.unscear.org/docs/publications/2001/UNSCEAR_2001_Report.pdf
What Does the Term Low Dose Radiation Really Mean?
Scientists in Radiation Research or those in the Nuclear Power Industry define radiation levels over 100mSv as high dose. Levels must be under 100 mSv to be called low dose. In the medical field the term low dose is not defined and treatment doses are described as high, medium or low. This is very confusing as in the medical literature low dose refers to levels of radiation that are extremely high and usually thousands of mSv.
Dose Makes the Poison
We all know that too much of anything is bad for us, even water. I was a student in Vietnam War days and remember being horrified at the use of water torture. A prisoner was tied down, a funnel put in his mouth and water poured in his mouth until he told all or…
Conversely, it seems likely that too little of almost anything can also be harmful. There is a sweet spot for everything but this zone varies from person to person, species to species and depends on the mineral, the vitamin, the substance or activity, and even radiation. Even arsenic is needed as a co-factor for one enzyme to work.
Ah, What About Dose Rate?
De Toledo et al. 2006
Yes, the graph above is real! There was far more chromosome damage in the control cells than in the cells receiving 10cGy (100mSv) spread out over 48 hours. We now know about many of the changes that occur in cells and tissues and organs dosed with radiation.
We may know more about low dose radiation and its effect on the body than almost any other substance. Thousands and thousands of scientific papers have been published. A book published by Dr Antone L Brooks summarised the work of a US DOE research group he led as Chief Scientist in the period 1998 to 2008 with over 800 references. I have read this book which I obtained a couple of years ago plus hundreds of other scientific and medical journal articles and I read more each day.
There is a major difference between the effects of high and low dose radiation. At low doses and low dose rates the system has time to repair damage that occurs. Most of the biochemical changes are very positive and can even protect the cell or tissue from further insult.
Very High Background Radiation Areas Of Ramsar, Iran – An Example of Adaptive Response
“An in vitro (in the lab) challenge dose of 1.5 Gy (1,500mSv) of gamma rays was administered to the lymphocytes, which showed significantly reduced frequency for chromosome aberrations of people living in the high background compared to those in normal background areas in and near Ramsar.
Specifically, inhabitants of high background radiation areas had about 50% the average of induced chromosomal abnormalities of normal background radiation areas inhabitants following this exposure.” Health Physics82(1):p 87-93, Jan 2002.
All Living Things on Earth Can Repair Low-Dose Rate Ionizing Radiation
Most of the repair mechanisms seem to have evolved very early in the history of life on Earth at a time when radiation levels were very high. Without these repair mechanisms, life could not have evolved to use oxygen in energy production and there would not be any plants or animals on land. More on how this works in a future blog. All living things have these repair mechanisms.
I have a hypothesis that the reason we can’t sense radiation is that we don’t need to do so. There would have been no evolutionary advantage in having that ability.
Ref: Wade Allison Emeritus Prof of Physics lecture 2018, Dun School of Pathology, Oxford
There are many articles on the web that link cancer treatment with heart disease. An example from the Cleveland Clinic states “Radiation heart disease is a side effect of radiation therapy for cancers in the chest and includes a wide range of heart conditions. Because it can occur many years after exposure, close monitoring is essential.“
There is no doubt that high doses of radiation can cause cancer. This has been well known since the Second World War when two nuclear bombs were dropped on Japan. Medical journal articles linking radiation treatment for cancer to later heart conditions have been around for at least 4 decades. It is important to read the full papers as the term “low dose” radiation often actually refers to quite high radiation doses well above 100mSv.
But How Much Radiation Causes Cancer and Heart Disease?
By the early 1980s, it was becoming widely known that radiation treatment for cancers of the chest increased a wide range of heart problems. Medical studies of the period described how patients receiving more than 30 grays during treatment had a high risk of developing heart issues in coming years. Just how much is 30 grays? 30 grays is 30 sieverts that is 30,000 mSv. This is an enormous amount of radiation! These 1980 studies have been quoted over and over again in medical review documents. Unfortunately, the radiation dose levels are not often discussed leaving some readers in doubt that very high doses of radiation are the cause. Personally I am still astonished at the amount of radiation used for cancer treatment.
Modern radiotherapy for cancer treatment has taken giant strides. Many cancers are treated with radiopharmaceuticals. These agents combine relatively short-lived radioisotopes with biological compounds that target the radiation much more precisely to the cancer cells avoiding as much radiation to nearby healthy cells as possible. Doses need to be high enough to kill the cancer cells. The doses are much lower than they used to be but they are still levels like 3 gray or 3,000 mSv. Chemotherapy is often used to make the cancer cells more sensitive to ionizing radiation.
“There have been many large studies on people developing cancer from radiation exposure. Scientific evidence shows that the increased risk of developing cancer occurs at exposure levels of 100 mSv or higher. However, it is worth noting that outside of radiotherapy treatments, which is the targeted use of radiation to destroy cancer cells, the risk of being exposed to radiation doses at 100 mSv or higher is extremely low.“
“For radiation exposures less than 100 mSv, the scientific evidence for increased health risk is more limited. This is because the risk of developing cancer from low radiation dose is very small compared to the overall cancer rates, which makes it very difficult to measure, even with a very large study. It is plausible that health effects could occur at levels below 100 mSv.“
These statements from ARPANSA mirror a very wide range of scientific literature I have read over many years.
The only way to pick up health effects at levels under 100mSv has been to use epidemiological approaches. Unfortunately, these studies do not always agree with each other. I have seen two camps undertake complex calculations on the same data and come to totally opposite conclusions.
The amount of radiation used in medical diagnoses is also rather high but only exceeds 100mSv when used over and over again on large area scans such as whole body CT scans. Again the amount of radiation used has dropped considerably over time with new techniques as the use of targeted radiopharmaceuticals such as Technetium-99m compounds.
Since some of the earliest life appeared on Earth, living things have had the ability to repair radiation damage. More on this topic in future blogs.
Some areas of the world have much higher background levels, some patches being one hundred times higher than the world average. In general terms, multiple studies have suggested that long term residents of these higher background areas do not suffer from higher rates of cancer or heart disease. They may even develop extra protective measures. I will provide more information on this topic some of which can be controversial, in later blogs.
Background Radiation Dose Rate in mSv/day. Graph by Jack Devaney
Not all background data is easily available in mSv. Some interesting facts may be shown in other units such as grays. For X-rays, gamma rays and beta emitters, the gray is numerically the same value when expressed in sieverts, but for alpha particles one gray is equivalent to 20 sieverts, as a radiation weighting factor is applied accordingly. Alpha particles are easy to stop but once in the body, they inflict more damage.
When radiation is measured using instruments like a geiger counter, the unit is becquerels (Bq). One becquerel is equal to one nuclear decay per second. Conversions from becquerels to mSv can be done accurately for a single radionuclide but mixtures are very complex. For reference to the figure below, there are one thousand trillion becquerels in a Petabequerel, an almost unimaginable number. The overall message is clear. Human influence on background levels is small. As large as the effect of the dreadful nuclear bomb testing was, it is relatively tiny fraction of the total and diminishes every year.
I first saw this posted by Robert Hargraves and again recently on a post by Oscar L Martin on LinkedIn.
Natural Uranium is More Hazardous as a Heavy Metal Than as a Radioactive Substance. This blog has had its titles rearranged to make the content clearer. It was posted over the Christmas period and deserves more scrutiny.
Why Do We Fear Radiation? 4
Based on health considerations, the concentration of uranium in drinking water should not exceed the health-based guideline value of 0.02 mg/L. This health-based guideline value is based on chemical toxicity. The chemical toxicity of uranium is more restrictive than its radiological toxicity. – Australian Drinking Water Guidelines (ADWG).
Uranium in the Environment
Uranium is naturally present in the environment as a result of leaching from soils, rocks and natural deposits. It can also be released from mining and mill tailings, from the combustion of coal and other fuels, and from the production or use of phosphate fertilizers (which can contain as much as 150 mg/kg uranium).
Food is the major source of uranium intake and the highest concentrations are typically found in shellfish (UNSCEAR 2000). Dietary intake of uranium through food is estimated between 0.001 and 0.004 mg/day (WHO 2004). Intake through drinking water is normally low; however, drinking water can contribute the majority of daily intake in circumstances where uranium is present at higher concentrations in drinking water (WHO 2004).
In most Australian drinking water supplies uranium concentrations are well below 0.02 mg /L. However, concentrations up to 0.12 mg/L have been measured in some groundwater supplies in remote areas. In humans and experimental animals, the main toxic effect of short-term exposure to high concentrations of uranium is inflammation of the kidney. Little information is available on the effects of long-term exposure to low concentrations. (AWQG).
Comparison of the Chemical and Radiological Standards for Uranium
The Radiological drinking water standard for uranium in Australia is incredibly conservative. It is calculated using a maximum addition of radiation of 0.1mSv/year. This is one tenth of the already very conservative allowable extra exposure limit of 1mSv/year.
The health-based guideline value of 0.02 mg/L is equivalent to an activity concentration of 0.2Bq/L. This indicates that the health-based guideline value based on chemical toxicity is considerably more restrictive than one based on radiological data. -(AWGL)
The chemical toxicity of uranium at least 15 times more hazardous than the radiation from uranium.
The Pine Creek Geosycline
Australia is rich in uranium deposits in a number of geological formations. The Pine Creek Geosyncline covers a large part of the Northern Territory and has many major uranium deposits. In the early part of this millenium, I managed a travelling monitoring team as a regulator for mining in the NT. Consequently, I saw data from rivers and streams all over the Pine Creek Geosyncline. Often the lowest levels of uranium measured were downstream of Ranger and Jabiluka uranium mines.
It is too easy to blame radiation from substances that do emit radiation for any “sickness”. I remember one instance when Aboriginals that lived not far downstream of Ranger mine were all becoming ill. Investigation showed the illness to result from faecal bacteria in the billabong. Work undertaken to prevent raw sewage entering the billabong led to a rapid cure.
Remote Community Sues NT Government for Compensation
In 2018, the government-owned utility company Power and Water Corporation (PWC) found that the drinking water in Laramba contained 0.046 milligrams of uranium per litre (mg/L), which was more than twice the recommended level. The community had known about problems with the water supply since at least 2008, but the scale of the issue was not revealed until 2018. A new water treatment plant using ion-exchange technology was opened in 2023, making the uranium almost undetectable. https://www.abc.net.au/news/2023-04-30/water-treatment-plant-opens-in-remote-laramba
The Laramba community celebrates their new water supply which ensures uranium levels are extremely low. (ABC Alice Springs: Charmayne Allison)
The Northern Territory’s Court of Appeal on Friday 29 November heard arguments from lawyers representing the Territory government and the residents of Laramba, a town of just more than 200 people 205km northwest of Alice Springs. It was the latest instalment in a five-year legal battle, which could continue beyond this court’s eventual decision. The court case centres on whether the NT government, as landlord to the Laramba residents, should be responsible for the quality of the drinking water.
“The case continues, because we say our clients were forced to drink that water for over 10 years so they should be entitled to some compensation,”
“But more importantly, we want to establish the point that the government in remote communities has an obligation to provide people with safe water.”
Nowhere in the press reports I read, was it clarified that the uranium level was a chemical toxicity issue and not a radiological one. This builds unnecessary fear of radiation in both Aboriginal communities and the general public.
How did you go with my question at the end of the last blog? I am about to hand you a kilogram of a radioactive substance. I have 2 choices. One has a very short half-life and one has an extremely long half-life. Which one is the safest?
The radioactive substance with the short half-life is very dangerous. It has a short half-life because it is decaying quickly and sending out a lot of energy and particles. The substance with a long half-life decays very slowly and may even be safe to hold with very little protection. As a teenager, I held a bar of uranium in my bare hands during a special visit to Lucas Heights. These days they would insist on gloves. In the fifties, Queen Elizabeth II was given a plastic bag containing a large amount of plutonium to hold during her visit to Sellafield.
What implications does this insight have when considering nuclear waste management?
Here is Dr Don Lincoln describing more about radiation.
When discussing the levels of radiation experienced on Earth except in exceptional circumstances, I find it easier to understand if the units are in millisieverts or a thousandth of a sievert.
Don’s Examples of Radiation Levels Expressed as mSv per Year
Woodchopper in woods USA 3 City Dweller with medical tests USA 6 Just from your own body 0.4 Plane trip across the Atlantic 0.025 Whole body CT Scan 10 Nuclear worker maximum allowed 50 Cancer risk starts 100 Radiation sickness 400 Severe radiation poisoning 2000 Usually kills but may survive with medical care 4000 Death certain 8000
The first 6 items in the table are all examples from the USA. Background radiation levels around the world vary enormously as my next blog illustrates.
How much do you know about nuclear radiation? Here is an opportunity to learn about it in an easy manner. Many of you will know far more about radiation than shown here. However, you too can enjoy these great video segments.
Yes, Earth is a radioactive planet. But just how radioactive is the zone in which we live? Is it dangerous and harmful? And if it is, when is it harmful? In order to really examine these questions, it is important to understand the basics.
There are lots of units used in the nuclear radiation field and it is important to understand what these units mean. Scientists have become very clever at measuring extremely low levels of everything from chemicals to radiation . Just because something can be measured does not tell us whether something is harmful to life or critical for its existence .
In order to illustrate some basic concepts and the language used, I am showing some parts of a few video presentations which describe these concepts in a clear manner in this blog and the next. Each video segment is about 6 minutes long. The full videos are available on YouTube
What is Radiation by the Canadian Nuclear Safety Commission.
Types of Radiation by Dr Don Lincoln of Fermilab 2017
Is Radiation Dangerous by Dr Don Lincoln of Fermilab 2017
Enough for today! Each new blog will provide more information such as the variability of background radiation on our planet.
But before you go, I would like you to consider the following question. I am about to hand you a kilogram of a radioactive substance. I have 2 choices. One has a very short half-life and one has an extremely long half-life. Which one is the safest?
Earth is made of Stardust –We live on a Radioactive Planet, a Nuclear Planet
Every element in the Universe was made by nuclear reactions in stars.
When stars age, they break apart and form stardust.
Gravity combined this dust to make solar systems of planets.
The core of our planet is radioactive and provides us with a warmer planet surface and a magnetic field.
For A Planet to Generate Its Own Magnetic Field by the Geodynamo Process – It Must Have the Following Characteristics
The planet must rotate fast enough.
Its interior must have a fluid medium.
The interior medium must have the ability to conduct electricity.
The core must have an internal source of energy that propels convection currents in the liquid medium.
On Earth where does the energy come from? Radiogenic heat comes from the radioactive elements: Uranium 238,Thorium 232 and Potassium 40. All have very long half-lives.
Iron and Nickel conduct the electricity in the core.
Today, Mars does not have a global magnetic field. However, Mars did power an early dynamo that produced a strong magnetic field 4 billion years ago, comparable to Earth’s current surface field.
Without a Magnetic Field Our Atmosphere Would be Stripped Away by Solar Winds. Life on Earth Would Not be Possible.
Earth’s Magnetic Field – Our Protective Blanket Helps Shield Us From Unruly Space Weather.
According to NASA, the magnetosphere also protects Earth from large quantities of particle radiation emitted during sun storms as well as cosmic rays – atom fragments – raining down on Earth from deep space. Our magnetic field repels harmful energy away from Earth and traps it in zones called Van Allen radiation belts.
But our protective shield is not completely invincible. Cosmic rays are part of the background radiation we receive every day.
Tritium is created in our upper atmosphere every day and comes down in the rain.
None of this protection would be possible if Earth was not enough of a nuclear planet with sufficient quantities of radioactive substances.
The next two blogs in the series illustrate the basics of just what radiation actually is and provides terms necessary to understand later blogs. The third blog discusses the range of background radiation found naturally on the surface of our planet. For some readers there will be surprises in store.
The Adverse Impacts of Wind Turbine Developments on Australia’s Biodiversity and Climate
Most of our big cities are spread along the East Coast of Australia. They were sited where they are because of the environmental conditions resulting from the Great Dividing Range and its forests. We are still undervaluing these assets and underestimating the threats even as we face the ravages of climate change. In Far North Queensland our tropical rainforests and wet sclerophyll forests are now being severely threatened by wind turbine developments. There is little of this forest left. Forest is more than trees. The biodiversity is enormous. In our ignorance, yet another project has recently been passed under the EPBC Act. But it is not just the biodiversity that is lost. The forests on the ridges of the Great Dividing Range help to stabilise the local climate in many ways. Undisturbed tropical forests are usually fire resistant.
Forests play so many roles. They tie the soil together, preventing erosion and absorbing the water to form deep sponges slowing down the passage of water and cleaning it on the way. In other words, forests help to lessen the impact of floods, feed ground water and keep the area moist and cooler. While doing all these services, they sequester carbon dioxide in their wood and their roots, pouring oxygen into the atmosphere and producing food and habitat for other living creatures. Recent studies suggest that the trees on lower ranges, as we have in Australia, also help it to rain in two ways: evapotranspiration help clouds reach saturation levels and organic compounds rising from the trees seed the clouds. This becomes more and more important as temperatures rise with climate change as warmer air holds more water before it becomes saturated.
It is not enough to claim that a wind turbine development only effects the actual cleared area. Any disturbance leads to edge effects that have now been shown to penetrate as much as 3 km into adjacent tropical forests, drying out the soil and vegetation, making wide bands of land more susceptible to fire and windstorms. This leads to progressive degradation and the damage grows exponentially hot summer by hot summer. When this forest with all its diversity is gone, it is gone. It cannot be restored by replanting a few trees. Rainfall comes less often but when it does rain, the amount is increased with bigger drops. Flooding and soil erosion can become massive.
Carbon Dioxide
Australia is the driest continent on Earth. Like every other nation on earth, we will be affected by climate change. We certainly don’t like the idea of becoming hotter and drier in the future. When I look at the data on global carbon dioxide levels and rising temperatures, I see that we are not winning the so-called war on carbon dioxide levels despite the amount of wind and solar projects being built around the world and the trillions of dollars already spent.
Despite many dire predictions, the Earth’s natural systems are still doing most of the heavy lifting. It is hard to comprehend that we humans, one of the most successful species to have evolved on our planet is unbalancing a range of natural systems on which our very existence depends. If we wish to leave a liveable planet to our children and grandchildren, we need to consider all the components that are threatening our natural systems. When we speak of saving the climate, it’s really the Holocene climate we are trying to save, and the biological richness holding it up.
In our haste to save the climate we have separated two of the important dynamics that affect carbon dioxide levels. In the race to replace fossil fuels with “renewables”, we seem to be overlooking other large factors. Well over a decade ago, the Australian Government funded a project to really look at the big picture to determine just what should be done. How should our money and resources best be spent mitigating climate change? The images below illustrate the situation both globally and in Australia.
Source: Global Carbon Project – the numbers are in billions of tons of carbon dioxide per year averaged between 2010 and 2019.
The arrows show the major fluxes. So, fossil fuels and industry produced 34.4 billion tons per year (Pg CO2/yr) while land use change emitted 5.7 for a total carbon dioxide source of 40.1 billion tons CO2/yr.
The land sink is 12.5 billion tons of CO2 per year and the ocean absorbs 9.2 making a total sink of 21.7 billion tons of carbon dioxide per year. The data shows that natural systems were removing more than half of anthropogenic (man-made) carbon dioxide between 2010 and 2019 averaged over this period. It has continued to do this enormous task for the last 60 years on a proportionate basis. The sections of the United Nations that look at this side of the equation have reiterated this information for many years.
Source: Global Carbon Project – the numbers are in millions of tons of carbon dioxide per year averaged between 2010 and 2019. (Note that the units are millions of tons of carbon dioxide per year.)
Look at the impact of FIRE! It had a much larger impact than our electricity production.
Australia only produced 0.12% of the net emissions of the world and we were nearly carbon dioxide neutral from 2010 to 2019 while the sequestration by ocean was not even counted!
If only it were that simple. We are a small nation but we emit 1% of the world’s carbon dioxide from fossil fuels and industry. Add our emissions from bushfires and that doubles our emissions to 2 %. BUT our wonderful land sequestered most of this , bringing our overall emissions down to .1%. How much longer can the natural world help us if we continue to chop down trees and let fires burn? Both decisions dry out our soil and the consequences compound.
What about our coal and gas exports? The reality is that we are buying our wind turbines and solar systems and batteries and EV cars from overseas, some parts of which have been manufactured using energy from fossil fuels, possibly even our coal. Simplistically, one could suggest that Australia’s transition to renewables is actually bad for climate change mitigation. Particularly so when we destroy Nature’s system of carbon sequestration when installing wind turbines on ridges in forested areas.
Elevation doesn’t offer protection from heat in Western Australia. Neither does it correspond with rainfall despite the nightly impression we see on the TV weather maps of clouds passing from North West to South East over our continent.
It is no surprise that most Australians live close to the Great Dividing Range in Eastern Australia.
As compared to rainfall in Australia where are our remaining forests?
Forests in Australia
Distribution of Australia’s Forest Types 2018
In 2019, Australia had a total of 134 million hectares of forest, which is equivalent to 17% of Australia’s land area. Australia had about 3% of the world’s forest area, and globally is the country with the seventh largest forest area.
Most of Australia’s forests are native forests and these native forests are often divided into three classes based on their crown cover and three classes based on mature tree height. Crown cover is the area of ground covered by tree canopies, ignoring any overlaps and gaps.
Less than a third of our forests are reasonably dense with more than 50% canopy cover. Rainforest is nearly three quarters closed canopy and of medium height.
Rainforest
Well over half of Australia’s rainforest is in Queensland. Australia has 3.6 million hectares of the rainforest native forest type, which is 2.7% of Australia’s total forest area. Half of this is protected in nature conservation reserves with 2 million hectare belonging to Queensland.
Australia’s rainforests are typically characterised by high rainfall, lush growth and closed canopies. They rarely experience fire. However, currently planned renewable energy projects will change this dramatically. Recent studies undertaken in the Amazon and Brazil show that fragmentation dries out the soil and the forest for up to 3 km from the cleared area making the rainforest much more prone to both bushfire and wind storm damage. This damage extends further and further into the forest with each event. It has been shown in China that wind turbines act as giant fans leading to extra drying. These same mechanisms apply to other forest types as well. Eucalypt forests can recover from fire if given the chance to do so. Studies in Indonesia and the Amazon indicate that this is not the case for tropical rainforests. Fire and wind storms do not recognise boundaries between conservation zones and private land. Our World Heritage Areas have no special protection from fire and edge effects resulting from clearing on nearby land.
Distribution of the Rainforest Native Forest Type 2018
Rainforests are very important for the conservation of biodiversity. They provide habitat for many forest-dwelling and forest-dependent species of plants and animals. This includes numerous species that are endemic to Australia, and species listed as threatened under the Commonwealth Environment Protection and Biodiversity Conservation Act 1999.
Rainforest comprises only 2.7% of Australia’s total native forest, but provides habitat for 60% of Australia’s plant species, 60% of butterfly species, 40% of bird species and 35% of mammal species.
One third of Australia’s rainforests lie within UNESCO World Heritage Areas. The World Heritage Wet Tropical Forest clusters around Cairns. The IUCN nominated this forest as the second most important natural area in the world. At the time of its listing, it was noted that the forest was partially degraded and that every effort should be made to link the various sectors together.
Recent studies have indicated that wet forests including wet sclerophyll forests help to cool the temperature of Earth down and will continue to do so as temperatures rise unlike other forest types.
The albedo effect of forests, because they are darker and absorb more light energy, causes warming. This is counteracted in tropical wet forests due to the greater extent of cooling caused by evapotranspiration from their leaves. The UN has estimated that that the overall worldwide cooling effect may be as much as 1 degree Centigrade.
Eucalypts
Three quarters of Australia’s total forest area is dominated by Eucalypt forest.
Distribution of Eucalypt Native Forest 2018
Please note that the denser eucalypt forest in Queensland lies just west of the wet tropical forests clustered around Cairns. The other main zone lies to the south of Emerald and Rockhampton. While some of the denser forest are protected as National Parks and Forest Reserves, nearly 90% of the eucalypt forest in Queensland is either leasehold or privately owned. Much of it is the open woodland forest type and is often used for cattle grazing.
The Hydrological Cycle, Clouds, Mountains and Rain
The Great Dividing Range consists of a complex of mountain ranges, plateaus, upland areas and escarpments. A very simplistic view of the rainfall is that moisture laden air brought in by the trade winds rises up the sides of the Range and the moisture condenses in the higher cooler air and down it comes as rain (orographic rain). A rain shadow can then form on the other side of the Range. However, our peaks are not very high. An increasing number of studies hypothesise that the clouds form and are seeded as the result of organic compounds rising from trees on the mountain ridges. It has also been suggested that additional moisture needs to be added to the air from land evaporation and tree evapotranspiration before critical moisture levels are reached and it rains.
Currently there are over 60 renewable energy projects planned for the Great Dividing Range between Cairns and Brisbane most of them in our precious remaining forest. Steve video ref Far too many of them require clearing for access roads and blasting of the mountain tops to catch the best winds available. Queensland’s wind resources are not wonderful as recorded daily by current operating wind turbines. Their placement is understandable from the project proponents’ viewpoints as this is where access to transmission lines and the QLD Renewable Energy Zones were placed. BUT what are the consequences.
Do we know? Current climate models do not take all these details into account. One thing is certain that as temperatures rise the air can hold more moisture. Two things can happen as a result. It is harder for moisture to condense and rain to fall. BUT when it does rain, the volume and intensity of the rain will be much greater.
Forests play many roles. They tie the soil together, preventing erosion and absorbing the water to form deep sponges slowing down the passage of water and cleaning it on the way. In other words, forests help to lessen the impact of floods, feed ground water and keep the area moist and cooler. While doing all these services, they sequester carbon dioxide in their wood and their roots, pouring oxygen into the atmosphere and producing food and nice places for other living creatures.
So, if instead we put wind turbines on the mountain ridges, we dry out the soil and the nearby forest, increase the temperature, affect rainfall patterns, decrease carbon sequestration, increase bushfire intensity and occurrence, destroy biodiversity, waste lots of rare resources while making unreliable energy, killing our remaining manufacturing and businesses while costing our nation a fortune which will have to be repeated again before 2050. In the meantime, China has discovered that it is possible to lower urban temperatures by planting a forest around their cities.
It would be nice to believe that fragmenting the remaining forests would not do too much damage. This is not the case. It is absolutely critical that our northern forests are left intact. Thousands of recent ecological and forestry studies show that we are reaching a tipping point of tropical forest survival. Death by a thousand cuts? No just a few more may well be enough. So many species are on the edge. No, we don’t have every answer or absolute proof. By the time it is available it will be too late.
Why are we risking Australia’s future on a poorly thought out strategy.
Last Tuesday representatives from 116 regional community groups from far north Queensland to southern Victoria travelled to Canberra for the Reckless Renewables Rally. The press either ignored them or made fun of them; called them selfish or victims of misinformation by their local members. These were people who already have wind turbines, solar farms, and transmission lines next door. They care about climate change and our natural environment which is currently sequestering as much carbon dioxide as Australia produces. They feed not only Australians but many other peoples around the world as well. They watch while our forests are being made more fire prone, and our best agricultural soils are being lost. Our regional farmers are receiving 1970 prices for their produce while the big companies are making record profits.
Perhaps it’s time to listen.
I have enclosed a copy of their flyer which lists the wide range of entities involved.
Burning coal to produce electricity is a terrible waste when coal has so many other important uses. At this time, the energy from it is still essential for the manufacture of wind turbines, transmission lines and solar panels.
It is not always realised that coal is needed:
as a source of essential ingredients for the manufacture of many dyes, pharmaceuticals, explosives, perfumes, plastics, paints and photographic materials; and
to produce the very high temperatures needed to manufacture steel, cement, aluminium, bricks, glass and some metals and chemicals.
Latrobe Valley, Victoria, Australia
A few weeks ago, David and I attended a conference in the Latrobe Valley held by CRC TiME called “Bridging Diverse Interests”. https://crctime.com.au/ When a coal mine or any mine is closed down, a complex rehabilitation process follows. Delegates at the conference had the opportunity to visit both Hazelwood and Yallourn brown coal mine and power station sites.
The Latrobe Valley mines are large, close together, close to local communities and infrastructure. The power stations have a small footprint on each mine site. Mine Land Rehabilitation Authority
Hazelwood Power Station and its associated coal mine stopped operating in 2017. The owner, French company Engie plans to spend a billion dollars rehabilitating the mine site by filling the giant mining pit with water. The volume needed will be greater than that of Sydney Harbour. The plan is still under discussion by many stakeholders. We heard from some of the community groups about their hopes for the site. The closure has already had a big impact on local townships and the staff who lost their jobs. Three years after the closure, a survey found these highly skilled workers were still only earning an average of 50 % of the income received prior to the closure. Questions remain about the feasibility of the rehabilitation plan. Enough water may not be available and contaminant levels in the ash have been highlighted by a green group as a possible long-term issue.
Yallourn Power Station – photo by David Jones
Yallourn is scheduled to close in 2028. River water, currently used by the power station for cooling, will be used to fill the pit. It will take decades. The ground is soft, like the brown coal itself, and collapse of the sides of the pit must be carefully avoided. The ash is low in contaminants and should not pose a problem with water quality. Often there is disparity between the requirements of the regulators, the local community, the First Nations People and the technical and economic considerations of the miners. Just because the community desires a certain outcome, it may not be technically possible and safe.
Yallourn Coal Mine: the coal seam is 80 metres thick and can be seen in the background. Lines of trees have been planted in the bottom of the pit. Photo by David Jones
The third power station, Loy Yang, and its associated mine is also scheduled for closure in 2035 bu.
What is the future of the Latrobe Valley? Will it be left with lots of orphaned transmission lines and closed businesses, medical facilities and schools? This will happen unless viable solutions developed in consultation with regional communities are identified and implemented. It has been suggested in other forums that coal-fired power stations could be replaced by nuclear power stations thus making use of these industrial sites and transmission infrastructure, while providing similar jobs for the already skilled workforce. Participants I spoke to from other places in Australia were pro-nuclear but locals were wary. The social licence was not there because of a historical distrust of Government processes. Technically the sites would need to be evaluated for ground stability.
A central theme of the conference was that First Nations People should be properly and fully involved early in the process of planning mine closure.
Mining Rehabilitation
The NT Government is working in partnership with the Australian Government and Traditional Owners to rehabilitate the former Rum Jungle Uranium Mine Site. Early rehabilitation work was undertaken in the 80s and the traditional owner groups were not involved in the process. The site does not meet today’s standards. The current project will remove a major impediment to the site’s return in good order to the Kungarakan and Warai people.
The inspirational project leader, Jackie Hartnett of NT Government, gave an insightful presentation on the project. She has worked hard to find solutions acceptable to all the traditional owners with the tremendous assistance of Gowan Bush, the community manager. Jackie is undertaking the rehabilitation work by training and employing the local people. As a mother myself, I noted that a female birthing site will be restored by sending a stream back to its original path. Nobody knows whether this will be fully successful but the women are delighted.
My husband Dr. David Jones gave a technical presentation on the Rum Jungle Rehabilitation Project on behalf of NT Government as an Industry Fellow of UQ Sustainable Minerals Institute. https://smi.uq.edu.au/ It is noteworthy that the main source of environmental problems on the site is acid mine drainage with copper levels causing the issues rather than uranium or radioactivity.
The presentations were praised by the head of INAP as a new paradigm for mine rehabilitation. INAP stands for International Network for Acid Prevention and is an organisation set up by the mining industry itself to find, promulgate, and use the best methods of preventing and coping with acid and metalliferous drainage (AMD). AMD can occur with any type of mine depending on the geology of the area.
“AMD is one of the most serious and potentially enduring environmental problems for the mining industry. Left unchecked, it can result in such long-term water quality impacts that could well be this industry’s most harmful legacy.” https://www.inap.com.au/
How do we use coal apart from making electricity?
China uses the most coal in the world with the U.S and India in a distant second place. The U.S. has 2/3 of the world’s known supply. Australia only mines 4% of the world’s coal but we export 80% of it, making Australia the second largest coal exporter in the world. We export low sulfur bituminous coal for energy production used to manufacture “renewable energy infrastructure” and the highly valued and rarer metallurgical coal, also known as coking coal, to produce steel and cement and critical metals and other ingredients.
There are 4 main types of coal and the world still has 400 years’ supply at our current rate of use.
Peat is the youngest form of coal. It is low quality and is burnt for fuel and heating on a small scale or even used as a soil conditioner by gardeners.
Lignite or Brown Coal is about 150 million years old. It has about 50% carbon and low sulfur content. It is used to produce electricity but is relatively inefficient because it has a high water content and must be dried first. This results in the highest amount of carbon dioxide per unit of electricity produced. The Latrobe Valley Coal mines produce brown coal.
Bituminous Coal has a high carbon content ( 50-80%) but often has a high sulfur content. It is the most plentiful type of coal in the U.S. and is about 300 million years old. Sub-bituminous coal has a lower sulfur content and carbon content and is a little younger. Sub-bituminous coal is the preferred form for power plants.
Anthracite, often known as Metallurgical Coal. is the highest quality of coal with a high carbon (95%) but low sulfur content and is about 500 million years old. Australia has large supplies of this form of coal which is valued for all its uses apart from electricity production. There is limited supply worldwide and it almost a sin to burn it up to produce electricity. It is the hardest and cleanest burning coal.
Anthracite is valuable
· as a source of essential ingredients for the manufacture of many dyes, pharmaceuticals, explosives, perfumes, plastics, paints and photographic materials; and
· to produce the very high temperatures needed to produce steel, cement, aluminium, bricks, glass and some metals and chemicals. The carbon in anthracite forms part of the matrix of steel.
· It is used in smelting operations to release metals such as lithium from their ores – a very energy intensive process.
Coal pyrolysis, or destructive distillation, is an old technology that started on a commercial scale during the industrial revolution. When coal is burnt without the presence of oxygen, three main products result: coal gas; coal tar; and coke.
Coal tar is the actual source of the essential ingredients to make many products such as some dyes, pharmaceuticals, explosives, perfumes, plastics, paints and photographic materials.
Various forms of gas can substitute for some of coal’s uses. It can act to stabilise the electricity grid much more efficiently and produces far less carbon dioxide per unit of electricity produced.
Hydrogen and some types of nuclear power may be able replace the high temperatures produced by coal and gas as the technologies mature. The production and use of hydrogen is a very energy inefficient.
What about Oil? Why Can’t We Stop It’s Use Tomorrow?
Nearly half of a barrel of oil is separated as gasoline/petrol. Slightly more than half is used as feedstock in the manufacture of more than 6000 products. I found a list of 144 of them. Just taking one item, combs. Can you imagine making combs the old way from turtle shell or bone? The world’s population has grown so much it is hard to imagine doing without many of the items listed below. And what do we plan to do with all the waste stream of petrol in the future?
Can we face a world without antibiotics and anaesthetics or hospitals? Imagine there are no building materials except wood or mud or straw, no fertilizers or pillows or candles or ink and no forests or wildlife. We still need coal and oil to produce electric cars.
We have a lot of thinking and planning to do. Imagine a world without any:
This is a particularly important blog for Australians. It is time we learnt about our land and just what happens in Australia.
Earth Systems and Climate Change Hub provided a big red flag and some fascinating insights into Australia’s total carbon budget from 2010 to 2019. The ESCC Hub is funded by the Australian Government’s National Environmental Science Program and feeds data into the international entity the Global Carbon Project. Carbon budgets provide information and data to inform and raise awareness about how the world is tracking against the global climate change mitigation challenge.https://nespclimate.com.au/wp-content/uploads/2021/06/ESCC_Global-and-regional-carbon-budgets_Brochure.pdf
Good News: Australia was almost carbon neutral for the ten years from 2010 to 2019.
We only emitted 0.1% of the carbon dioxide added to the atmosphere worldwide over that 10-year period. It is our wonderful natural land that acted as a giant carbon sink squirrelling away almost all the carbon dioxide we produced. The situation varies from year to year depending on weather conditions and our actions.
Yes, we can save our biodiversity and do our bit to fight climate change at the same time. Indeed, we must do so.
Bad News: bushfires produced half the carbon dioxide.
In many parts of Australia, when bushfires start, we simply let them burn. Most firefighting is done by an ageing voluntary fire service with little equipment and even this equipment is old and often no longer safe.
Work undertaken, particularly in the Northern Territory, shows that traditional fire management practices work well to reduce emissions. Indeed, our First Nations People earn carbon credits using their traditional cultural practices. Using properly timed cool burning techniques, the carbon dioxide produced by fire is greatly diminished. If these practices were used more widely, great savings could be made in the loss of human life, property, and biodiversity. Indeed, scientific studies have shown that biodiversity can even be improved.
As the climate gets hotter, the potential damage done by bushfire in Australia will increase dramatically unless we do all we can to protect our land from fire and fight fires quickly and effectively when they do start. It has already been shown that access to water bombing helicopters can result in fire being stopped very quickly. Timing is critical – the sooner a fire is reached, and action taken, the less the damage. Satellites can now provide the necessary information in real time.
A First Nations man told me recently that Australia spends less than 5% on fire management and 95% paying for the damage afterwards. He wanted to know why we had it so backwards.
We are spending billions of dollars to reduce the emission of carbon dioxide when we produce electricity. Yet, fire releases far more carbon dioxide and has the potential to become much worse. If we stay on our current pathway, we will destroy the ability of our land to be a carbon sink.
Worldwide, natural systems on both land and sea still sequester over half the world’s production of carbon dioxide each year. But there are signs of this slowing. So far, as we have produced more carbon dioxide each year, the natural systems have kept up. We need to be helping natural systems as much as we can, and this is particularly important in Australia. Worldwide, the oceans do half of the work and land systems the other half. But in Australia, our natural land-based systems can sequester all of our carbon dioxide.
Figure: The Australian carbon budget, including natural and human-caused CO2 sources and sinks (and their net effect in the atmosphere). Annual fluxes are the average for the 2010-2019 decade. Units are in million tons of CO2.
What should we do with the resources we have?
Upgrade our fire fighting ability with quicker, scientifically backed fire fighting techniques. A stitch in time saves nine and saves lots of human lives and property, carbon emissions PLUS our precious BIODIVERSITY.
Use the best sources of energy. Ask: Which power systems impact the least land area, are low carbon, use the least materials in their manufacture, and can be used to make steel and bricks and cement?
Australia is dotted with pit lakes from mining activities. Many of these pit lakes may be suitable as a source of water for water bombing in regional areas.
Here are 8 good reasons. Most of this post comes from a simple pamphlet I recently put together.
Nuclear Saves Habitat, Jobs and Farming Land
We could be replacing coal-fired power stations with Nuclear Power on the dirty old coal sites. A high proportion of the skilled workforce could be retained with decent salaries. Current transmission infrastructure would replace the need to build new transmission lines, saving money, resources such as copper while saving even more habitat and our best food producing soils.It is our land and its habitat that is sequestering most of the carbon dioxide that Australia produces. See my 2 previous blogs for more information.
2. Nuclear Power is a Low Carbon Energy Source
3. Nuclear Power is Safe
Nuclear activity and its ionising radiation are part of the natural world and were there when life began. Biology had to learn how to live safely with low and moderate levels of radiation. Otherwise, it would not have survived. The problem is with neither the physics nor the biology but with ourselves. While like all animals we are naturally protected and have no need to worry about immersion in moderate radiation, we have learned how to build instruments and make measurements that scare us. We put regulations in place that are designed to protect us from risks that nature has already covered.- Wade Allison Nov 2023
The Cellular Changes Needed To Initiate Cancer Have Not Been Observed at Low Dose Rates. At least 6 to 8 of specific cellular changes must occur for cancer to result. The “Hit Theory” of DNA mutation as a cause of cancer is way out of date and not applicable.
4. Nuclear Waste is the Power Source of the Future
We do know how to bury it safely for ever – Nature has shown us how and some countries are doing so now. BUT, what a waste!
5. Materials Needed to Manufacture Power Systems
The metals used in solar and wind power and transmission lines are becoming scarcer. It takes more than a decade to open up a new mine but we do not even have enough mineral resources to build the first generation of renewables. Recycling is very energy inefficient.
Recent evaluations of all the materials needed for the Energy Transition indicate a shortage of many materials. We do not even have sufficient minerals in the ground- Simon Michaux. We must be careful with all the resources we have whether minerals, money, or biodiversity. We must never forget how much nature is doing to look after us.
6. We Need to Decarbonise More Sectors Than Just Electricity
7. The Energy Produced from a Power System Compared to the Energy Used to Produce that Power System
Until a solar farm can produce enough energy to make itself again, it shouldn’t be called renewable. If it takes too much energy to make and use a power source, it is not a viable long-term solution. Most calculations of money or energy costs do not include all of the system costs.
Why does Nuclear Power have such a high EROI? ANSWER: Because of the orders of magnitude higher energy density of the fuels it can use such as uranium and thorium.
8. The Future
When should Australia introduce nuclear energy? Are we Australians ready yet? The false fear of radiation has even slowed our ability to even look after our low dose waste from research facilities and hospitals to a ridiculous extent. Most of the cost and time delays that effect the building of nuclear power plants around the world do not arise from the reactor itself but from ordinary engineering works. Australia’s recent history with big infrastructure projects including Snowy 2.0 is not impressive. It seems many big projects have very big cost and time overruns.
However, the first stage of the process will take time that we shouldn’t waste. Stage One involves removing the current bans both nationally and state by state. By the time we finish this first stage, we will be in a better position to judge what to build and purchase.
Wish to learn more? See early posts and become a subscriber.
While we are stressing trying to make our electricity production low carbon, we are overlooking the impact of fire. Dozens, if not hundreds of scientists around the world are doing their best to measure carbon fluxes. It is easy to get lost looking at all the detail and miss the big picture. Some years Australia is a net carbon dioxide sink, some years we are a small net producer of carbon dioxide. It all depends on our bush fire frequency and intensity plus the rainfall patterns and soil moisture levels in any particular year. Looking at the data illustrated in my last blog, Australia only emitted 0.1% of the carbon dioxide emitted to the atmosphere from 2010 to 2019. Nature is doing all the hard work for us. But our record for protecting our natural landscape and our biodiversity could be much better.
Even WORLDWIDE nature is removing over half the carbon we produce. Both Land and Sea are doing the work in so many different ways.
Yet all over the world, climate change policies result in billions of dollars being spent on new infrastructure that has not reduced carbon dioxide emissions nearly enough. Are we spending our resources wisely?
Here is a reminder of Australia’s carbon budget from 2010 to 2019 shown in millions of tons of carbon dioxide per year.
The carbon dioxide emitted by fire is almost equal to the emissions from fossil fuels and over half of our land sinks. One has to ask where we would get the best value for dollars spent. We are at a crossroads, if we do not improve our fire prevention we face a future with horrific bushfires, losing more and more lives, property, and livelihoods while killing off Nature’s ability to help us. The cartoon below illustrates what could be Australia’s future in a somewhat sarcastic manner if we don’t start thinking smarter.
What should we do with the resources we have?
Upgrade our fire fighting ability with quicker, scientifically backed fire fighting techniques. A stitch in time saves nine and saves lots of human lives and property, carbon emissions PLUS our precious BIODIVERSITY.
Use the best sources of energy.
I am not any sort of expert on fires, but I see so many wonderful articles on the web from firemen, scientists, and indigenous experts that need to be heeded. Economically, we spend 3% on protection and 97% after disasters happen. If we keep doing what we do now, our carbon emissions will be huge. Our land could become unlivable.
Australia currently depends on our Rural Fire Brigades, volunteers who put their lives at risk with outdated and insufficient equipment.
This year up where I live in Far North Queensland, the undergrowth stayed too wet for cool burns until later in the year. When the undergrowth was just right, a total fire ban was put in place by those 2,000 km away. The result: few cool burns and later, lots of rampaging fires because the fuel load was too high. This has thoroughly frustrated our local fire fighters.
Indigenous fire systems work well in parts of Australia. We need to learn from our Indigenous people use their skill and knowledge far more. It is so much cheaper to prevent fires than to pay for all the damage later.
Modern satellite monitoring can really assist if the information reaches the right people very quickly. Most fires start from lightening strikes when conditions are dry. We can pinpoint them quickly now. What we need is the ability to reach these fires fast and put them out as quickly as possible.
In the process of researching information for this blog, I have learnt a lot that surprised me. My final conclusions are that we need to be concentrating on 2 things in Australia:
Helping nature to do its work in every way we can.
Using nuclear power for energy production.
Know the Enemy
It always helps to know the enemy as best we can when planning the strategy for any fight. It increases our chances of success and reduces costs to ourselves or things we value. When we plan strategies for dealing with “Climate Change”, we really need to understand the big picture or we risk wasting all our resources fiddling around the edges. Many countries around the world are spending or planning to spend trillions of dollars and so far there has been no global reduction of carbon dioxide emissions to our atmosphere. Meanwhile Nature is being trashed with the survival of more and more species being threatened every year that passes. The threat of food and water shortages is leading to a very unstable world politically as climate refugees try to survive.
Our ability to measure carbon budgets has improved with time. The recent uses of satellite data and AI systems are impressive.
This blog begins by presenting text and diagrams from the Earth Systems and Climate Change Hub https://nespclimate.com.au/wp-content/uploads/2021/06/ESCC_Global-and-regional-carbon-budgets_Brochure.pdf The ESCC Hub is funded by the Australian Government’s National Environmental Science Program. To learn a lot more about their activities, visit https://nespclimate.com.au/ The ESCC Hub feeds data into the international entity the Global Carbon Project. Their diagrams are simpler than those I gave in my last blog but the data is very similar even though the units used are different. I suggest that readers take the time to look closely at the diagrams in this blog.
Tracking emissions of carbon dioxide over time through carbon budgets allows us to quantify and explain how human activities and natural processes add to and subtract emissions from the atmosphere. This can help to identify where the biggest opportunities for mitigation exist, and how carbon-climate feedbacks might help or hinder efforts to achieve global targets for reducing greenhouse gas emissions.
Carbon budgets track sources and sinks of carbon dioxide and their transfer between the atmosphere, ocean and land.
The Global Carbon Dioxide Budget
I start with the Global budget so it can be compared with the unique features of Australia’s carbon budget.
Source: Global Carbon Project – the numbers are in billions of tons of carbon dioxide per year averaged between 2010 and 2019.
The arrows show the major fluxes. So, fossil fuels and industry produce 34.4 billion tons per year (Pg CO2/yr) while land use change emits 5.7 for a total carbon dioxide source of 40.1 billion tons CO2/yr.
The land sink is 12.5 billion tons of CO2 per year and the ocean absorbs 9.2 making a total sink of 21.7 billion tons of carbon dioxide per year. Again, the data shows that natural systems were removing more than half of anthropogenic (man-made) carbon dioxide between 2010 and 2019 averaged over this period.
The land and ocean draw down atmospheric CO2 and act as sinks to slow the accumulation of human caused CO2 emissions, thereby slowing the progression of climate change. Combined, land and ocean sinks removed an annual average of 54 per cent of all CO2 from human activities – with land sinks removing about 31 per cent of all annual emissions and ocean sinks about 23 per cent. These natural sinks therefore play an important service in mitigating climate change.
Although CO2 has continued to accumulate in the atmosphere, the proportion of emissions removed by land and ocean sinks has remained constant over the past 60 years. This suggests that strong self-regulating feedbacks have led the sinks to increase their carbon sequestration capacity over time. However, there is large interannual variability of both the land and ocean sink strength in response to climate variability (e.g. El Niño) and extremes. This suggests likely sensitivity of the sinks to future changes in climate and variability.
Tracking land and ocean sinks and how they may change under a warming and variable climate is vital for understanding the climate change mitigation challenge faced by the international community.
Some assessments focus on the carbon cycle as it relates to carbon dioxide just like the one given above. Methane and other greenhouse gases are assessed separately. The assessments discussed in this blog are undertaken in this way. The numbers given track carbon as calculated on the weight of carbon dioxide: CO2 units. The numbers are higher by 44/12 than when data is presented in C units. That means all the numbers will be 3.66 times higher than those given in my previous blog post where the data was in C units. As long as all the numbers are in either C units or CO2 units, they are directly comparable. But I have noted assessments that mix up these units and come to erroneous conclusions. All of this blog is in CO2 units.
The Effect of Land-Use ChangesDeforestation, the main driver of land-use emissions, has remained high in the last decade. Re/afforestation has counterbalanced approximately half of the deforestation emissions.
The ocean and land sinks have continued to grow with increasing atmospheric CO2 and take about half of the emissions. Climate change is already reducing these growths by about 4% (ocean sink) and 17% (land sink). Friedlingstein et al 2022; Global Carbon Project 2022. https://www.globalcarbonproject.org/carbonbudget/22/files/GCP_CarbonBudget_2022.pdf
Land Sink removed 29% of total emissions while the Ocean Sink removed 26%.
Surprisingly, Nature still manages to remove almost 60% of our emissions BUT 2015 was a bad year globally as illustrated below due to land use change. We cannot keep destroying the land sink. It does far more for us than all the renewables have so far. A Gt is the same as a billion tons and the same as Pg.
The Australian Carbon Budget
Note that the data for Australia is in millions of tons of CO2 per year while the global data is in billions of tons of CO2 per year. Our net emission of CO2 to the atmosphere was 23 million tons per year between 2010 and 2019 on average while the global net emissions were 18.4 billion tons per year. This suggests that Australia only produced 0.12% of the net emissions and that we were nearly carbon neutral from 2010 to 2019.
If only it were that simple. What about our coal and gas exports? The reality that we are buying our wind turbines and solar systems and batteries and EV cars manufactured overseas some of which has been produced using energy from our coal. Simplistically, one could suggest that Australia’s transition to renewables is actually bad for climate change mitigation. Particularly so when we destroy natural system carbon sequestration when installing wind and solar.
Ref: ESCC Hub brochure – units are in millions of tons of carbon dioxide per year.
In Australia, our natural landscape, our natural ecosystems, removed twice as much carbon dioxide as we produced by using fossil fuels (746 to 386 million tons per year) on average for 2010 to 2019. However, this record was spoilt by fire(398). Thus, on average we fed climate change with our carbon dioxide emissions of only 23 million tons per year.
Unfortunately, Australia is a land of heat, fire and drought. 2019 was a particularly bad year. Due to drought our ecosystems were a source of carbon dioxide and not a major sink. Higher bushfire levels added to our totals. One of our major sources of carbon dioxide is fire that burns our dry tropical savanna lands over large areas. These fires are usually allowed to burn out and are not fought. For years now programs to lessen the impact of the fires has been undertaken by our indigenous peoples in the Northern Territory using “cool burns”. In bad years the CO2 from fires can negate all the carbon sequestration land-based Nature does: https://bg.copernicus.org/articles/10/851/2013/
It is our savannah lands that usually do most of the sequestration work. However, In very wet years our arid lands also remove vast quantities of carbon from the atmosphere and tie it up in soil.
Every attempt must be made to keep our land-based ecosystems photosynthesising as much as possible which will maximise carbon sequestration. This means keeping soils damp and not allowing them to heat up any more than can be helped. It means ensuring that we don’t make Australia more arid than it is now. Experiences in many countries around the world show that it is possible to help Nature help us by making arid lands wetter again. This is an enormous topic in itself and will be covered in future blogs.
How We Are Failing to Reduce Regional Climate Effects
Several classic situations exist in my current home state of Queensland.
Stupidly, we built a major transmission line along the peaks of the Great Dividing Range. This meant that Renewable Energy Project proponents wanted (needed?) to place their wind turbines and solar installations near this transmission line. This leads to the disturbance then destruction of some of our best remaining forests much earlier than might happen with Climate Change. It has been known for a long time that even narrow roads pushed through forest can change the composition of vegetation up to 100 metres on either side – edge effects. The giant wind turbines require very wide steep roads winding through the mountains, blasting of the mountain tops, direct loss of thousands of ha of forest – step by step loss of our effective land sink.
We forget that in the area near wind turbines, soil and forest dries out making fire risk much higher.
The next examples of poor planning and policy relates to solar energy. In Queensland, the big solar farms need to be turned down when there is too much electricity produced during the day. Never mind negative prices for large scale solar, operators still get their carbon credits which still makes operating them a financially attractive investment.
When the sun goes down solar energy stops. So, at night most of our power comes from coal-fired power stations which still need to run all day as they cannot ramp up from zero.
Roof top solar does a great job but subsidies have not encouraged battery storage with roof topsolar. The Australian Energy Market Operator (AEMO) has no means to control roof top solar.
The pseudo “Green” economy seems to replace some of these jobs with lower paid jobs – what someone described to me as “Toilet Jobs”. In contrast, replacing coal fired power stations with nuclear facilities would keep these skilled workers and provide even better paid positions.
Lastly, fire- fighting in most of Australia is dependent on Volunteer Rural Fire Brigades with little equipment. Should we be spending far more resources on fire mitigation? Logically, it takes a lot more effort to fight big fires than to deal with them adequately when they first start. Satellite systems and AI could be used to pinpoint fires early. Would we be better to spend all those billions of dollars on the very best fire-fighting personnel and equipment rather than imported renewables?
In conclusion, I believe we need to be concentrating on 2 things in Australia:
Helping nature to do its work in every way we can.
Mother Nature is still doing a magnificent job removing carbon dioxide from the atmosphere. Over half of the carbon dioxide, we produce from fossil fuels and other carbon intensive activities is taken up by the ocean and vegetation on the land.
The Global Carbon Budget
There are many entities around the world, doing their best to measure and calculate the earth’s carbon budget. The clearest summary I have seen so far is shown below and copied from an overview article Carbon Stocks, Fluxes and the Land Sector by Graham Diedrich February 07, 2022. https://www.canr.msu.edu/news/carbon-fluxes-and-carbon-stocks
The figure above shows global carbon stocks and fluxes. The boxes represent the stocks of carbon in its different forms, but the numbers always relate to the amount of carbon. The arrows show the movement of carbon in or out of these carbon storages. The annual carbon exchange flux is represented numerically in PgC per year units, in which 1 PgC is equal to 1 billion metric tons of carbon. Nature has stored away huge quantities of carbon over eons of time as coal, gas and oil. Even more carbon is stored in the deep ocean (37 trillion tonnes). Each year we are burning carbon so that about 7.8 billion metric tonnes of carbon join with oxygen and add to the carbon dioxide already in the atmosphere. Land use change adds even more as we desecrate forests and release carbon from soils.
Mother Nature is still doing a magnificent job removing carbon dioxide from the atmosphere. Over half of the carbon dioxide, we produce from fossil fuels and other carbon intensive activities is taken up by the ocean and vegetation on the land. The movement of carbon into the soil is very substantial but very variable and hard to measure. Note just how much carbon is stored in soil and permafrost.
Why Care About Natural Terrestrial Ecosystems
Nature provides a range of services such as:
Capturing and storing carbon.
Regulating climate – lowering the intensity of droughts and floods while stabilising temperatures.
Maintaining water balance – helping to make it rain and storing and cleaning water.
Providing biodiversity – bees to koalas to earthworms and magpies.
Creating jobs in ecotourism.
Providing resources for our use including our food.
Manufacturing soil.
Forests are particularly important not just for providing shade and storing lots of carbon, but they lower the earth’s temperature by as much as a degree. They do this through evapotranspiration, a process similar to the cooling produced by evaporative air conditioning. Some trees such as our eucalyptus also emit chemicals that trigger cloud formation providing yet more cooling effect.
A slide from one of my talks
But Australia’s natural ecosystems are at risk from:
climate change and variability – extreme heat events and droughts,
fire – carbon stored in woody vegetation is vulnerable to increased fire risk through burning under climate change,
land-use change particularly land clearing,
disturbance including invasive species, and disease.
Death of vegetation from drought stress, extreme disturbance events, disease, and pests could also result in increased carbon release to the atmosphere and changes to CO2 emissions from soils. An issue often overlooked is the release of water from soil as vegetation cover lessens. Lower soil water levels reduce the rate of photosynthesis and hence carbon removal.
Factors That Affect Nature’s Role in Reducing Carbon Dioxide in the Air
The vegetation on Earth holds a lot of carbon, somewhere between 450 and 650 billion tons of carbon (PgC). Just how much carbon is sequestered as vegetation each year is a delicate balance between photosynthesis and plant respiration and horror – wildfires or as we know them in Australia bush fires. During photosynthesis plants take up carbon dioxide and convert it to carbohydrates while releasing oxygen. During respiration plants take up oxygen and release carbon dioxide.
Lots of scientists are looking at the factors that effect the rate of photosynthesis and respiration by plants. What would it take to tip the balance in the wrong direction? What we know is that increasing carbon dioxide levels in the air are increasing photosynthesis. But far more important is the water available to plants and the temperature. There seems to be a maximum temperature for many plant species. Increasing temperature increases photosynthesis until the maximum is reached then as temperatures become even higher, photosynthesis falls away – heat stress. Droughts decrease carbon uptake by plants. Very wet years in Central Australia can result in massive increases in carbon uptake even over a short period of time. Unfortunately, plant respiration seems to continually go up as temperatures climb.
Will plants adapt to the changing conditions? It has been noted that plants in dry northern Australia recover from fire faster now and become carbon sinks again after a fire made the area a carbon source.
It is not surprising that seasonal variation is found depending on the weather. Winters are cooler. Rainfall patterns vary considerably. In Australia, there are major differences between El Nino and La Nina years. Long droughts in Australia can cause the more arid regions to become carbon sources.
Forests Buffer Thermal Fluctuation Better than Non-forests
A systematic study of thermal buffer ability (TBA) of different vegetation types showed that forests and wetlands buffer thermal fluctuation better than non-forests (grasslands, savannas, and croplands). Notably, seriously disturbed and young planted forests displayed a greatly reduced TBA as low as that of non-forests at high latitudes. Canopy height was a primary controller of TBA of forests, while the TBA of grasslands and savannas were mainly determined by energy partition, water availability, and carbon sequestration rates. Protecting mature forests is critical to mitigate thermal fluctuation under extreme events. https://www.sciencedirect.com/science/article/abs/pii/S0168192320300964?via%3Dihub
An introduction to the Australian and New Zealand flux tower network – OzFlux
OzFlux is the regional Australian and New Zealand flux tower network that aims to provide a continental-scale national research facility to monitor and assess trends, and improve predictions, of Australia’s terrestrial biosphere and climate. https://bg.copernicus.org/articles/13/5895/2016/ and https://ozflux.org.au/index.html
Many universities and other research entities form the network and the OzFlux website provides hundreds of research articles if you wish to read more detailed information. OzFlux is part of a worldwide network FLEXNET.
Studies in Australia are measuring factors that effect photosynthesis and respiration, the effect of fires and other stressors. The earliest measurements were made two decades ago. Since then, lots more monitoring points have been added and some removed. The monitoring data collected by OzFlex and FLEXNET is used to calculate and understand the factors increasing carbon dioxide in the air to work out the best strategies to adopt to climate change and mitigate it. OzFlex has helped us to understand the major roles the savanna lands and arid desert play in Australia’s carbon balance.
The Protection of Our Ecosystems is Our Most Important Action
We must do everything we can to slow the loss of natural vegetation in Australia. Otherwise, we face a future where our carbon sinks become carbon sources and Australia becomes one of the hottest places on Earth.
Regional climate protection is in our hands. Global Climate Change is not. I will explain more in the next blog post and look at Australia’s carbon balance in more detail.
And for those readers who like a little more complexity, I include a few diagrams below from an older IPCC report. The numbers are outdated.
The Wet Tropics is where I have chosen to live now and every day I am still learning more and more about this special region. Much of the information in this blog has been copied from Terrain NRM websites: https://terrain.org.au/ and https://www.wettropicsplan.org.au
The Terrain NRM website is full of information, and it is obvious that a lot of time and careful thought was used in its creation. I loved their descriptions of this region. Hence, I have chosen to copy and paste a few sections that I particularly wish to emphasise. The website is now a few years out of date unfortunately.
There are now new threats to this special area that are not described on the Terrain website so in my next few blogs I will be writing about some of these issues. I will also be writing about the role Australia’s natural world plays in climate change and carbon sequestration.
I should note that I am currently Treasurer for an offshoot of Terrain, the Wet Tropics Soilcare group. This group of farmers care for the biota in the soil, reducing fertilizer use while increasing carbon and water in the soil thus protecting the Great Barrier Reef while producing more and better-quality food.
Terrain NRM is an independent, not for profit and community-based environmental management organisation. We think innovatively and act collaboratively, combining the latest science with local knowledge to develop sustainable solutions to increase the resilience of the rainforests, reefs, landscapes and local communities of Australia’s Wet Tropics region.
If you wanted one word to describe the Wet Tropics Region – it would be DIVERSITY.
Have you ever seen a cassawary in the wild?
Photo credits Terrain NRM
The Wet Tropics region is a melting pot of variety with elevated tablelands, vast outback savannah areas and eye-achingly green coastal floodplains nestled between the foot of the highest peaks in Queensland and the Coral Sea.
The region extends from the iconic Daintree forests of the north to the sugarcane land delta of the Herbert River catchment in the south and then west to the dry rangelands of the Upper Herbert.
The Wet Tropics is literally where the rainforest meets the reef.
This is the only place in the world where two World Heritage Areas are located directly adjacent to one another – the Wet Tropics and the Great Barrier Reef.
The great diversity in the rainfall, geology, soils, topography, drainage and altitude has resulted in a complex and extremely varied spectrum of plants and animals as well as many unique landscapes crafted by nature as well as human activity.
It is a region of contrasts.
The community of the Wet Tropics
Over 250,000 people call the Wet Tropics home and work in a variety of industries. The tourism and primary industries sectors form the foundation of the region’s economy.
Cairns is the largest urban centre in the Wet Tropics region with a population of over 150,000 people from 35 nationalities.
The Wet Tropics is home to a rich, vibrant and enduring Indigenous Rainforest Cultural Heritage, handed down since millennium within the many different Traditional Language Groups. These comprise 20 Traditional Owner Tribal groupings with over 100 clans and family groupings. Over 80 legal entities represent Land People and Culture.
In November 2012, the Wet Tropics World Heritage Area was re-listed to formally include its cultural values. This listing recognises that Rainforest Aboriginal heritage is unique to the Wet Tropics and is a remarkable and continuous Indigenous connection with a tropical rainforest environment.
Wet Tropics Biodiversity
Because of the enormous diversity in altitude and climate, the Wet Tropics region is truly a biodiversity hot spot of global significance.
Directly descended from Gondwana Land, pockets of rainforest in this region have survived 8 major stages of evolutionary change over 415 million years and have more life forms with primitive characteristics than anywhere else in the world.
These origins, along with the varied climate and the dramatic shape of the land, combine to create the perfect conditions for mega-biodiversity.
The Wet Tropics contains half of Australia’s bird species, one third of the continent’s mammals and about 3,000 plant species.
Endemic and Rare Species
The Wet Tropics is home to numerous endemic species, which means that they are found nowhere else in the world; many are rare and threatened plants and animals. Of particular interest is the Southern Cassowary, the Mahogany Glider and the Lumholtz Tree Kangaroo, a kangaroo which actually lives in the treetops of the threatened Mabi Forest.
The endemic and rare species don’t all live in protected areas. Visit the Rainforest Reserves website and learn about the Magnificent Brood Frog or the Northern Greater Glider or the Red Goshawk threatened by the Chalumbin Wind Project. https://www.rainforestreserves.org.au/
The ecosystems of the Wet Tropics region have also evolved over thousands of years through active Aboriginal interaction with the land and management of its resources. The plants and animals of the region are a fundamental and integral part of many aspects of the life and culture of Traditional Owners.
Biodiversity and Climate Change
Due to its diversity and the unique warm and wet climatic conditions and altitudinal variation, it is anticipated that the Wet Tropics region will be a really important refuge for quite a number of species in a changing climate. For example, species from further west may move into the Wet Tropics as it becomes drier. Species that currently call the coastal areas ‘home’ may move up the mountain slopes to cooler locations.
Threats to Biodiversity
Although 35% of the Wet Tropics region is in the World Heritage Area, the precious and unique plants and animals are still not adequately protected. There are many threats which, unless dealt with, will continue to erode the extraordinary biodiversity values of this region.
Habitat destruction and fragmentation are top of the list as they destroy ‘homes’ and limit the ability of animals to move and interbreed. Pests and weeds, which are rampant in this warm and wet climate, are another significant threat, while pollution, changing fire regimes and changes to waterways also play a part.
Protecting Biodiversity
Australia is in a unique position to protect the biodiversity of this region. Of the 17 ‘megadiverse’ countries, only 2 are developed. Australia’s low population and continental sovereignty provide a unique opportunity for Australia to be world leaders in the protection of the amazing spectrum of plant and animal life that call this region home.
Everyone has a role to play in keeping their footprint as light as possible, respecting the right of other species to exist and flourish, as well as sharing information about the importance of our plants and animals with future generations. The ecological, economic, cultural and social fabric of our Wet Tropics lives depends on this.
The Wet Tropics Bioregion
The Wet Tropics Bioregion, although only accounting for 0.26% of the total area of Australia, conserves a large proportion of Australia’s biodiversity, as demonstrated in the table below (from Goosem, 2002).
% of Australian Total
Wet Tropics Bioregion land area
0.26%
Animals
Mammals
35%
Birds
40%
Frogs
29%
Reptiles
20%
Freshwater fish
42%
Butterflies
58%
Plants
Vascular plants
26%
Ferns
65%
Cycads
21%
Conifers
37%
Orchids
30%
NB: the Wet Tropics bioregion (ca. 2 million hectares) does not fully align with the Wet Tropics NRM region (2.2 million hectares), and notably does not include the Upper Herbert .In either case, the rivers of this area all flow into the Great Barrier Reef.
Goosem, S. (2002). “Wet Tropics of Queensland World Heritage Area – including an Update of the Original Wet Tropics of Queensland Nomination Dossier”. Wet Tropics Management Authority, Cairns, QLD.
Our People of the Forest
Many Aboriginal people in the region have a mutual obligation or totemic relationship with certain animals or places.
The ecosystems of the Wet Tropics region have evolved over thousands of years through active Aboriginal interaction with the land.
Activities such as fire management, hunting, gathering, harvesting of materials for shelter, tools, ceremony and art and craft have always been integral to the ecology of the Wet Tropics.
The plants and animals of the region are of great importance to Aboriginal culture and there are many customs, stories, songs and dances associated with them. They are a fundamental and integral part of many aspects of the life and culture of Traditional Owners.
Traditional Owners don’t view the plants and animals of their landscape as resources to be exploited. Looking after Country and all the species that live there is a natural obligation for Rainforest Aboriginal People.
Many Aboriginal groups in the region have a totemic relationship with particular animals or plants which are considered their totems.
This means they must abide by the many social and spiritual responsibilities related to that totem and respect and conserve the totem by refraining from eating that species.
Traditional Owner Concerns
Traditional Owners across the whole region have grave concerns about things that threaten the health of the plants and animals of the Wet Tropics, including vegetation clearing, habitat fragmentation, pests and weeds, urban development and climate change.
There is a sense that there isn’t enough awareness of the cultural importance of the plants and animals of this region, and they would like to create more awareness.
They also want to be part of the solution and be respectfully involved in, and benefit socially, culturally and economically from research, planning, monitoring and management of plants and animals.
Please note the green areas on this map. It is such a small area. Please help to save it!
It is now more than 10 days since the massive rally at Ravenshoe, Far North Queensland, recorded by Nick Cater of the Menzies Research Centre. The question now arises as to whether Tania Plibersek, the Minister for the Environment and Water, will again postpone her decision on the fate of this extremely special forested area right next to the Wet Tropics World Heritage Area. The week before the rally, Ark Energy decided to submit a variation to their project. The project had been the subject of a Public Environmental Report. They even changed the name of the project. Locals still know it as Chalumbin Wind Farm. Locals have never confused the Wet Tropics World Heritage Area with the Ark Energy Project Site.
A map of the changes is given below, followed by my response to a Press Statement by Ark Energy. Lastly, I enclose the Statement itself in italics.
Copy of map on the project website
Last Ditch Stand by Ark Energy to Build the Chalumbin Wind Farm
It is only days before the Federal Environment Department were due to announce their decision about Ark Energy’s plan to build a wind farm near Ravenshoe in Far North Queensland. In their desperation, they have even renamed the wind farm and modified the project.
I have not been able to find any reference to the submitted design change or the name change on the EBPC site. I wonder if this is a back door route to keep other Ministers happy.
The site of the proposed wind development, whatever its name, lies within the catchment area of the Great Barrier Reef. Parts of the eastern boundary of the site are contiguous with the World Heritage Wet Tropics Area. This area was named by the IUCN as the second most valuable natural site in the world. It has been recognised for a long time that a much wider barrier protection area is needed next to the World Heritage Area. The ecological value of wet tropical forest is increased by the presence of wet sclerophyll and other forest beside it and should form connectivity between the sections of the World Heritage Area.
Ark Energy divided the proposed “Chalumbin wind farm” into two stages just before issuing the Public Environment Report for comment by the public.
Stage 1 turbines, roads and other infrastructure were mostly in dense, biodiverse forested areas. Stage 2 had areas of more open woodland where cattle grazed and there were some weed and pest infested areas. The forest and waterways of Stage 2 area were still of major importance from a biodiversity viewpoint but not as critical. As a last-ditch stand, Ark Energy has put in a variation of the project to government. If they had really wished to improve the impact of the project, it might have made sense to remove the turbines of Stage I and keep Stage 2.
But, No! Their new concept has basically removed turbines from the Stage 2 area and left the turbines of Stage 1. In other words, they have not removed the major environmental impacts of the proposed project but are making it sound as if they had. Their statements are extremely misleading and only careful perusal of their press release makes this apparent. It was not until we had a clear map of the turbine removal and remaining sites that the real situation could be seen. The press release states that the project completely avoids wet sclerophyll forest adjoining the World Heritage Area. Further information in the document states that “These changes reduce the impacts of the development to 0.7% of wet sclerophyll within 10 km of the project area.” These are carefully worded statements and are very misleading.
The claim is made that “After rehabilitation of the temporary construction disturbance the wind farm would have an operational footprint of approximately 57.6 hectares.” This suggests that full rehabilitation can happen relatively early and that the roads will be mostly rehabilitated. Even if rehabilitation planting could start immediately after the main construction phase, the restoration of actual habitat takes time. However, the roads are still needed for maintenance activities such as lubrication of the turbines, replacement of blades and ultimately removal of the entire wind turbine. I very much doubt that the area of cleared land will become only 57.6 hectares for a long time. In addition, about half a million tons of concrete would be used to form the bases for the turbines and these would not be removed or rehabilitated if the development was to go ahead. Neither will the deep scars on the landscape be rehabilitated.
The offsets are a joke as are so many other statements made in their press release. Offsets should be additional areas, not areas that are left alone. Actually, as I will explain in another blog, the “offset areas” may be subject to impact from the project. The impact assessments do not take into account the loss of soil water by the project.
Do not be fooled! Yet again Ark Energy showed pictures of cattle grazing in areas not impacted by the turbines, roads and other infrastructure. It should be remembered that the cattle stations range from heavily forested land to the east and open forest and pasture to the west.
The whole press statement has been written to make it sound as if they are really caring for our precious biodiversity when they are not. When our biodiversity is lost it is gone forever. It is not only the endangered species that are affected. There are no ways to rehabilitate or offset the loss.
By cutting down and dividing forest which currently works hard to sequester carbon, slow and clean and store water and cool the earth, the gains made by any renewable, unreliable electricity produced are greatly diminished. Indeed, the roads and the giant fan turbines will dry out large areas of forest and turn them into carbon sources rather than carbon sinks. It is quite possible that the carbon dioxide reductions afforded by wind power will be negated by the impact of the project itself. Will the forest itself be destroyed by poor climate change mitigation?
Media release Tuesday 5 September 2023
Controversial wind farm project in Queensland redesigned and renamed.
Environmental impacts reduced to low levels.
A proposed wind farm in north Queensland has shed its controversial name and responded to environmental concerns with a drastic redesign that halves its size.
The former Chalumbin Wind Farm has been renamed Wooroora Station Wind Farm, after its host property Wooroora Pastoral Station, a large cattle-grazing property, and has undergone a drastic redesign in response to concerns about the visual and construction impacts on the property, which is located next to national parks that form part of the Wet Tropics of Queensland World Heritage Area.
Forty-four of 86 wind turbines have been removed, halving the size of the project, and leaving a layout of 42 wind turbines. The new design includes a minimum buffer of 1 km to neighbouring World Heritage areas, and completely avoids wet sclerophyll forest adjoining the World Heritage Area as well as all known magnificent brood frog habitat.
A comprehensive nature positive plan includes rehabilitation of most of the construction disturbance and the establishment of magnificent brood frog nature reserves totalling 1,255 hectares. It also includes First Nations-led fire management and control of widespread feral pests (pigs, dogs, and cats) and invasive weeds, to improve the host property’s habitat for key species including the northern greater glider, masked owl, and spectacled flying-fox.
“These changes reduce the impacts to very low levels. We believe the benefits to the natural environment of this project far outweigh its impacts. Not least of them more clean energy into the grid in a relatively short time period and a significant improvement in habitat for protected species on private land adjacent to protected forests,” said Ark Energy General Manager Development for Queensland, Anthony Russo.
“After extensive public consultation, we have listened to feedback from the community, government, and the traditional owners, and made changes to the project to meet expectations. We look forward to working with all key stakeholders to achieve positive outcomes and we are committed to getting this project right from the outset and delivering on world’s best practice in the energy sector.
“We must navigate the tension between the construction required to transition to a clean energy system and protecting nature, and this project’s evolution offers an excellent case study of major design iterations to achieve nature positive outcomes.”
After rehabilitation of the temporary construction disturbance the wind farm would have an operational footprint of approximately 57.6 hectares.
It is hoped that the new name will also help to address a misunderstanding that the development could impact a nearby wilderness area also known as ‘Chalumbin’.
“Some opponents took advantage of the former name to spread misinformation and make unsubstantiated claims about what kind of habitat and species are in the project area and therefore the environmental impacts of the development. The reality is the project is NOT within the World Heritage area and it is important that the project is represented accurately, and the public have the facts,” said Mr Russo.
A variation has been lodged with the Department of Climate Change, Energy, the Environment and Water, which is currently assessing the proposal. More information on the project is available online at wooroorastationwindfarm.com.au
On 9th September, a rally was held in Ravenshoe. Theoretically it was only days before the Federal Minister for Environment was due to announce her decision on the status of the proposed “Chalumbin Wind Farm”. I fail to see how the word farm applies to the wind turbine industry. Farming involves life that grows and reproduces itself. The proposed wind farm will only kill our beloved forest and all the creatures that live in it – death and destruction while doing very little to help mitigate climate change. The forest itself is doing a much better job while not costing Australia millions of dollars.
At the 11th hour the project proponent Ark Energy has submitted a change to the project. What happens next is unknown up here on the Atherton Tablelands. The fight continues.
Hundreds of people joined the rally which was recorded by Nick Cater of the Menzies Research Centre. The link below takes you to his video on ADH TV which is then followed by his interview with the wonderful Stephen Wilson of Queensland University explaining why companies like Ark Energy are so keen to take on these projects.
Decades ago, I worked as an environmental scientist based in Hong Kong. I still stay in touch with some of my staff, who now are very experienced in their careers. I had heard that Hong Kong people were being warned about buying seafood, particularly seafood from Japan due to the release of water from Fukushima. I received an interesting article yesterday and quote from a section of it in the original Chinese together with the translation. I have omitted the first paragraphs. The references vary in their language but Note 2 is in English.
I jump to the last paragraphs examining the above 7:30 report.
“Of course, you can still argue that the Japanese figures are fake. Then you can also check out Korean news. According to Yonhap news yesterday, the South Korean government has conducted emergency radiation tests at 30 points in the sea after Japan discharged nuclear waste water last Thursday, all samples met safety standards, and so far no radiation has been detected in seafood or imported seafood in South Korea. (Note 2)
In fact, South Korea has never believed in Japan, or even the International Atomic Energy Agency, so since July, South Korea has done its own water quality monitoring at 200 ocean points, and Japan is not welcome. But strangely enough, China has not joined the monitoring ranks like South Korea, just insist on scaring ghosts and doing “big internal propaganda” in mainland China and Hong Kong, letting writers like “financial writers” spread false information, lest the world will cause panic.
“So we can assume” that the central government is playing a big game of chess, aimed at “teaching the Chinese people a lesson in popular science”, guiding the public to snatch up Geiger counters that test nuclear radiation, and then looking back to discover that their own home’s radiation is more than 900 times stronger than Tokyo (note 3) – perhaps China’s building materials problem – the reason behind it is too heartening.”
As expected, the South Koreans have not been able to find fault with seafood or seawater. One has to question the motives of countries who spread fear about radiation when these same countries build and sell nuclear power plants. Is it a question answered as it so often is “Just follow the money trail”?
The International Atomic Energy Agency (IAEA) was created in 1957 in response to the deep fears and expectations generated by the discoveries and diverse uses of nuclear technology. The Agency was set up as the world’s “Atoms for Peace” organization within the United Nations family. From the beginning, it was given the mandate to work with its Member States and multiple partners worldwide to promote safe, secure and peaceful nuclear technologies.
The IAEA’s headquarters are in Vienna, Austria. It also has two regional offices located in Toronto, Canada (since 1979) and Tokyo, Japan (since 1984). The Agency runs laboratories specialized in nuclear technology in Vienna and Seibersdorf, Austria, and in Monaco.
Due to the involvement of both my husband and I in the regulation of uranium mining in Australia, we have a few friends who have worked for the IAEA in the laboratories and in the cleanup of mining areas in parts of the old Soviet Union. One of them had his office across the corridor from the man most responsible for the data on Chernobyl. David did a short consultancy in the Vienna offices. The scientists of the IAEA take their responsibility for nuclear safety very seriously and come from dozens of nations.
When Japan proposed the water discharge from the Fukushima nuclear plant, the IAEA examined the strategy very closely and gave its blessing but insisted that the discharge be monitored very carefully. Japan gave itself a tough standard of 1500 Bq/L knowing that the WHO standard for drinking water was 10,000Bq/L. A lot of data is available online which I have viewed. It is possible to see the data for every tank on site. Some of the tanks containing water cleaned up early in the process contain a fraction too much caesium isotopes. This water will be cleaned up again before release. The IAEA has a website that shows the monitoring data during the discharge in real time.
A snapshot in time (as I am writing) is shown below:
Green dots show that the data indicates that everything is OK. A red dot would indicate that the nuclear company, Tepco, should take action. A grey dot shows that a pump is not operating.
The water after dilution is shown as 207 Bq/L, way below the level Japan set for itself and only 2% of the WHO drinking water standard. It is about this amount each time I looked at the data.
What fascinated me was that seawater has slightly more radiation than the treated water as measured in cps. Although details are not given, Geiger type counters probably do not pick up tritium as the beta rays are so weak. These measurements are used to ensure other radioactive elements such as caesium are not being discharged. As the data shows, the levels in both the treated water and the seawater are very low.
In my last couple of posts, when trying to picture what enormous numbers mean, it was shown that 3 big teaspoons of natural rain falling on my head in Australia would contain about a million tritium atoms. This sounds really scary but as I will gradually show, it is of no concern. Washing our hair would increase the amount.
Tritium forms in our atmosphere every day when cosmic rays hit gases in the air, mostly nitrogen. It is washed down into rivers and streams to the ocean as well as falling directly into the ocean. Tritium forms a minute part of the background radiation that surrounds us always. Life evolved on Earth at a time when background radiation levels were 5, maybe even 10 times higher than today. All life with its complex biochemistry deals with low radiation levels so well, that there was never a need to be able to sense radiation and hence avoid it.
Tritium is even less dangerous than most sources of ionizing radiation. It gently sends out low energy beta rays. Too much of anything can kill us. High dose radiation is dangerous, and we need protection from it. The bigger the ray particle and/or the energy involved, determines just how harmful various forms of radiation are. Tritium’s beta rays are low energy electrons. It has a half life of about twelve and a half years. The rays are so weak, they cannot penetrate the skin. If swallowed most of it leaves as water in our urine within a day or so. If tritium water vapour is breathed in the World Health Organisation standard for drinking water is 10,00, it leaves again within minutes.
This is an ironic look at statements made out to be scientific fact. Most of the fear about radiation is not true and certainly not scientific fact.
I am still scared! A million sounds such a lot!
If you read my earlier posts on tritium, you may recall that 1 TU (Tritium Unit) is one tritium atom in 1018 hydrogen atoms. This is far smaller than one person among all the people on earth. You need to visualize one person only on as many planets as there are people on earth all with similar populations as Earth. Three big teaspoons of water contain 12*1023 hydrogen atoms. One million in 12*1023 is equivalent to 1 in 1018. It is mind boggling small.
Australia receives between 2 and 3 TU in rain falling on our land. 1TU is equivalent to 0.118 Bq /L of water. One becquerel (Bq)is defined as the activity of a quantity of radioactive material in which one nucleus decays per second. The World Health Organization standard for drinking water is 10,000 Bq/L. To reach the same levels of radioactivity in 3 big teaspoons of our rainwater you would need to drink about a quarter of a million litres of water in one day. Whoops! A small fraction of that amount of water as just H2O would kill you.
The human body has 30 to 700*1012 cells. Another enormous number.
So single strand DNA breaks occur naturally in the whole human body over 1016 times a day. This is another enormous number. Our bodies repair this damage.
These slides have been taken from a talk I gave to a group of CSIRO alumni.
The message is that the radioactivity associated with the Fukushima discharge will not harm anything physically. Fear may cause damage to many livelihoods.