Nuclear Power Radiation is Benign! Part 1

This is a copy of a Substack article by Robert Hargraves on April 6.  The full essay will be posted in several parts. https://substack.com/@roberthargraves1

Abstract

The root cause of nuclear power cost and opposition is excessive fear of radiation. This essay explores true observed radiation, effects, harm, and benefits, summarized here, proven later.

Doesn’t radiation from nuclear power plants causes cancer?

No, its radiation damage rates are slower than biological repair rates.

Isn’t the nuclear waste harmful to future generations?

No, we can store used fuel in ground-level casks as penetrating radiation decays away. You’d then have to eat the waste to get sick.

Don’t nuclear power plants cost too much?

Yes, because regulators’ rules were written using the precautionary principle, not today’s scientific observations.

Full Essay

Radiation is a weak carcinogen. After the WW II atomic bombings of Japan we all feared globally destructive nuclear war. To intensify that fear NGOs and nations exaggerated geneticists’ idea that even trivial amounts of radiation constantly degraded human genes through generations, even to birthing three-eyed monsters. When that fiction was disproven, the radiation fear of choice became cancer.

Governments and regulators strove to protect voters from the vague harm of invisible radiation, creating rules and procedures to keep people away from any radiation from nuclear power. These rules constantly became more strict and cumbersome.

These radiation exposure rules from worldwide regulators such as the US Environmental Protection Agency and Nuclear Regulatory Commission created the problem of high cost and long build times, making new nuclear power too expensive. In reality, nuclear power can be the least expensive reliable energy source, at $0.03/kWh, if we educate the public, politicians, and regulators.

Fear can kill. Radiation from the triple Fukushima nuclear reactor meltdown killed no one, but Japan’s fearful government killed over 1,600 people with hasty, unnecessary evacuations.

Nuclear power optimism is on the rise. Will people return to nuclear fear after the next failure leaks some radioactive material out? Perfection is impossible. Radiation releases will happen. Airplanes do crash. People still fly. They understand authentic risks and benefits.

Two Westinghouse AP1000 nuclear power reactors has been powered up in Georgia. Will these be the last commercial US nuclear power plants?
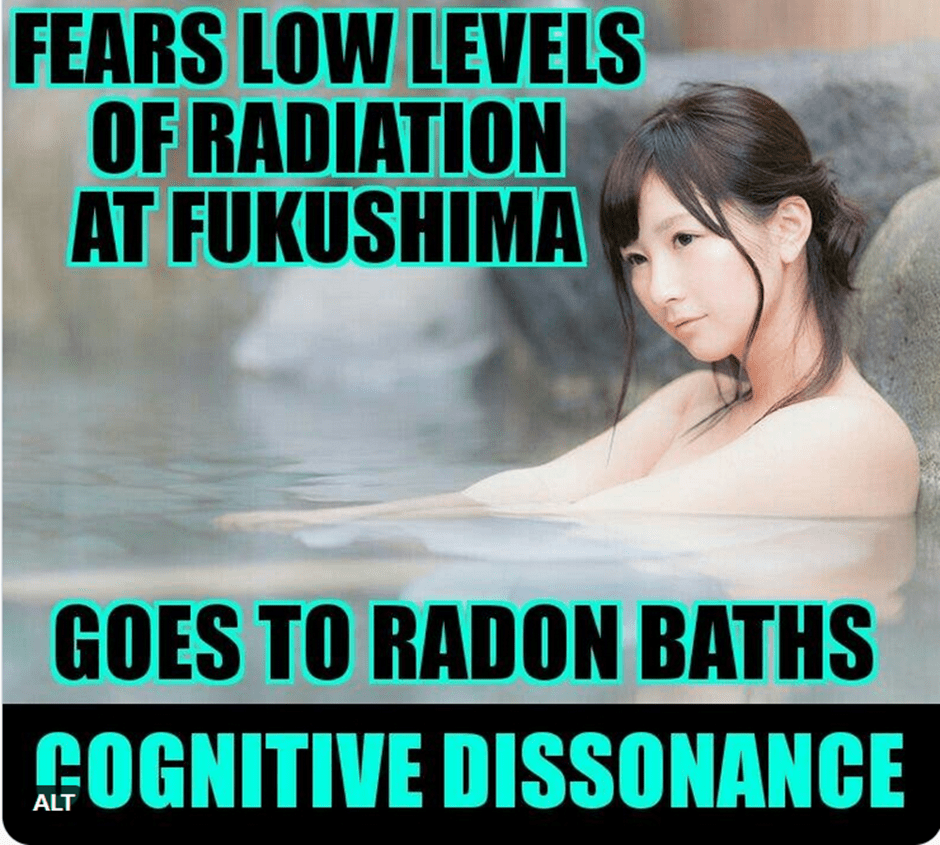
Radiation fear

Wisdom of a woman awarded two Nobel prizes.

Ionizing radiation harms by displacing electrons, breaking molecular bonds in cells. Radiation dose is measured in Sieverts (Sv) or Grays, which are watt-seconds (joules) of energy absorbed, per kilogram of tissue. These are the effects of intensive, brief absorbed doses of radiation.

  • 10 Sv is deadly,
  • 1 Sv risks non-fatal acute radiation sickness,
  • 0.1 Sv slightly increases future cancer risk.

Regulators mistakenly claim any radiation exposure is potentially harmful, so set unreasonably low limits, hoping to calm fearful people. Media headlines frighten people about any radiation leaks, no matter how small, in order to gain attention with headlines.

Nuclear power growth, now in vogue, will end with the next radiation release unless we replace today’s regulators with institutions that balance benefits against quantified radiation doses and observed effects.

The near century of concessions lowering 1934 radiation limits from 0.002 Sv per day to 0.001 Sv per year has not reduced harm. Lowered limits have increased public fear, along with evidence-free rulings that all radiation is potentially fatal.

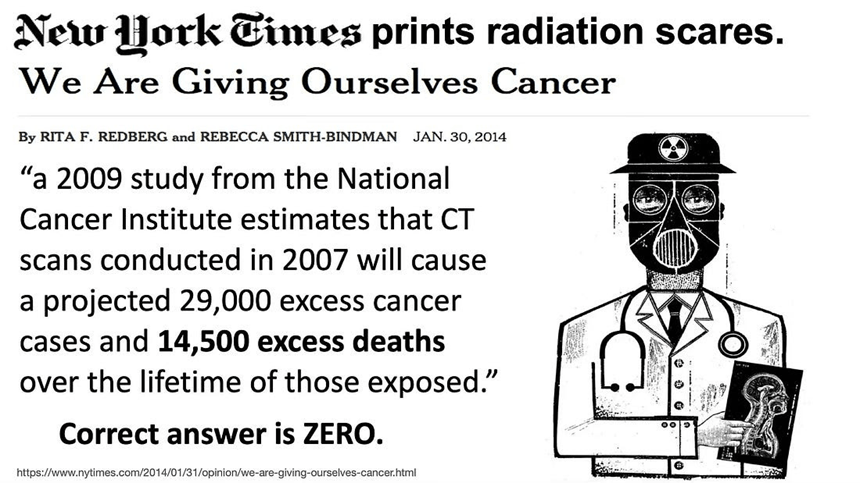
Newspapers often highlight unsubstantiated claims of radiation harm, such as this New York Times fright about CT scans, “a 2009 study from the National Cancer Institute estimates that CT scans conducted in 2007 will cause a projected 29,000 excess cancer cases and 14,500 excess deaths over the lifetime of those exposed.” The correct number is likely zero.

Atomic bomb survivors

After the 1945 atomic bombing of Hiroshima and Nagasaki, people and nations became concerned about the destruction of possible world-wide nuclear war. In 1950 began a studies of the health of the atom bomb survivors. The work was undertaken to make people more aware of the possible long term effects of radiation on genetics, and to increase fear of nuclear warfare. The Radiation Effects Research Foundation (RERF) maintains the data and publishes papers that explore linkages between cancer and radiation exposure. Radiation doses, by individual, were estimated after asking people where they were at the time of the bomb explosions, five years before.

The US National Academies used REFR data to claim that the risk of solid cancer is directly proportional to absorbed radiation dose. They promote the LNT (linear no threshold) model of health effects of radiation, which maintains the chance of cancer is directly proportionate to radiation exposure, and thus there is no safe dose of radiation. They published this following chart of cancer risk for bomb survivors.

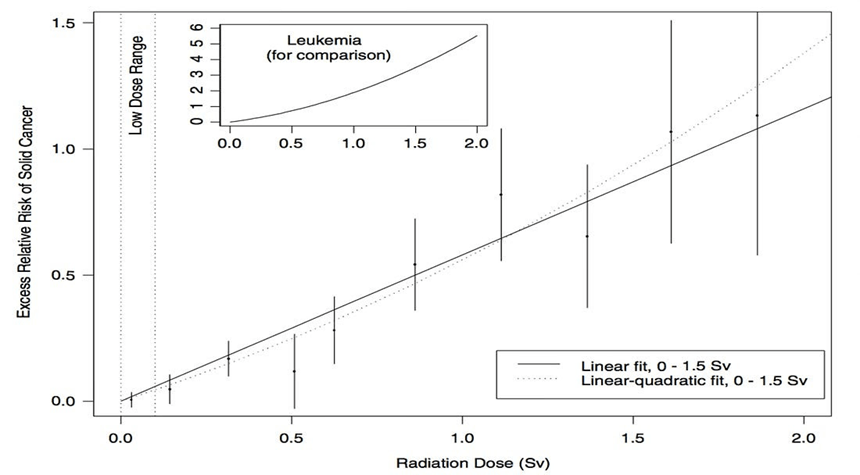
Excess cancer risk for people irradiated by the atomic bomb

However, the data point in the low dose range of exposures less than 0.1 Sv does not show evidence that such low doses case cancer. Few in the radiation science community endorse this LNT model of low dose radiation effects, but LNT remains the official policy of the US EPA, NRC, and many other organizations in the radiation protection industry.

National Council on Radiation Protection hides data refuting LNT.

A 2001 article by Jaworowski and Waligorski illustrated how many scientists were misinforming governments with information tailored to continue the simplistic LNT model. They misled people into fearing that even low level radiation was potentially deadly. The right side of their graphic shows the NCRP’s (National Council on Radiation Protection) seemingly linear relationship between leukemia mortality and radiation exposure for survivors of the atomic bombing, evidencing their support for LNT.

The left hand side shows the UNSCEAR (United Nations Scientific Committee on the Effects of Atomic Radiation) with much more detailed information about the effects of low dose radiation. There is clearly no evidence of increased leukemia mortality from radiation doses under 0.1 Sv (100 mSv). Clearly the LNT model is wrong.

A-bomb survivors’ exposures < 0.1 Sv caused no excess cancers.

The chart above uses bomb survivor cancer data to display that cancer rate increases from radiation, if any, are unobservable at doses < 0 .1 Sv. The leftmost, blue bar represents residents who happened not to be in the cities when the two atomic bombs exploded.

Part 2 will discuss regulation of nuclear facilities

Endnotes

A fully referenced version, with endnotes and URL links, is https://hargraves.s3.us-east-1.amazonaws.com/Benign!+Nuclear+power+radiation.pdf

Let It Burn, Let It Burn – No Houses so Who Cares?

Climate Council please care! https://www.linkedin.com/posts/climate-council_this-is-a-critical-climate-electionand-we-activity-7310759962828230656-Ew5H?utm_source=share&utm_medium=member_desktop&rcm=ACoAAATsRIMBGWSii_UHiFxi192J88YazNv3XGI

This infographic was produced by the Earth Systems and Climate Change Hub. The ESCC Hub was funded by the Australian Government’s National Environmental Science Program and still feeds data into the Global Carbon Project. https://nespclimate.com.au/wp-content/uploads/2021/06/ESCC_Global-and-regional-carbon-budgets_Brochure.pdf

It was our wonderful natural land that acted as a giant carbon sink squirrelling away almost all the carbon dioxide we produced on our land.

Bushfires caused half of that carbon dioxide we produced.

It did not include our fossil fuel exports or our imports of so many goods such as solar panels that are made using fossil fuels.

Sadly, the infographic was changed a few years later, hiding the bush fire source of CO2 by lowering the extent of the ecosystem role. Isn’t it better that we help natural systems and appreciate how much they do for us?

In many parts of Australia, when bushfires start, we simply let them burn. Most firefighting is done by an ageing voluntary fire service with little equipment and even this equipment is old and often no longer safe.

As the climate gets hotter, the potential damage done by bushfire in Australia will increase dramatically unless we do all we can to protect our land from fire and fight fires quickly and effectively when they do start. It has already been shown that access to water bombing helicopters can result in a fire being stopped very quickly. Timing is critical – the sooner a fire is reached and action taken, the less the damage. Too late is too late. Too late is too late!

A First Nations man told me recently that Australia spends less than 5% on fire management and 95% paying for the damage afterwards. He wanted to know why we had it so backwards.

We are spending billions of dollars to reduce the emission of carbon dioxide when we produce electricity. Yet, fire releases far more carbon dioxide and has the potential to become much worse. If we stay on our current pathway, we will destroy the ability of our land to be a carbon sink. Modern technology can tell us in minutes where and when fires start. Let’s start prioritizing the funds we have in our battle against global warming.

Cognitive Dissonance and Low-Dose Radiation

Germany has more radon baths than any other country. Yet they fear nuclear power plants. They closed them down and opened up coal mines knocking down ancient forests in the process. Medical benefit payments are paid out to people who attend the radon spas for relief of muscular-skeletal ailments. The medical fraternity warns of the dangers of radon yet people in pain still seek relief.

People have been using radon baths for thousands of years.  Low dose radiation seems to lessen the pain and immobility of osteoarthritis. But not every patient benefits.

https://www.fau.eu/2019/01/17/news/research/the-healing-effect-of-radon/#:~:text=Thermal%20water%20that%20contains%20radon,Steben%20Health%20Spa%20Research%20Association).

https://pmc.ncbi.nlm.nih.gov/articles/PMC2477705/#:~:text=Radon%20Via%20Bath%20or%20Steam,for%20three%20or%20more%20weeks.

Many studies have shown that the more low dose radiation a population receives, the less cancer there is in the population. This effect is known as hormesis. I can also find studies that state that low dose radiation causes cancer.

 Is anything black or white or just shades of grey? Is anybody totally truthful? We all have our biases. To get a message across about cognitive dissonance I wrote “Low Dose Radiation is not Harmful and May Even Be Good for Us! Nobody Died from Radiation at Fukushima”

But panic and fear of radiation caused the unnecessary deaths of over a thousand Japanese people following the evacuation.

Every decision we make in life rests on our perception of the risk involved versus the benefits. That balancing act changes with circumstances. For example, the amount of radiation used for cancer treatment is huge. None of us would want to receive that much in ordinary circumstances. A medical specialist tells us it is our best chance of beating deadly cancer and we accept the treatment for 2 reasons. Firstly, the radiation will be applied under very controlled conditions to a limited area. Secondly, the whole balance of the situation has changed.

A few years ago, I didn’t agree that Australia should have a nuclear power industry. Did we plan long term enough? Did we plan carefully? Were we just too Gung-ho?

I am now watching the destruction of Australia’s wonderful unique biodiversity as we lose forest and mountain ridges to wind turbine projects in Queensland in the “fight against climate change”. Is the balance, right? Do we have to destroy nature to save the planet?

Ecologists, Barry W. Brook and Corey J. A. Bradshaw ranked 7 major electricity-generation sources (coal, gas, nuclear, biomass, hydro, wind, and solar) based on costs and benefits. They published a paper in 2014 called:  Key role for nuclear energy in global biodiversity conservation. https://conbio.onlinelibrary.wiley.com/doi/full/10.1111/cobi.12433.

This study still stands out. It used multicriteria decision-making analysis and ranked 7 major electricity-generation sources based on costs and benefits. It then tested the sensitivity of the rankings to biases stemming from contrasting philosophical ideals. Irrespective of weightings, nuclear and wind energy had the highest benefit-to-cost ratio.

The Integrated Life-cycle Assessment of Electricity Sources undertaken by the United Nations Economic Commission for Europe which concentrated on Carbon Neutrality in the UNECE Region has been extensively quoted by Oscar Martin on LinkedIn. https://digitallibrary.un.org/record/4020227?ln=en&v=pdf

Nuclear scored far better than wind power (and all other electricity generation types) on nearly all rankings with the exception of water use and of course radiation. Public and occupational exposures to radiation from electricity generation was far higher from coal and even geothermal systems than from conventional nuclear power plants. Likewise, every other of 22 assessed electricity generation types were more carcinogenic than conventional nuclear power.

Potential impacts such as specific biodiversity-related impacts, noise or aesthetic disturbance were not assessed under the land use analysis. Nuclear had the lowest lifecycle impacts on ecosystems, followed by various forms of wind and solar power. Under the land use assessment, renewable technologies were assumed to be readily built on various land types without heavy modifications such as land sealing, mountaintop removal, and flooding.

The assessment of land use which was used in the assessment of ecological impact for wind projects only considered the directly disturbed land (turbine pads, access roads) and assumed the surrounding land could be used for other purposes such as agriculture. For disturbed forests this leads to massive underestimation of the impact. Research in far northern Queensland is finding that impacts from wind turbines on some species in forests can extend 3 km or more from a turbine.

Nature is doing over half the work of reducing carbon dioxide levels worldwide. We can save nature and the planet. With a carefully planned mix of nuclear and other energy sources, we can preserve our biodiversity.

Yes, nuclear power is not 100% safe and clean. Nothing ever is. The benefits to humanity and nature are too great to ignore and far greater than the risk.

Australians for Nature and Nuclear!

What Does It Take to Close a Coal Mine and a Coal-fired Power Station?

Burning coal to produce electricity is a terrible waste when coal has so many other important uses. At this time, the energy from it is still essential for the manufacture of wind turbines, transmission lines and solar panels.

It is not always realised that coal is needed:

as a source of essential ingredients for the manufacture of many dyes, pharmaceuticals, explosives, perfumes, plastics, paints and photographic materials; and

to produce the very high temperatures needed to manufacture steel, cement, aluminium, bricks, glass and some metals and chemicals.

Latrobe Valley, Victoria, Australia

A few weeks ago, David and I attended a conference in the Latrobe Valley held by CRC TiME called “Bridging Diverse Interests”.  https://crctime.com.au/ When a coal mine or any mine is closed down, a complex rehabilitation process follows. Delegates at the conference had the opportunity to visit both Hazelwood and Yallourn brown coal mine  and power station sites.

The Latrobe Valley mines are large, close together, close to local communities and infrastructure. The power stations have a small footprint on each mine site. Mine Land Rehabilitation Authority

Hazelwood Power Station and its associated coal mine stopped operating in 2017. The owner, French company Engie plans to spend a billion dollars rehabilitating the mine site by filling the giant mining pit with water. The volume needed will be greater than that of Sydney Harbour. The plan is still under discussion by many stakeholders. We heard from some of the community groups about their hopes for the site. The closure has already had a big impact on local townships and the staff who lost their jobs. Three years after the closure, a survey found these highly skilled workers were still only earning an average of 50 % of the income received prior to the closure. Questions remain about the feasibility of the rehabilitation plan. Enough water may not be available and contaminant levels in the ash have been highlighted by a green group as a possible long-term issue.

Yallourn Power Station – photo by David Jones

Yallourn is scheduled to close in 2028. River water, currently used by the power station for cooling, will be used to fill the pit.  It will take decades.  The ground is soft, like the brown coal itself, and collapse of the sides of the pit must be carefully avoided. The ash is low in contaminants and should not pose a problem with water quality. Often there is disparity between the requirements of the regulators, the local community, the First Nations People and the technical and economic considerations of the miners. Just because the community desires a certain outcome, it may not be technically possible and safe.

Yallourn Coal Mine: the coal seam is 80 metres thick and can be seen in the background. Lines of trees have been planted in the bottom of the pit. Photo by David Jones

The third power station, Loy Yang, and its associated mine is also scheduled for closure in 2035 bu.

What is the future of the Latrobe Valley? Will it be left with lots of orphaned transmission lines and closed businesses, medical facilities and schools? This will happen unless viable solutions developed in consultation with regional communities are identified and implemented. It has been suggested in other forums that coal-fired power stations could be replaced by nuclear power stations thus making use of these industrial sites and transmission infrastructure, while providing similar jobs for the already skilled workforce. Participants I spoke to from other places in Australia were pro-nuclear but locals were wary. The social licence was not there because of a historical distrust of Government processes. Technically the sites would need to be evaluated for ground stability.

A central theme of the conference was that First Nations People should be properly and fully involved early in the process of planning mine closure.

Mining Rehabilitation

The NT Government is working in partnership with the Australian Government and Traditional Owners to rehabilitate the former Rum Jungle Uranium Mine Site. Early rehabilitation work was undertaken in the 80s and the traditional owner groups were not involved in the process. The site does not meet today’s standards. The current project will remove a major impediment to the site’s return in good order to the Kungarakan and Warai people.

The inspirational project leader, Jackie Hartnett of NT Government, gave an insightful presentation on the project. She has worked hard to find solutions acceptable to all the traditional owners with the tremendous assistance of Gowan Bush, the community manager. Jackie is undertaking the rehabilitation work by training and employing the local people. As a mother myself, I noted that a female birthing site will be restored by sending a stream back to its original path. Nobody knows whether this will be fully successful but the women are delighted.

My husband Dr. David Jones gave a technical presentation on the Rum Jungle Rehabilitation Project on behalf of NT Government as an Industry Fellow of UQ Sustainable Minerals Institute. https://smi.uq.edu.au/ It is noteworthy that the main source of environmental problems on the site is acid mine drainage with copper levels causing the issues rather than uranium or radioactivity.

The presentations were praised by the head of INAP as a new paradigm for mine rehabilitation. INAP stands for International Network for Acid Prevention and is an organisation set up by the mining industry itself to find, promulgate, and use the best methods of preventing and coping with acid and metalliferous drainage (AMD). AMD can occur with any type of mine depending on the geology of the area.

AMD is one of the most serious and potentially enduring environmental problems for the mining industry. Left unchecked, it can result in such long-term water quality impacts that could well be this industry’s most harmful legacy.”  https://www.inap.com.au/

How do we use coal apart from making electricity?

China uses the most coal in the world with the U.S and India in  a distant second place. The U.S. has 2/3 of the world’s known supply. Australia only mines 4% of the world’s coal but we export 80% of it, making Australia the second largest coal exporter in the world. We export low sulfur bituminous coal for energy production used to manufacture “renewable energy infrastructure” and the highly valued and rarer metallurgical coal, also known as coking coal, to produce steel and cement and critical metals and other ingredients.

There are 4 main types of coal and the world still has 400 years’ supply at our current rate of use.

Peat is the youngest form of coal. It is low quality and is burnt for fuel and heating on a small scale or even used as a soil conditioner by gardeners.

Lignite or Brown Coal is about 150 million years old. It has about 50% carbon and low sulfur content. It is used to produce electricity but is relatively inefficient because it has a high water content and must be dried first. This results in the highest amount of carbon dioxide per unit of electricity produced. The Latrobe Valley Coal mines produce brown coal.

Bituminous Coal has a high carbon content ( 50-80%) but often has a high sulfur content. It is the most plentiful type of coal in the U.S. and is about 300 million years old. Sub-bituminous coal has a lower sulfur content and carbon content and is a little younger.  Sub-bituminous coal is the preferred form for power plants.

Anthracite, often known as Metallurgical Coal. is the highest quality of coal with a high carbon  (95%) but low sulfur content and is about 500 million years old. Australia has large supplies of this form of coal which is valued for all its uses apart from electricity production. There is limited supply worldwide and it almost a sin to burn it up to produce electricity. It is the hardest and cleanest burning coal.

Anthracite is valuable

·        as a source of essential ingredients for the manufacture of many dyes, pharmaceuticals, explosives, perfumes, plastics, paints and photographic materials; and

·        to produce the very high temperatures needed to produce steel, cement, aluminium, bricks, glass and some metals and chemicals. The carbon in anthracite forms part of the matrix of steel.

·        It is used in smelting operations to release metals such as lithium from their ores – a very energy intensive process.

Coal pyrolysis, or destructive distillation, is an old technology that started on a commercial scale during the industrial revolution. When coal is burnt without the presence of oxygen, three main products result: coal gas; coal tar; and coke.

Coal tar is the actual source of the essential ingredients to make many products such as some dyes, pharmaceuticals, explosives, perfumes, plastics, paints and photographic materials.

Various forms of gas can substitute for some of coal’s uses. It can act to stabilise the electricity grid much more efficiently and produces far less carbon dioxide per unit of electricity produced.

Hydrogen and some types of nuclear power may be able replace the high temperatures produced by coal and gas as the technologies mature. The production and use of hydrogen is a very energy inefficient.  

What about Oil? Why Can’t We Stop It’s Use Tomorrow?

Nearly half of a barrel of oil is separated as gasoline/petrol. Slightly more than half is used as feedstock in the manufacture of more than 6000 products.  I found a list of 144 of them.  Just taking one item, combs. Can you imagine making combs the old way from turtle shell or bone? The world’s population has grown so much it is hard to imagine doing without many of the items listed below.  And what do we plan to do with all the waste stream of petrol in the future?

Can we face a world without antibiotics and anaesthetics or hospitals? Imagine there are no building materials except wood or mud or straw, no fertilizers or pillows or candles or ink and no forests or wildlife. We still need coal and oil to produce electric cars.

We have a lot of thinking and planning to do. Imagine a world without any:

SolventsDiesel fuelMotor OilBearing Grease
InkFloor WaxBallpoint PensFootball Cleats
UpholsterySweatersBoatsInsecticides
Bicycle TiresSports Car BodiesNail PolishFishing lures
DressesTyresGolf BagsPerfumes
CassettesDishwasher partsTool BoxesShoe Polish
Motorcycle HelmetCaulkingPetroleum JellyTransparent Tape
CD PlayerFaucet WashersAntisepticsClothesline
CurtainsFood PreservativesBasketballsSoap
Vitamin CapsulesAntihistaminesPursesShoes
DashboardsCortisoneDeodorantShoelace Aglets
PuttyDyesPanty HoseRefrigerant
PercolatorsLife JacketsRubbing AlcoholLinings
SkisTV CabinetsShag RugsElectrician’s Tape
Tool RacksCar Battery CasesEpoxyPaint
MopsSlacksInsect RepellentOil Filters
UmbrellasYarnFertilizersHair Colouring
RoofingToilet SeatsFishing RodsLipstick
Denture AdhesiveLinoleumIce Cube TraysSynthetic Rubber
SpeakersPlastic WoodElectric BlanketsGlycerine
Tennis RacketsRubber CementFishing BootsDice
Nylon RopeCandlesTrash BagsHouse Paint
Water PipesHand LotionRoller SkatesSurf Boards
ShampooWheelsPaint RollersShower Curtains
Guitar StringsLuggageAspirinSafety Glasses
AntifreezeFootball HelmetsAwningsEyeglasses
ClothesToothbrushesIce ChestsFootballs
CombsCD’s & DVD’sPaint BrushesDetergents
VaporizersBalloonsSun GlassesTents
Heart ValvesCrayonsParachutesTelephones
EnamelPillowsDishesCameras
AnaestheticsArtificial TurfArtificial limbsBandages
DenturesModel CarsFolding DoorsHair Curlers
Cold creamMovie filmContact lensesDrinking Cups
Fan BeltsCar EnamelShaving CreamAmmonia
RefrigeratorsGolf BallsToothpasteGasoline
https://www.ranken-energy.com/index.php/products-made-from-petroleum/

Australia is Almost Carbon Neutral but Could Go Backwards Very Fast

This is a particularly important blog for Australians. It is time we learnt about our land and just what happens in Australia.

Earth Systems and Climate Change Hub provided a big red flag and some fascinating insights into Australia’s total carbon budget from 2010 to 2019. The ESCC Hub is funded by the Australian Government’s National Environmental Science Program and feeds data into the international entity the Global Carbon Project. Carbon budgets provide information and data to inform and raise awareness about how the world is tracking against the global climate change mitigation challenge. https://nespclimate.com.au/wp-content/uploads/2021/06/ESCC_Global-and-regional-carbon-budgets_Brochure.pdf 

Good News: Australia was almost carbon neutral for the ten years from 2010 to 2019.

We only emitted 0.1% of the carbon dioxide added to the atmosphere worldwide over that 10-year period. It is our wonderful natural land that acted as a giant carbon sink squirrelling away almost all the carbon dioxide we produced. The situation varies from year to year depending on weather conditions and our actions.

Yes, we can save our biodiversity and do our bit to fight climate change at the same time. Indeed, we must do so.

Bad News: bushfires produced half the carbon dioxide.

In many parts of Australia, when bushfires start, we simply let them burn. Most firefighting is done by an ageing voluntary fire service with little equipment and even this equipment is old and often no longer safe.

Work undertaken, particularly in the Northern Territory, shows that traditional fire management practices work well to reduce emissions. Indeed, our First Nations People earn carbon credits using their traditional cultural practices. Using properly timed cool burning techniques, the carbon dioxide produced by fire is greatly diminished. If these practices were used more widely, great savings could be made in the loss of human life, property, and biodiversity. Indeed, scientific studies have shown that biodiversity can even be improved.

As the climate gets hotter, the potential damage done by bushfire in Australia will increase dramatically unless we do all we can to protect our land from fire and fight fires quickly and effectively when they do start. It has already been shown that access to water bombing helicopters can result in fire being stopped very quickly. Timing is critical – the sooner a fire is reached, and action taken, the less the damage. Satellites can now provide the necessary information in real time.

A First Nations man told me recently that Australia spends less than 5% on fire management and 95% paying for the damage afterwards. He wanted to know why we had it so backwards.

We are spending billions of dollars to reduce the emission of carbon dioxide when we produce electricity. Yet, fire releases far more carbon dioxide and has the potential to become much worse. If we stay on our current pathway, we will destroy the ability of our land to be a carbon sink.

Worldwide, natural systems on both land and sea still sequester over half the world’s production of carbon dioxide each year. But there are signs of this slowing. So far, as we have produced more carbon dioxide each year, the natural systems have kept up. We need to be helping natural systems as much as we can, and this is particularly important in Australia. Worldwide, the oceans do half of the work and land systems the other half. But in Australia, our natural land-based systems can sequester all of our carbon dioxide.

Figure: The Australian carbon budget, including natural and human-caused CO2 sources and sinks (and their net effect in the atmosphere). Annual fluxes are the average for the 2010-2019 decade. Units are in million tons of CO2.

What should we do with the resources we have?

  1. Upgrade our fire fighting ability with quicker, scientifically backed fire fighting techniques.  A stitch in time saves nine and saves lots of human lives and property, carbon emissions PLUS our precious BIODIVERSITY.
  2. Use the best sources of energy. Ask: Which power systems impact the least land area, are low carbon, use the least materials in their manufacture,  and can be used to make steel and bricks and cement?
  3. Australia is dotted with pit lakes from mining activities.  Many of these pit lakes may be suitable as a source of water for water bombing in regional areas.

Australia’s Carbon Dioxide Budget

In the process of researching information for this blog, I have learnt a lot that surprised me.  My final conclusions are that we need to be concentrating on 2 things in Australia:

  • Helping nature to do its work in every way we can.
  • Using nuclear power for energy production.  

Know the Enemy

It always helps to know the enemy as best we can when planning the strategy for any fight. It increases our chances of success and reduces costs to ourselves or things we value. When we plan strategies for dealing with “Climate Change”, we really need to understand the big picture or we risk wasting all our resources fiddling around the edges.  Many countries around the world are spending or planning to spend trillions of dollars and so far there has been no global reduction of carbon dioxide emissions to our atmosphere. Meanwhile Nature is being trashed with the survival of more and more species being threatened every year that passes. The threat of food and water shortages is leading to a very unstable world politically as climate refugees try to survive.

Our ability to measure carbon budgets has improved with time.  The recent uses of satellite data and AI systems are impressive.

This blog begins by presenting text and diagrams from the Earth Systems and Climate Change Hub  https://nespclimate.com.au/wp-content/uploads/2021/06/ESCC_Global-and-regional-carbon-budgets_Brochure.pdf  The ESCC Hub is funded by the Australian Government’s National Environmental Science Program. To learn a lot more about their activities, visit https://nespclimate.com.au/  The ESCC Hub feeds data into the international entity the Global Carbon Project. Their diagrams are simpler than those I gave in my last blog but the data is very similar even though the units used are different. I suggest that readers take the time to look closely at the diagrams in this blog.

Tracking emissions of carbon dioxide over time through carbon budgets allows us to quantify and explain how human activities and natural processes add to and subtract emissions from the atmosphere. This can help to identify where the biggest opportunities for mitigation exist, and how carbon-climate feedbacks might help or hinder efforts to achieve global targets for reducing greenhouse gas emissions.

Carbon budgets track sources and sinks of carbon dioxide and their transfer between the atmosphere, ocean and land.

The Global Carbon Dioxide Budget

I start with the Global budget so it can be compared with the unique features of Australia’s carbon budget.

Source: Global Carbon Project – the numbers are in billions of tons of carbon dioxide per year averaged between 2010 and 2019.

The arrows show the major fluxes. So, fossil fuels and industry produce 34.4 billion tons per year (Pg CO2/yr) while land use change emits 5.7 for a total carbon dioxide source of 40.1 billion tons CO2/yr.

The land sink is 12.5 billion tons of CO2 per year and the ocean absorbs 9.2 making a total sink of 21.7 billion tons of carbon dioxide per year. Again, the data shows that natural systems were removing more than half of anthropogenic (man-made) carbon dioxide between 2010 and 2019 averaged over this period.

The land and ocean draw down atmospheric CO2 and act as sinks to slow the accumulation of human caused CO2 emissions, thereby slowing the progression of climate change. Combined, land and ocean sinks removed an annual average of 54 per cent of all CO2 from human activities – with land sinks removing about 31 per cent of all annual emissions and ocean sinks about 23 per cent. These natural sinks therefore play an important service in mitigating climate change.

Although CO2 has continued to accumulate in the atmosphere, the proportion of emissions removed by land and ocean sinks has remained constant over the past 60 years. This suggests that strong self-regulating feedbacks have led the sinks to increase their carbon sequestration capacity over time. However, there is large interannual variability of both the land and ocean sink strength in response to climate variability (e.g. El Niño) and extremes. This suggests likely sensitivity of the sinks to future changes in climate and variability.

Tracking land and ocean sinks and how they may change under a warming and variable climate is vital for understanding the climate change mitigation challenge faced by the international community.

https://nespclimate.com.au/wp-content/uploads/2021/06/ESCC_Global-and-regional-carbon-budgets_Brochure. The brochure is only 4 pages long and worth reading.

Some assessments focus on the carbon cycle as it relates to carbon dioxide just like the one given above. Methane and other greenhouse gases are assessed separately. The assessments discussed in this blog are undertaken in this way. The numbers given track carbon as calculated on the weight of carbon dioxide: CO2 units.  The numbers are higher by 44/12 than when data is presented in C units.  That means all the numbers will be 3.66 times higher than those given in my previous blog post where the data was in C units. As long as all the numbers are in either C units or CO2 units, they are directly comparable. But I have noted assessments that mix up these units and come to erroneous conclusions. All of this blog is in CO2 units.

The Effect of Land-Use ChangesDeforestation, the main driver of land-use emissions, has remained high in the last decade. Re/afforestation has counterbalanced approximately half of the deforestation emissions.

The ocean and land sinks have continued to grow with increasing atmospheric CO2  and take about half of the emissions. Climate change is already reducing these growths by about 4% (ocean sink) and 17% (land sink). Friedlingstein et al 2022; Global Carbon Project 2022. https://www.globalcarbonproject.org/carbonbudget/22/files/GCP_CarbonBudget_2022.pdf

Land Sink removed 29% of total emissions while the Ocean Sink removed 26%.

Surprisingly, Nature still manages to remove almost 60% of our emissions BUT 2015 was a bad year globally as illustrated below due to land use change. We cannot keep destroying the land sink. It does far more for us than all the renewables have so far.  A Gt is the same as a billion tons and the same as Pg.

The Australian Carbon Budget

Note that the data for Australia is in millions of tons of CO2 per year while the global data is in billions of tons of CO2  per year.  Our net emission of CO2  to the atmosphere was 23 million tons per year between 2010 and 2019 on average while the global net emissions were 18.4 billion tons per year. This suggests that Australia only produced 0.12% of the net emissions and that we were nearly carbon neutral from 2010 to 2019.

If only it were that simple.  What about our coal and gas exports? The reality that we are buying our wind turbines and solar systems and batteries and EV cars manufactured overseas some of which has been produced using energy from our coal. Simplistically, one could suggest that Australia’s transition to renewables is actually bad for climate change mitigation. Particularly so when we destroy natural system carbon sequestration when installing wind and solar.

Ref: ESCC Hub brochure – units are in millions of tons of carbon dioxide per year.

In Australia, our natural landscape, our natural ecosystems, removed twice as much carbon dioxide as we produced by using fossil fuels (746 to 386 million tons per year) on average for 2010 to 2019. However, this record was spoilt by fire(398). Thus, on average we fed climate change with our carbon dioxide emissions of only 23 million tons per year.

Unfortunately, Australia is a land of heat, fire and drought. 2019 was a particularly bad year. Due to drought our ecosystems were a source of carbon dioxide and not a major sink. Higher bushfire levels added to our totals.  One of our major sources of carbon dioxide is fire that burns our dry tropical savanna lands over large areas. These fires are usually allowed to burn out and are not fought.  For years now programs to lessen the impact of the fires has been undertaken by our indigenous peoples in the Northern Territory using “cool burns”. In bad years the CO2 from fires can negate all the carbon sequestration land-based Nature does: https://bg.copernicus.org/articles/10/851/2013/

It is our savannah lands that usually do most of the sequestration work. However, In very wet years our arid lands also remove vast quantities of carbon from the atmosphere and tie it up in soil.

Every attempt must be made to keep our land-based ecosystems photosynthesising as much as possible which will maximise carbon sequestration. This means keeping soils damp and not allowing them to heat up any more than can be helped. It means ensuring that we don’t make Australia more arid than it is now. Experiences in many countries around the world show that it is possible to help Nature help us by making arid lands wetter again. This is an enormous topic in itself and will be covered in future blogs.

How We Are Failing to Reduce Regional Climate Effects

Several classic situations exist in my current home state of Queensland.

Stupidly, we built a major transmission line along the peaks  of the Great Dividing Range.  This meant that Renewable Energy Project proponents wanted (needed?) to place their wind turbines and solar installations near this transmission line. This leads to the disturbance then destruction of some of our best remaining forests much earlier than might happen with Climate Change. It has been known for a long time that even narrow roads pushed through forest can change the composition of vegetation up to 100 metres on either side – edge effects. The giant wind turbines require very wide steep roads winding through the mountains, blasting of the mountain tops, direct loss of thousands of ha of forest – step by step loss of our effective land sink.

We forget that in the area near wind turbines, soil and forest dries out making fire risk much higher.

The next examples of poor planning and policy relates to solar energy.  In Queensland, the big solar farms need to be turned down when there is too much electricity produced during the day. Never mind negative prices for large scale solar, operators still get their carbon credits which still makes operating them a financially attractive investment.

 When the sun goes down solar energy stops. So, at night most of our power comes from coal-fired power stations which still need to run all day as they cannot ramp up from zero.

Roof top solar does a great job but subsidies have not encouraged battery storage with roof top solar. The Australian Energy Market Operator (AEMO) has no means to control roof top solar.

We keep hearing how the “Energy Plan” will create jobs.  Up here in the Far North, tourism is a very important part of our economy.  Mangling our Natural Assets doesn’t help.  Coal Fired Power Stations hire lots of skilled workers. When the power stations close their income plummets. https://theconversation.com/heres-what-happens-to-workers-when-coal-fired-power-plants-close-it-isnt-good-215434

The pseudo “Green” economy seems to replace some of these jobs with lower paid jobs – what someone described to me as “Toilet Jobs”. In contrast, replacing coal fired power stations with nuclear facilities would keep these skilled workers and provide even better paid positions.

Lastly, fire- fighting in most of Australia is dependent on Volunteer Rural Fire Brigades with little equipment. Should we be spending far more resources on fire mitigation? Logically, it takes a lot more effort to fight big fires than to deal with them adequately when they first start. Satellite systems and AI could be used to pinpoint fires early. Would we be better to spend all those billions of dollars on the very best fire-fighting personnel and equipment rather than imported renewables?

In conclusion, I believe we need to be concentrating on 2 things in Australia:

  • Helping nature to do its work in every way we can.
  • Using nuclear power for energy production.  

What Will the Fate of the Proposed Chalumbin Wind Development Be? Notes from Far North Queensland

It is now more than 10 days since the massive rally at Ravenshoe, Far North Queensland, recorded by Nick Cater of the Menzies Research Centre. The question now arises as to whether Tania Plibersek, the Minister for the Environment and Water, will again postpone her decision on the fate of this extremely special forested area right next to the Wet Tropics World Heritage Area. The week before the rally, Ark Energy decided to submit a variation to their project. The project had been the subject of a Public Environmental Report.  They even changed the name of the project.  Locals still know it as Chalumbin Wind Farm. Locals have never confused the Wet Tropics World Heritage Area with the Ark Energy Project Site.

A map of the changes is given below, followed by my response to a Press Statement by Ark Energy. Lastly, I enclose the Statement itself in italics.

Copy of map on the project website

Last Ditch Stand by Ark Energy to Build the Chalumbin Wind Farm

It is only days before the Federal Environment Department were due to announce their decision about Ark Energy’s plan to build a wind farm near Ravenshoe in Far North Queensland. In their desperation, they have even renamed the wind farm and modified the project.

I have not been able to find any reference to the submitted design change or the name change on the EBPC site. I wonder if this is a back door route to keep other Ministers happy.

The site of the proposed wind development, whatever its name, lies within the catchment area of the Great Barrier Reef. Parts of the eastern boundary of the site are contiguous with the World Heritage Wet Tropics Area. This area was named by the IUCN as the second most valuable natural site in the world. It has been recognised for a long time that a much wider barrier protection area is needed next to the World Heritage Area. The ecological value of wet tropical forest is increased by the presence of wet sclerophyll and other forest beside it and should form connectivity between the sections of the World Heritage Area.

Ark Energy divided the proposed “Chalumbin wind farm” into two stages just before issuing the Public Environment Report for comment by the public.

Stage 1 turbines, roads and other infrastructure were mostly in dense, biodiverse forested areas. Stage 2 had areas of more open woodland where cattle grazed and there were some weed and pest infested areas. The forest and waterways of Stage 2 area were still of major importance from a biodiversity viewpoint but not as critical. As a last-ditch stand, Ark Energy has put in a variation of the project to government. If they had really wished to improve the impact of the project, it might have made sense to remove the turbines of Stage I and keep Stage 2.

But, No! Their new concept has basically removed turbines from the Stage 2 area and left the turbines of Stage 1. In other words, they have not removed the major environmental impacts of the proposed project but are making it sound as if they had. Their statements are extremely misleading and only careful perusal of their press release makes this apparent. It was not until we had a clear map of the turbine removal and remaining sites that the real situation could be seen. The press release states that the project completely avoids wet sclerophyll forest adjoining the World Heritage Area. Further information in the document states that “These changes reduce the impacts of the development to 0.7% of wet sclerophyll within 10 km of the project area.” These are carefully worded statements and are very misleading.

 The claim is made that “After rehabilitation of the temporary construction disturbance the wind farm would have an operational footprint of approximately 57.6 hectares.” This suggests that full rehabilitation can happen relatively early and that the roads will be mostly rehabilitated. Even if rehabilitation planting could start immediately after the main construction phase, the restoration of actual habitat takes time. However, the roads are still needed for maintenance activities such as lubrication of the turbines, replacement of blades and ultimately removal of the entire wind turbine.  I very much doubt that the area of cleared land will become only 57.6 hectares for a long time. In addition, about half a million tons of concrete would be used to form the bases for the turbines and these would not be removed or rehabilitated if the development was to go ahead. Neither will the deep scars on the landscape be rehabilitated.

The offsets are a joke as are so many other statements made in their press release. Offsets should be additional areas, not areas that are left alone.  Actually, as I will explain in another blog, the “offset areas” may be subject to impact from the project. The impact assessments do not take into account the loss of soil water by the project.

Do not be fooled! Yet again Ark Energy showed pictures of cattle grazing in areas not impacted by the turbines, roads and other infrastructure. It should be remembered that the cattle stations range from heavily forested land to the east and open forest and pasture to the west.

The whole press statement has been written to make it sound as if they are really caring for our precious biodiversity when they are not. When our biodiversity is lost it is gone forever. It is not only the endangered species that are affected. There are no ways to rehabilitate or offset the loss.

By cutting down and dividing forest which currently works hard to sequester carbon, slow and clean and store water and cool the earth, the gains made by any renewable, unreliable electricity produced are greatly diminished. Indeed, the roads and the giant fan turbines will dry out large areas of forest and turn them into carbon sources rather than carbon sinks.  It is quite possible that the carbon dioxide reductions afforded by wind power will be negated by the impact of the project itself. Will the forest itself be destroyed by poor climate change mitigation?

Media release Tuesday 5 September 2023 

Controversial wind farm project in Queensland redesigned and renamed.

Environmental impacts reduced to low levels. 

A proposed wind farm in north Queensland has shed its controversial name and responded to environmental concerns with a drastic redesign that halves its size.  

The former Chalumbin Wind Farm has been renamed Wooroora Station Wind Farm, after its host property Wooroora Pastoral Station, a large cattle-grazing property, and has undergone a drastic redesign in response to concerns about the visual and construction impacts on the property, which is located next to national parks that form part of the Wet Tropics of Queensland World Heritage Area. 

 Forty-four of 86 wind turbines have been removed, halving the size of the project, and leaving a layout of 42 wind turbines. The new design includes a minimum buffer of 1 km to neighbouring World Heritage areas, and completely avoids wet sclerophyll forest adjoining the World Heritage Area as well as all known magnificent brood frog habitat. 

 A comprehensive nature positive plan includes rehabilitation of most of the construction disturbance and the establishment of magnificent brood frog nature reserves totalling 1,255 hectares. It also includes First Nations-led fire management and control of widespread feral pests (pigs, dogs, and cats) and invasive weeds, to improve the host property’s habitat for key species including the northern greater glider, masked owl, and spectacled flying-fox.  

 “These changes reduce the impacts to very low levels. We believe the benefits to the natural environment of this project far outweigh its impacts. Not least of them more clean energy into the grid in a relatively short time period and a significant improvement in habitat for protected species on private land adjacent to protected forests,” said Ark Energy General Manager Development for Queensland, Anthony Russo.

  “After extensive public consultation, we have listened to feedback from the community, government, and the traditional owners, and made changes to the project to meet expectations. We look forward to working with all key stakeholders to achieve positive outcomes and we are committed to getting this project right from the outset and delivering on world’s best practice in the energy sector.

 “We must navigate the tension between the construction required to transition to a clean energy system and protecting nature, and this project’s evolution offers an excellent case study of major design iterations to achieve nature positive outcomes.”  

  After rehabilitation of the temporary construction disturbance the wind farm would have an operational footprint of approximately 57.6 hectares. 

 It is hoped that the new name will also help to address a misunderstanding that the development could impact a nearby wilderness area also known as ‘Chalumbin’.  

 “Some opponents took advantage of the former name to spread misinformation and make unsubstantiated claims about what kind of habitat and species are in the project area and therefore the environmental impacts of the development. The reality is the project is NOT within the World Heritage area and it is important that the project is represented accurately, and the public have the facts,” said Mr Russo. 

 A variation has been lodged with the Department of Climate Change, Energy, the Environment and Water, which is currently assessing the proposal.  More information on the project is available online at wooroorastationwindfarm.com.au 

Are We Forgetting the Aim of the Energy Transition?

Humans have lived through a range of temperature changes. It is recent civilization that we are trying to save with people living all over the earth in great numbers needing a lot of energy not least in the form of food. We tend to forget how hard life was trying to have enough energy to survive even after we discovered fire.  For most of our existence, the only way for a few individuals to get ahead a little was to use slaves or beasts of burden or warriors. These living energy sources were fed as little as possible or used as canon fodder.  They rarely lived very long.

Then, only a few centuries ago, we discovered much more energy dense fossil fuels.  Suddenly, we could abhor slave labour, care about animal welfare and we could all have good shelter and food.  Poverty has been slowly disappearing in many parts of the world.

Our modern food production is very dependent on a stable climate. It is also very energy intensive.  A few degrees of extra heat or a little less rain has devastating effects on production levels. 

How do we balance energy needs with maintaining a stable climate?  The critical action at this time is lowering greenhouse gas emissions. To do this, the biggest tasks are the electrification of many processes as possible, decarbonization of electricity generation and carbon capture and storage. What is the only energy efficient and cost-effective method of carbon capture and storage? As discussed in my previous blog natural systems are wonderful at carbon capture and storage. Let nature do its work!

Hydro, wind, solar, nuclear, and geothermal power plants all use up energy and produce relatively small amounts of carbon dioxide in their manufacture, construction, demolition, and recycling. Energy is used in the mining for their manufacture.  Some require lots of backup storage or have other firming or conversion requirements. All require transmission lines.

What are Queensland’s Plans?

Queensland Government plans to deliver:

  • 50% renewable energy target by 2030
  • 30% emissions reduction below 2005 levels by 2030
  • 70% renewable energy by 2032
  • 80% renewable energy by 2035
  • zero net emissions by 2050.

Far North Queensland has two wind farms, Mt Emerald (180MW) and Windy Hill(24MW), with a third, the Kaban Green Power Hub under construction. Under Phase 1, the government has invested $40 million to upgrade the coastal 157 KV transmission infrastructure between Cairns and Townsville to 275KV. This investment will provide up to 500 MW of renewable energy connection potential in Far North Queensland. Several investors have shown interest in the area, with the $400 million 157 MW Kaban Wind Farm now under construction and expected to be operational this year. At Kaban there are 28 wind turbines which are 226m in height to the tip of the blade.

A photograph of Kaban Wind Farm taken Dec 2022. More roads and turbines can be seen in the distance.

Windy Hill has been running just over 20 years and has already needed to replace the wind turbine blades.

During the second half of last year, the Draft Public Environment Report was issued for the proposed Chalumbin Wind Farm on two grazing properties in Far North Queensland. These properties border the World Heritage Wet Tropics on the East and extend westward to the scattered woodland of the Einasleigh Uplands on the West.  Early pictures of the site by Epuron showed cattle grazing in scattered woodland but in reality, most of the wind turbines were to be sited on mountain ridges close to the eastern boundary in dense eucalypt and transitional forest. The potential impacts from the project are substantial and wide-ranging including threats to endangered species and aboriginal cultural heritage.

The site of the proposed Chalumbin Wind farm.

Photos used in publicity about Chalumbin Wind Farm

Under the current Australian system, comments on a draft PER can only be submitted to the Project Proponent. The proponent then revises the document and sends the document plus the comments to The Federal Minister for the Environment.  A decision on the Chalumbin project under the EPBC Act is yet to be issued and has already been postponed a few times. At one stage during the comment period, the Proponent put a full-page ad in the Cairns Post stating that they would welcome positive comments thus inferring that they would not accept negative comments.

A few locals have calculated the implications of the project from a carbon dioxide viewpoint. There were a number of omissions and critical mistakes in the Chalumbin PER about this topic such as equating carbon loads with carbon dioxide loads. This is a factor of 44 to 12.

Figures for the loss of forest carbon storage following clearance vary depending on the type of forest. The Chalumbin site is mostly pretty dense forest with good canopy cover for much of the areas where turbines are to be located. There are many trees with diameters of a metre or more. The carbon stored in these trees would be lost immediately if the trees are piled up and burnt or more slowly if the biomass is just allowed to rot.

Other losses following clearing include soil carbon, carbon from the roots and from soil biota. Estimates made on eucalypt plantations of soil carbon and root carbon loss suggest this can be double or more the above ground loss depending on the eucalypt species, the age of the trees and the rainfall. 

Many studies suggest that natural forests are better at carbon sequestration than plantation eucalypts and that tropical wetter eucalypt forests are better still.

At Chalumbin, I have conservatively calculated that loss of carbon dioxide to the atmosphere during clearing will be about 2 million tonnes. Loss of sequestration over 20 years by this lost forest is 1.1 million tonnes or more. The carbon dioxide footprint of the wind turbines during their manufacture and transport to the site is about 300,000 tonnes. This is a total of 3.4 million tonnes.

The maximum savings in carbon dioxide made by replacing current power production with wind power  at Chalumbin is 12 million tonnes of carbon dioxide over a period of 20 years assuming a capacity factor of 30%.  The currently operating Mt Emerald Wind Farm has not achieved this capacity. So, this estimate should be dropped to 10 million tonnes or less.

This means that at least a third of the lowering of greenhouse gas emissions are lost by building a wind farm in this precious forest.

The losses don’t stop with Chalumbin.

Wind farm projects being proposed in the Wet Tropics Catchment Area are numerous and in areas of high biodiversity value, close to World Heritage areas and on the mountain ridges. This is death by a thousand cuts. The cumulative impacts from wind farm projects in the Wet Tropics Area will be unacceptability large and not usually considered.

Fragmentation of Forest and Edge Effects Destroy Biodiversity and Carbon Sequestration

Edge effects strongly affect forest microclimate, tree mortality, carbon storage and a diversity of fauna.

The hydrological regimes of fragmented landscapes differ markedly from those of intact forest. Desiccating conditions may penetrate up to 100m into areas near the roads. Streams in fragmented landscapes experience greater temporal variation in flow rate than do those in intact forests. Cleared areas have less evapotranspiration and rainfall interception and absorption by vegetation. Rapid runoff promotes localized flooding in the wet season and stream failure in the dry season, with potentially important impacts on aquatic animals.

Even narrow forest roads (20–30m) result in increased tree mortality and damage with wide-ranging alterations in the community composition of trees and undergrowth. Some insects and other fauna will not cross even narrow roads, yet hundreds of km of 70m or wider roads are being proposed.

If our forests are themselves at risk from Climate Change, forest fragmentation will accelerate the process.

Proposed Wind Farms Could Add Pollution to the Great Barrier Reef

Projects like Chalumbin lie on the head waters of the river catchments of the Wet Tropics Area. Hundreds of kms of unsealed 70-metre-wide roads that cross waterways have the potential to dump turbid water and other pollutants down rivers through areas of World Heritage Rain Forest out to the Great Barrier Reef. Farmers fear they will be blamed for the impacts.

We should remember that pollution accidents do happen. Wind turbines need lubricating and “oil changes” every 3 to 7 years. Over 200 litres of oil or synthetic lubricant is needed per turbine.

Building Wind Farms in Forests is a Terrible Waste

Forests are giant carbon and water storage batteries. Why discharge greenhouse gases to the atmosphere by land clearing and lose all the benefits forests provide in the mitigation of climate change? When they are gone, we lose all the carbon sequestration and cooling they do every day. Natural forests do this better than plantation forests.

By clearing forest to build wind farms, we lose a very substantial proportion of the carbon savings we would make by siting them elsewhere. A substantial proportion of what we gain in lower carbon emissions from wind power, we lose by destroying forests.

Even worse, we contribute to climate change through the loss of a range of mechanisms forests provide, long before any of the benefits of wind energy mitigate carbon emissions. This is needlessly making climate change worse in the short term which is the opposite to why we are setting 2030 targets.

We are also desecrating our irreplaceable biodiversity, Aboriginal cultural heritage, and tourist jobs in areas of high importance. High quality patches of remnant forest are rare and precious, and one proposed windfarm project area was being planned for inclusion in National Parks in the future. What a waste! We can fight climate change and protect our natural diversity at the same time. When our natural assets are gone, they are gone!

Loss of Forest Affects Cloud Formation and Alters the Hydrological Cycles 

Loss of forest on mountain tops will lessen rainfall and lead to more droughts and flooding. While one project may have almost negligible impact on weather, many more wind farms are proposed. The wind farm projects change the land use from forest to major industrial, with major extensions to each project being possible with much less assessment. This will impact on both our World Heritage listed Wet Tropical Forests and Great Barrier Reef while drying our inland agricultural lands to the west. Good agricultural land is critical to our future.

In Conclusion

 A substantial portion of the savings in carbon dioxide emissions made by using wind power are lost by building them in our precious forests. What a waste!

What worth do we put on the loss of biodiversity and ecosystems, stunning landscapes, natural carbon sequestration and storage. Forests cool the earth and make it rain. Forests soak up runoff like giant sponges and help prevent flooding, while recharging aquifers. They clean the water of pollutants so that most of the water going to the Great Barrier Reef is clean. Forest stabilises the soil so that turbid water does not kill frogs, fish, or corals.

We are putting so much at risk by building wind farms where they should not be.

I thought the goal was to fight climate change, not make it worse.

The photos in this blog are courtesy of Michael Seebeck and Steven Nowakowski

In my next blog I will provide more information about Queensland’s Energy and Jobs Plan, the Queensland SuperGrid.

How Important are Queensland’s Forests?

Worldwide, fossil fuel use spews about 37 billion tonnes of carbon dioxide into the atmosphere each year. Recent technologies have been used to determine just how much work forests do when storing carbon.  Between 2001 and 2019, forests emitted an average of 8.1 billion metric tonnes of carbon dioxide per year from deforestation and other disturbances. At the same time, forests absorbed 16 billion metric tonnes of carbon dioxide per year. 

Just imagine how much more efficient and cheaper it would be if existing forests were allowed to do their work in Queensland without disturbance. Denser forests and rapidly growing forests are particularly important. We should not forget that Queensland has nearly 40 % of Australia’s forests.

Hopefully, no one would argue that forests alone can save us from climate change, but they have a major role to play. If we do not protect forests as much as we can, we will suffer far worse climate change impacts.

The Climate Council states on https://www.climatecouncil.org.au/deforestation/

It is not effective to “offset” greenhouse gas pollution from burning fossil fuels by storing carbon in forests. This is because fossil fuels are pumping much more carbon dioxide into the atmosphere than existing forests can absorb. At the same time, carbon stores in forests and other natural carbon sinks will become increasingly unstable as climate change progresses. Droughts, tropical storms, heatwaves and fire weather are increasing in severity and frequency because of climate change. This will continue to result in increases in forest losses, contributing to more and more carbon dioxide being released into the atmosphere. Risks are significantly reduced but not avoided by keeping the rise in global temperature well below 2°C.

The future

Protecting natural ecosystems and sustainably managing and re-establishing forests are important ways to reduce greenhouse gas emissions and slow down temperature rise in the short term by drawing down carbon dioxide from the atmosphere. At the same time, we must deeply and rapidly reduce global greenhouse gas emissions levels from fossil fuels – coal, oil and gas. If we do only the former and not the latter, we risk transforming more and more of our carbon sinks into carbon sources as climate change progresses.

Oh Dear! Yes, there is a risk that we could lose all our forests to Climate Change and that really would be Armageddon. Should we just stay on our current path and let it happen? Man has a tendency to picture the worst.  It is an emotional response from our primitive brains.  This type of thinking makes excuses and leads to a lack of appropriate action.  Let’s just run around in circles instead, wasting money and time. /sarcasm

Why are forests vital?

  1. Even now Earth’s forests are still capable of pulling nearly half the carbon dioxide produced by fossil fuels out of the atmosphere despite the clearing that has already happened. We must stop destroying our forests so that they can do this task to the greatest extent possible.
  2. Forests keep the earth’s temperature down by 1°C or more. This happens in a number of ways. They shade the ground. They pull heat out of the atmosphere by using the sun’s rays for photosynthesis, they manufacture many products some of which they pass to the organisms in the soil in addition to wood formation. They also cool their surroundings using evapotranspiration, a technique similar to our evaporative coolers.
  3. Forests are a very important part of the hydrological cycle and help to stabilise our climate in a number of ways. The soils below forests can be giant water sponges. This is particularly important on mountain ranges such as Australia’s Great Dividing Range. The water for rainfall passes down the mountain slopes much more slowly, preventing erosion and keeping our water clean and safe. The forest on mountain tops is important in cloud formation. It has been shown time and time again that rainfall is diminished if mountain tops are disturbed.  In Australia this can lead to increased drought and flooding when it does rain.
  4. As well as being a stabilising force for the climate, forests regulate ecosystems, protect biodiversity, play an integral part in the carbon cycle, and supply goods and services including shelter and food.

In order to maximise the climate benefits of forests, we must keep more forest landscapes intact, manage them more sustainably, and restore more of those landscapes which we have lost (from a recent IUCN statement).

What is Australia’s record? Nearly 50% of our forest cover has been cleared in the last two centuries, making Australia one of the worst developed countries for deforestation.

In Queensland about half of our recent clearing activity has been in catchment areas of the Great Barrier Reef particularly south of Townsville. WWF was not wrong when in December 2022 it stated that Queensland  remains the land clearing capital of Australia.

Have we learnt any lessons? No, now we are threatening the densest eucalyptus forests clustering around our wet tropical rainforests near Cairns.

Australia’s best winds to drive wind turbines are found in the south-west. Places like Tasmania lie in the path of the Roaring 40s. Because the wind doesn’t always blow, a myth was set up that the wind would blow in these periods somewhere else and where better than the  far north-east of Australia. The performance of existing wind farms in Far North Queensland is low at best and abysmal frequently. When the strong winds of the North come, we call them cyclones and the turbines will be shut down and are likely to suffer damage.

So, the current plan is to desecrate hard-working tropical forests to build poorly performing wind turbines. This is neither effective or efficient in money terms or in climate change mitigation terms.

The forest areas threatened by all the wind energy projects on the books or already being constructed are some of the most valuable in the world.

Here is just another of my slides.

There are alternatives to this rampant stupidity.

In my next blogs I discuss some of these projects in more detail. In the meantime, you might like to look at this brochure from Rainforest Reserves.

https://drive.google.com/file/d/11JoRdwId1ChhBbIivPOCj5oEAMHKhdfd/view?usp=drive_link

Is Queensland on the wrong energy path?

We have so much to do to meet the challenges of climate change. We only have limited time, money and resources. So, it becomes critical that we don’t act like headless chooks running around in circles wasting energy.  Whatever we do needs to be efficient and well planned and evaluated.

Our public electricity production generates more carbon dioxide per unit of electricity than most of the developed world. On the positive side, our households generate and use a very high level of solar energy outside of the public system.

The Queensland Government reports that our greenhouse emissions have already fallen by 29% since 2005.  Our target for 2030 is 30% below our emission levels in 2005. This suggests that we have almost reached our target. What is responsible for this decrease?  It is all about clearing land.

The forests in Queensland are doing a great job of capturing and storing the carbon dioxide we produce. Perversely the decrease in the emission data is entirely due to the slowdown in the rate of forest clearing.  When forests are cleared two changes occur.  Firstly, there is less forest working hard on our behalf. Secondly, the felled trees and the soil beneath release their stored carbon back into the atmosphere.

Let’s look at some of the data.

How is Queensland going? Queensland’s carbon intensity of electricity consumption is currently almost 700 gCO2eq/kWh. Only a couple of areas in the world produce more carbon dioxide from the production of electricity per unit of electricity. Grant Chalmers presents this data on a regular basis.

For comparison, Tasmania only produces about 25 g of carbon dioxide per kilowatt-hour of electricity produced while South Australia manages an average of slightly more than 100 g per kilowatt-hour of electricity. However, during the night, South Australia hits 400 after the sun goes down when it still relies on the dirtiest form of electricity produced – Victoria’s brown coal.

Unfortunately, most data available from Government sources are a year older than Grant’s data. Grant’s data does not take into account electricity used directly from rooftop solar.

The graph below provides an overview of Queensland’s production of greenhouse gases.

Two sectors stand out: Land use, land-use change and forestry at -3.2% and public electricity producing nearly a third of the greenhouse gases. The graph below shows how the various sectors have changed over time.

Even the quickest of glances at the graph above shows that greenhouse gas emissions from most sectors have not changed much or even risen since 2005. But look at the fall from the land use, land use change and forestry sector: 70 to below zero. In 2005 about one third of Queensland’s greenhouse gas emissions came from the land use change. Our forests and well managed soils are now just counteracting the damage we are still doing by removing trees in forests but also on grasslands.

This data comes from https://www.des.qld.gov.au/climateaction/emissions-targets if you would like to dig a lot deeper.

The slide below comes from one of my talks and was prepared using information published by the UN.

In my next blog I provide a little more information about the forests in Queensland.

2h Life Cycle Analyses

I have included this graph again, as it shows the levels of greenhouse gas emissions from various power sources.

These sorts of graphs take an enormous amount of work particularly when they attempt to fully consider the life cycle of an energy source.

I could not access a full copy of the paper illustrated above and so could not check what all the sources of indirect emissions were. It takes into account all greenhouse gases. The indirect emissions from hydro arise from the production of methane and the breakdown of vegetable matter covered by the water. I would like to see an analysis for the CO2 produced when forests are chopped down to build wind farms.

Despite any variations in the numbers, the message is clear, nuclear power is a very low carbon source.

Another complication that arises when looking at emission levels arising from manufactured products is geographical and technical. For example, what were the sources of energy used during the mining, and manufacturing processes? The graph below shows how different assessments can be.

For example, when assessing CO2 emissions from electric cars, it really matters where the car was manufactured and what source of energy was used during all the stages of mining and manufacture as well as the energy used to run the cars.

You may like to view the video below by Michael Shellenberger: Why I changed my mind about nuclear power.